
The United States is the only industrialized country in the world without universal health care — and as a result, most Americans under age 65 receive employer-based health insurance coverage. Under this system, an estimated 28.9 million Americans under age 65 were uninsured in 2019 — before over 22 million Americans lost their jobs in the early months of the COVID-19 pandemic.
While most of those jobs have since been restored, the official uninsured rate for Americans younger than 65 in 2020 will likely be higher than the 10.3% rate in 2019 — a continuation of the three-year trend of declining insurance coverage that began in 2017. Still, there are many parts of the country where nearly every American under 65 is insured, either through their employer, Medicaid, or directly purchased coverage.
Using data from the U.S. Census Bureau, 24/7 Wall St. identified the 50 counties with the best health insurance coverage. Counties are ranked on the share of residents under age 65 — the age of eligibility for Medicare — who are uninsured.
The counties on this list span 15 states, primarily in the Midwest and Northeast. Over half of the 14 counties in Massachusetts rank on this list largely because the state was a national leader in health care reform, enacting laws that led to near-universal coverage almost half a decade before the Affordable Care Act was signed into law under the Obama Administration.
Click here to see counties with the best health insurance coverage.
Click here to see our methodology.

50. Albany County, New York
> Adults under 65, no health insurance: 3.7%
> Adults under 65, Medicare coverage (or multiple types): 3.1% — 1,049th lowest of 2,946 counties
> Adults under 65, Medicaid coverage (or multiple types): 20.4% — 1,199th lowest of 2,946 counties
> Adults under 65, VA coverage (or multiple types): 1.1% — 1,001st lowest of 2,946 counties
> Adults under 65, employer-based insurance (or multiple types): 70.1% — 246th highest of 2,946 counties
> Adults under 65, direct-purchase insurance (or multiple types): 9.7% — 1,362nd lowest of 2,946 counties
> Adults under 65, Tricare/military insurance (or many types): 0.8% — 576th lowest of 2,946 counties
[in-text-ad]

Source: Calvin Beale, Public domain, via Wikimedia Commons
49. Cortland County, New York
> Adults under 65, no health insurance: 3.7%
> Adults under 65, Medicare coverage (or multiple types): 3.1% — 1,090th lowest of 2,946 counties
> Adults under 65, Medicaid coverage (or multiple types): 21.6% — 1,372nd lowest of 2,946 counties
> Adults under 65, VA coverage (or multiple types): 1.1% — 1,003rd lowest of 2,946 counties
> Adults under 65, employer-based insurance (or multiple types): 69.6% — 275th highest of 2,946 counties
> Adults under 65, direct-purchase insurance (or multiple types): 8.8% — 945th lowest of 2,946 counties
> Adults under 65, Tricare/military insurance (or many types): 0.7% — 374th lowest of 2,946 counties

Source: I, Cburnett, CC BY-SA 3.0 , via Wikimedia Commons
48. Jasper County, Iowa
> Adults under 65, no health insurance: 3.6%
> Adults under 65, Medicare coverage (or multiple types): 3.5% — 1,352nd lowest of 2,946 counties
> Adults under 65, Medicaid coverage (or multiple types): 22.7% — 1,423rd highest of 2,946 counties
> Adults under 65, VA coverage (or multiple types): 1.0% — 828th lowest of 2,946 counties
> Adults under 65, employer-based insurance (or multiple types): 68.5% — 343rd highest of 2,946 counties
> Adults under 65, direct-purchase insurance (or multiple types): 10.7% — 1,150th highest of 2,946 counties
> Adults under 65, Tricare/military insurance (or many types): 1.1% — 966th lowest of 2,946 counties

Source: Kevin Schuchmann, CC BY-SA 3.0 , via Wikimedia Commons
47. Delaware County, Iowa
> Adults under 65, no health insurance: 3.6%
> Adults under 65, Medicare coverage (or multiple types): 2.2% — 435th lowest of 2,946 counties
> Adults under 65, Medicaid coverage (or multiple types): 15.0% — 533rd lowest of 2,946 counties
> Adults under 65, VA coverage (or multiple types): 0.4% — 88th lowest of 2,946 counties
> Adults under 65, employer-based insurance (or multiple types): 68.2% — 368th highest of 2,946 counties
> Adults under 65, direct-purchase insurance (or multiple types): 17.2% — 193rd highest of 2,946 counties
> Adults under 65, Tricare/military insurance (or many types): 0.5% — 201st lowest of 2,946 counties
[in-text-ad-2]

Source: kenlund / Flickr
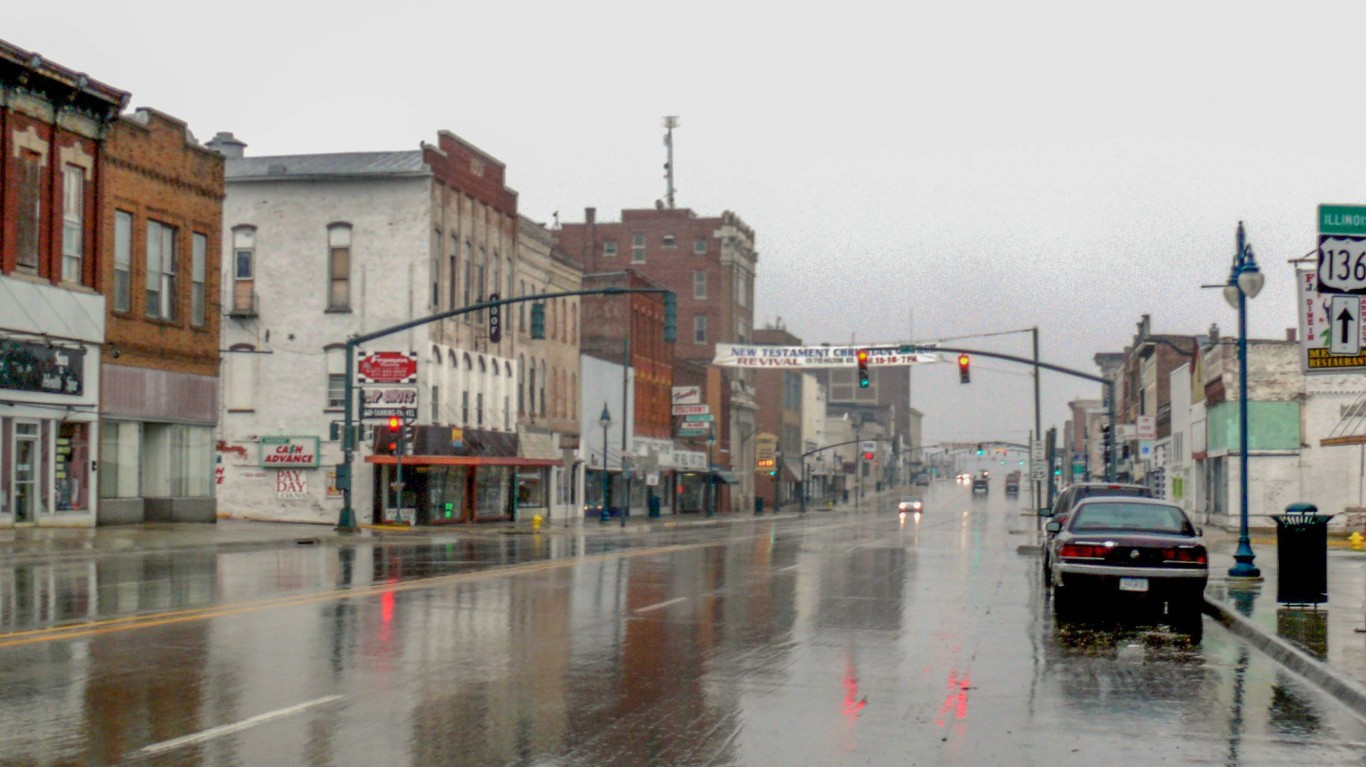
46. Mercer County, Illinois
> Adults under 65, no health insurance: 3.6%
> Adults under 65, Medicare coverage (or multiple types): 2.3% — 499th lowest of 2,946 counties
> Adults under 65, Medicaid coverage (or multiple types): 16.5% — 688th lowest of 2,946 counties
> Adults under 65, VA coverage (or multiple types): 0.6% — 283rd lowest of 2,946 counties
> Adults under 65, employer-based insurance (or multiple types): 71.7% — 166th highest of 2,946 counties
> Adults under 65, direct-purchase insurance (or multiple types): 9.2% — 1,139th lowest of 2,946 counties
> Adults under 65, Tricare/military insurance (or many types): 0.7% — 468th lowest of 2,946 counties

Source: governortomwolf / Flickr
45. Elk County, Pennsylvania
> Adults under 65, no health insurance: 3.6%
> Adults under 65, Medicare coverage (or multiple types): 4.5% — 1,034th highest of 2,946 counties
> Adults under 65, Medicaid coverage (or multiple types): 21.8% — 1,411th lowest of 2,946 counties
> Adults under 65, VA coverage (or multiple types): 1.4% — 1,323rd highest of 2,946 counties
> Adults under 65, employer-based insurance (or multiple types): 71.7% — 164th highest of 2,946 counties
> Adults under 65, direct-purchase insurance (or multiple types): 10.5% — 1,253rd highest of 2,946 counties
> Adults under 65, Tricare/military insurance (or many types): 0.6% — 349th lowest of 2,946 counties
[in-text-ad]

Source: DenisTangneyJr / E+ via Getty Images
44. Essex County, Massachusetts
> Adults under 65, no health insurance: 3.6%
> Adults under 65, Medicare coverage (or multiple types): 2.7% — 770th lowest of 2,946 counties
> Adults under 65, Medicaid coverage (or multiple types): 27.6% — 814th highest of 2,946 counties
> Adults under 65, VA coverage (or multiple types): 0.5% — 184th lowest of 2,946 counties
> Adults under 65, employer-based insurance (or multiple types): 63.6% — 722nd highest of 2,946 counties
> Adults under 65, direct-purchase insurance (or multiple types): 10.4% — 1,309th highest of 2,946 counties
> Adults under 65, Tricare/military insurance (or many types): 0.5% — 271st lowest of 2,946 counties

Source: BOB WESTON / iStock via Getty Images
43. Hancock County, Kentucky
> Adults under 65, no health insurance: 3.5%
> Adults under 65, Medicare coverage (or multiple types): 4.2% — 1,158th highest of 2,946 counties
> Adults under 65, Medicaid coverage (or multiple types): 26.5% — 945th highest of 2,946 counties
> Adults under 65, VA coverage (or multiple types): 0.5% — 125th lowest of 2,946 counties
> Adults under 65, employer-based insurance (or multiple types): 65.3% — 569th highest of 2,946 counties
> Adults under 65, direct-purchase insurance (or multiple types): 6.8% — 268th lowest of 2,946 counties
> Adults under 65, Tricare/military insurance (or many types): 2.2% — 740th highest of 2,946 counties

Source: hstiver / Getty Images
42. Chittenden County, Vermont
> Adults under 65, no health insurance: 3.5%
> Adults under 65, Medicare coverage (or multiple types): 2.5% — 625th lowest of 2,946 counties
> Adults under 65, Medicaid coverage (or multiple types): 18.3% — 923rd lowest of 2,946 counties
> Adults under 65, VA coverage (or multiple types): 0.8% — 459th lowest of 2,946 counties
> Adults under 65, employer-based insurance (or multiple types): 70.2% — 235th highest of 2,946 counties
> Adults under 65, direct-purchase insurance (or multiple types): 10.4% — 1,261st highest of 2,946 counties
> Adults under 65, Tricare/military insurance (or many types): 1.7% — 1,224th highest of 2,946 counties
[in-text-ad-2]
Source: davidwilson1949 / Flickr
41. Keokuk County, Iowa
> Adults under 65, no health insurance: 3.5%
> Adults under 65, Medicare coverage (or multiple types): 3.2% — 1,119th lowest of 2,946 counties
> Adults under 65, Medicaid coverage (or multiple types): 26.3% — 971st highest of 2,946 counties
> Adults under 65, VA coverage (or multiple types): 2.2% — 409th highest of 2,946 counties
> Adults under 65, employer-based insurance (or multiple types): 58.9% — 1,179th highest of 2,946 counties
> Adults under 65, direct-purchase insurance (or multiple types): 14.4% — 396th highest of 2,946 counties
> Adults under 65, Tricare/military insurance (or many types): 1.1% — 1,027th lowest of 2,946 counties

Source: Nyttend / Public Domain / Wikimedia Commons
40. Putnam County, Ohio
> Adults under 65, no health insurance: 3.5%
> Adults under 65, Medicare coverage (or multiple types): 1.9% — 286th lowest of 2,946 counties
> Adults under 65, Medicaid coverage (or multiple types): 11.1% — 181st lowest of 2,946 counties
> Adults under 65, VA coverage (or multiple types): 0.5% — 150th lowest of 2,946 counties
> Adults under 65, employer-based insurance (or multiple types): 80.4% — 11th highest of 2,946 counties
> Adults under 65, direct-purchase insurance (or multiple types): 8.6% — 872nd lowest of 2,946 counties
> Adults under 65, Tricare/military insurance (or many types): 0.5% — 247th lowest of 2,946 counties
[in-text-ad]

Source: Stephen Matthew Milligan / Wikimedia Commons
39. Dallas County, Iowa
> Adults under 65, no health insurance: 3.4%
> Adults under 65, Medicare coverage (or multiple types): 1.4% — 106th lowest of 2,946 counties
> Adults under 65, Medicaid coverage (or multiple types): 11.5% — 214th lowest of 2,946 counties
> Adults under 65, VA coverage (or multiple types): 1.0% — 814th lowest of 2,946 counties
> Adults under 65, employer-based insurance (or multiple types): 79.3% — 19th highest of 2,946 counties
> Adults under 65, direct-purchase insurance (or multiple types): 9.4% — 1,231st lowest of 2,946 counties
> Adults under 65, Tricare/military insurance (or many types): 1.3% — 1,346th lowest of 2,946 counties
 24/7 Wall St.
38. Washington County, Minnesota
> Adults under 65, no health insurance: 3.4%
> Adults under 65, Medicare coverage (or multiple types): 1.5% — 127th lowest of 2,946 counties
> Adults under 65, Medicaid coverage (or multiple types): 11.5% — 211th lowest of 2,946 counties
> Adults under 65, VA coverage (or multiple types): 0.8% — 471st lowest of 2,946 counties
> Adults under 65, employer-based insurance (or multiple types): 78.4% — 24th highest of 2,946 counties
> Adults under 65, direct-purchase insurance (or multiple types): 9.3% — 1,199th lowest of 2,946 counties
> Adults under 65, Tricare/military insurance (or many types): 1.2% — 1,178th lowest of 2,946 counties

Source: Farragutful, CC BY-SA 4.0 , via Wikimedia Commons
37. Carroll County, Maryland
> Adults under 65, no health insurance: 3.4%
> Adults under 65, Medicare coverage (or multiple types): 2.2% — 409th lowest of 2,946 counties
> Adults under 65, Medicaid coverage (or multiple types): 12.5% — 287th lowest of 2,946 counties
> Adults under 65, VA coverage (or multiple types): 0.9% — 721st lowest of 2,946 counties
> Adults under 65, employer-based insurance (or multiple types): 76.3% — 45th highest of 2,946 counties
> Adults under 65, direct-purchase insurance (or multiple types): 9.7% — 1,352nd lowest of 2,946 counties
> Adults under 65, Tricare/military insurance (or many types): 2.3% — 669th highest of 2,946 counties
[in-text-ad-2]

36. Boone County, Iowa
> Adults under 65, no health insurance: 3.4%
> Adults under 65, Medicare coverage (or multiple types): 2.2% — 407th lowest of 2,946 counties
> Adults under 65, Medicaid coverage (or multiple types): 20.6% — 1,223rd lowest of 2,946 counties
> Adults under 65, VA coverage (or multiple types): 1.9% — 648th highest of 2,946 counties
> Adults under 65, employer-based insurance (or multiple types): 68.5% — 340th highest of 2,946 counties
> Adults under 65, direct-purchase insurance (or multiple types): 11.8% — 817th highest of 2,946 counties
> Adults under 65, Tricare/military insurance (or many types): 2.3% — 686th highest of 2,946 counties

Source: n8nhale / Flickr
35. Ozaukee County, Wisconsin
> Adults under 65, no health insurance: 3.4%
> Adults under 65, Medicare coverage (or multiple types): 1.7% — 186th lowest of 2,946 counties
> Adults under 65, Medicaid coverage (or multiple types): 8.2% — 51st lowest of 2,946 counties
> Adults under 65, VA coverage (or multiple types): 0.7% — 406th lowest of 2,946 counties
> Adults under 65, employer-based insurance (or multiple types): 79.7% — 15th highest of 2,946 counties
> Adults under 65, direct-purchase insurance (or multiple types): 10.9% — 1,108th highest of 2,946 counties
> Adults under 65, Tricare/military insurance (or many types): 1.3% — 1,260th lowest of 2,946 counties
[in-text-ad]

Source: BOB WESTON / iStock via Getty Images
34. Lee County, Kentucky
> Adults under 65, no health insurance: 3.4%
> Adults under 65, Medicare coverage (or multiple types): 7.2% — 202nd highest of 2,946 counties
> Adults under 65, Medicaid coverage (or multiple types): 50.0% — 19th highest of 2,946 counties
> Adults under 65, VA coverage (or multiple types): 0.1% — 15th lowest of 2,946 counties
> Adults under 65, employer-based insurance (or multiple types): 40.0% — 226th lowest of 2,946 counties
> Adults under 65, direct-purchase insurance (or multiple types): 3.9% — 28th lowest of 2,946 counties
> Adults under 65, Tricare/military insurance (or many types): 1.7% — 1,157th highest of 2,946 counties

Source: Nyttend, Public domain, via Wikimedia Commons
33. Putnam County, Illinois
> Adults under 65, no health insurance: 3.3%
> Adults under 65, Medicare coverage (or multiple types): 2.8% — 826th lowest of 2,946 counties
> Adults under 65, Medicaid coverage (or multiple types): 22.6% — 1,445th highest of 2,946 counties
> Adults under 65, VA coverage (or multiple types): 0.9% — 661st lowest of 2,946 counties
> Adults under 65, employer-based insurance (or multiple types): 69.9% — 255th highest of 2,946 counties
> Adults under 65, direct-purchase insurance (or multiple types): 8.4% — 808th lowest of 2,946 counties
> Adults under 65, Tricare/military insurance (or many types): 0.5% — 231st lowest of 2,946 counties

32. Scott County, Illinois
> Adults under 65, no health insurance: 3.3%
> Adults under 65, Medicare coverage (or multiple types): 3.1% — 1,103rd lowest of 2,946 counties
> Adults under 65, Medicaid coverage (or multiple types): 27.3% — 842nd highest of 2,946 counties
> Adults under 65, VA coverage (or multiple types): 1.0% — 777th lowest of 2,946 counties
> Adults under 65, employer-based insurance (or multiple types): 65.5% — 546th highest of 2,946 counties
> Adults under 65, direct-purchase insurance (or multiple types): 6.0% — 153rd lowest of 2,946 counties
> Adults under 65, Tricare/military insurance (or many types): 0.5% — 254th lowest of 2,946 counties
[in-text-ad-2]

Source: Bobak Ha'Eri / Wikimedia Commons
31. Carver County, Minnesota
> Adults under 65, no health insurance: 3.3%
> Adults under 65, Medicare coverage (or multiple types): 1.1% — 48th lowest of 2,946 counties
> Adults under 65, Medicaid coverage (or multiple types): 9.2% — 82nd lowest of 2,946 counties
> Adults under 65, VA coverage (or multiple types): 0.7% — 382nd lowest of 2,946 counties
> Adults under 65, employer-based insurance (or multiple types): 82.2% — 2nd highest of 2,946 counties
> Adults under 65, direct-purchase insurance (or multiple types): 8.8% — 957th lowest of 2,946 counties
> Adults under 65, Tricare/military insurance (or many types): 0.4% — 170th lowest of 2,946 counties

30. Lac qui Parle County, Minnesota
> Adults under 65, no health insurance: 3.3%
> Adults under 65, Medicare coverage (or multiple types): 2.8% — 794th lowest of 2,946 counties
> Adults under 65, Medicaid coverage (or multiple types): 23.0% — 1,381st highest of 2,946 counties
> Adults under 65, VA coverage (or multiple types): 1.7% — 899th highest of 2,946 counties
> Adults under 65, employer-based insurance (or multiple types): 56.5% — 1,423rd highest of 2,946 counties
> Adults under 65, direct-purchase insurance (or multiple types): 20.7% — 79th highest of 2,946 counties
> Adults under 65, Tricare/military insurance (or many types): 1.3% — 1,323rd lowest of 2,946 counties
[in-text-ad]

Source: DenisTangneyJr / Getty Images
29. Bristol County, Massachusetts
> Adults under 65, no health insurance: 3.3%
> Adults under 65, Medicare coverage (or multiple types): 3.4% — 1,281st lowest of 2,946 counties
> Adults under 65, Medicaid coverage (or multiple types): 29.7% — 601st highest of 2,946 counties
> Adults under 65, VA coverage (or multiple types): 0.9% — 635th lowest of 2,946 counties
> Adults under 65, employer-based insurance (or multiple types): 63.6% — 724th highest of 2,946 counties
> Adults under 65, direct-purchase insurance (or multiple types): 8.4% — 782nd lowest of 2,946 counties
> Adults under 65, Tricare/military insurance (or many types): 0.9% — 683rd lowest of 2,946 counties
 24/7 Wall St.
Source: DenisTangneyJr / iStock via Getty Images
28. Waukesha County, Wisconsin
> Adults under 65, no health insurance: 3.3%
> Adults under 65, Medicare coverage (or multiple types): 1.8% — 230th lowest of 2,946 counties
> Adults under 65, Medicaid coverage (or multiple types): 8.7% — 65th lowest of 2,946 counties
> Adults under 65, VA coverage (or multiple types): 0.8% — 434th lowest of 2,946 counties
> Adults under 65, employer-based insurance (or multiple types): 81.4% — 5th highest of 2,946 counties
> Adults under 65, direct-purchase insurance (or multiple types): 9.3% — 1,210th lowest of 2,946 counties
> Adults under 65, Tricare/military insurance (or many types): 0.8% — 593rd lowest of 2,946 counties

Source: kapstun / Getty Images
27. Washington County, Rhode Island
> Adults under 65, no health insurance: 3.2%
> Adults under 65, Medicare coverage (or multiple types): 2.1% — 352nd lowest of 2,946 counties
> Adults under 65, Medicaid coverage (or multiple types): 13.1% — 331st lowest of 2,946 counties
> Adults under 65, VA coverage (or multiple types): 1.3% — 1,369th lowest of 2,946 counties
> Adults under 65, employer-based insurance (or multiple types): 72.0% — 155th highest of 2,946 counties
> Adults under 65, direct-purchase insurance (or multiple types): 13.8% — 468th highest of 2,946 counties
> Adults under 65, Tricare/military insurance (or many types): 2.4% — 627th highest of 2,946 counties
[in-text-ad-2]

Source: Matt Turner, CC BY 2.0 , via Wikimedia Commons
26. Menard County, Illinois
> Adults under 65, no health insurance: 3.2%
> Adults under 65, Medicare coverage (or multiple types): 3.1% — 1,047th lowest of 2,946 counties
> Adults under 65, Medicaid coverage (or multiple types): 18.9% — 1,014th lowest of 2,946 counties
> Adults under 65, VA coverage (or multiple types): 0.8% — 496th lowest of 2,946 counties
> Adults under 65, employer-based insurance (or multiple types): 72.4% — 143rd highest of 2,946 counties
> Adults under 65, direct-purchase insurance (or multiple types): 8.1% — 649th lowest of 2,946 counties
> Adults under 65, Tricare/military insurance (or many types): 2.2% — 763rd highest of 2,946 counties

Source: Scott Romine / Wikimedia Commons
25. Bremer County, Iowa
> Adults under 65, no health insurance: 3.2%
> Adults under 65, Medicare coverage (or multiple types): 1.1% — 60th lowest of 2,946 counties
> Adults under 65, Medicaid coverage (or multiple types): 13.4% — 364th lowest of 2,946 counties
> Adults under 65, VA coverage (or multiple types): 0.8% — 536th lowest of 2,946 counties
> Adults under 65, employer-based insurance (or multiple types): 75.5% — 67th highest of 2,946 counties
> Adults under 65, direct-purchase insurance (or multiple types): 12.0% — 764th highest of 2,946 counties
> Adults under 65, Tricare/military insurance (or many types): 1.3% — 1,311th lowest of 2,946 counties
[in-text-ad]

Source: KenWiedemann / Getty Images
24. Hunterdon County, New Jersey
> Adults under 65, no health insurance: 3.2%
> Adults under 65, Medicare coverage (or multiple types): 1.4% — 116th lowest of 2,946 counties
> Adults under 65, Medicaid coverage (or multiple types): 8.0% — 44th lowest of 2,946 counties
> Adults under 65, VA coverage (or multiple types): 0.5% — 154th lowest of 2,946 counties
> Adults under 65, employer-based insurance (or multiple types): 82.0% — 4th highest of 2,946 counties
> Adults under 65, direct-purchase insurance (or multiple types): 9.1% — 1,121st lowest of 2,946 counties
> Adults under 65, Tricare/military insurance (or many types): 0.4% — 188th lowest of 2,946 counties
 24/7 Wall St.
Source: Dan Breyfogle, CC BY-SA 3.0 , via Wikimedia Commons
23. Greene County, Iowa
> Adults under 65, no health insurance: 3.1%
> Adults under 65, Medicare coverage (or multiple types): 2.4% — 529th lowest of 2,946 counties
> Adults under 65, Medicaid coverage (or multiple types): 22.2% — 1,459th lowest of 2,946 counties
> Adults under 65, VA coverage (or multiple types): 1.2% — 1,298th lowest of 2,946 counties
> Adults under 65, employer-based insurance (or multiple types): 65.8% — 534th highest of 2,946 counties
> Adults under 65, direct-purchase insurance (or multiple types): 13.2% — 545th highest of 2,946 counties
> Adults under 65, Tricare/military insurance (or many types): 1.9% — 976th highest of 2,946 counties

Source: David Anderson, Public domain, via Wikimedia Commons
22. Warren County, Iowa
> Adults under 65, no health insurance: 3.1%
> Adults under 65, Medicare coverage (or multiple types): 1.9% — 262nd lowest of 2,946 counties
> Adults under 65, Medicaid coverage (or multiple types): 15.6% — 590th lowest of 2,946 counties
> Adults under 65, VA coverage (or multiple types): 1.4% — 1,437th highest of 2,946 counties
> Adults under 65, employer-based insurance (or multiple types): 76.2% — 48th highest of 2,946 counties
> Adults under 65, direct-purchase insurance (or multiple types): 8.6% — 860th lowest of 2,946 counties
> Adults under 65, Tricare/military insurance (or many types): 2.8% — 453rd highest of 2,946 counties
[in-text-ad-2]

Source: RandyStephensPhotography / iStock
21. Douglas County, Colorado
> Adults under 65, no health insurance: 3.1%
> Adults under 65, Medicare coverage (or multiple types): 0.9% — 30th lowest of 2,946 counties
> Adults under 65, Medicaid coverage (or multiple types): 6.9% — 24th lowest of 2,946 counties
> Adults under 65, VA coverage (or multiple types): 1.0% — 738th lowest of 2,946 counties
> Adults under 65, employer-based insurance (or multiple types): 80.6% — 9th highest of 2,946 counties
> Adults under 65, direct-purchase insurance (or multiple types): 11.5% — 889th highest of 2,946 counties
> Adults under 65, Tricare/military insurance (or many types): 2.1% — 832nd highest of 2,946 counties

Source: BOB WESTON / iStock via Getty Images
20. Monroe County, Illinois
> Adults under 65, no health insurance: 3.1%
> Adults under 65, Medicare coverage (or multiple types): 2.3% — 486th lowest of 2,946 counties
> Adults under 65, Medicaid coverage (or multiple types): 8.1% — 49th lowest of 2,946 counties
> Adults under 65, VA coverage (or multiple types): 0.9% — 652nd lowest of 2,946 counties
> Adults under 65, employer-based insurance (or multiple types): 82.0% — 3rd highest of 2,946 counties
> Adults under 65, direct-purchase insurance (or multiple types): 8.6% — 873rd lowest of 2,946 counties
> Adults under 65, Tricare/military insurance (or many types): 1.0% — 887th lowest of 2,946 counties
[in-text-ad]

Source: Jerry Dougherty / Wikimedia Commons
19. Tolland County, Connecticut
> Adults under 65, no health insurance: 3.0%
> Adults under 65, Medicare coverage (or multiple types): 2.3% — 476th lowest of 2,946 counties
> Adults under 65, Medicaid coverage (or multiple types): 13.0% — 317th lowest of 2,946 counties
> Adults under 65, VA coverage (or multiple types): 0.7% — 400th lowest of 2,946 counties
> Adults under 65, employer-based insurance (or multiple types): 77.3% — 28th highest of 2,946 counties
> Adults under 65, direct-purchase insurance (or multiple types): 9.3% — 1,196th lowest of 2,946 counties
> Adults under 65, Tricare/military insurance (or many types): 1.2% — 1,150th lowest of 2,946 counties
 24/7 Wall St.
18. Pennington County, Minnesota
> Adults under 65, no health insurance: 3.0%
> Adults under 65, Medicare coverage (or multiple types): 3.0% — 971st lowest of 2,946 counties
> Adults under 65, Medicaid coverage (or multiple types): 20.7% — 1,234th lowest of 2,946 counties
> Adults under 65, VA coverage (or multiple types): 1.2% — 1,254th lowest of 2,946 counties
> Adults under 65, employer-based insurance (or multiple types): 73.0% — 124th highest of 2,946 counties
> Adults under 65, direct-purchase insurance (or multiple types): 8.6% — 856th lowest of 2,946 counties
> Adults under 65, Tricare/military insurance (or many types): 0.6% — 287th lowest of 2,946 counties

17. Sherburne County, Minnesota
> Adults under 65, no health insurance: 3.0%
> Adults under 65, Medicare coverage (or multiple types): 1.6% — 157th lowest of 2,946 counties
> Adults under 65, Medicaid coverage (or multiple types): 13.4% — 367th lowest of 2,946 counties
> Adults under 65, VA coverage (or multiple types): 1.5% — 1,173rd highest of 2,946 counties
> Adults under 65, employer-based insurance (or multiple types): 76.0% — 52nd highest of 2,946 counties
> Adults under 65, direct-purchase insurance (or multiple types): 9.7% — 1,344th lowest of 2,946 counties
> Adults under 65, Tricare/military insurance (or many types): 1.5% — 1,428th highest of 2,946 counties
[in-text-ad-2]

Source: SeanPavonePhoto / iStock via Getty Images
16. Worcester County, Massachusetts
> Adults under 65, no health insurance: 2.9%
> Adults under 65, Medicare coverage (or multiple types): 2.7% — 777th lowest of 2,946 counties
> Adults under 65, Medicaid coverage (or multiple types): 25.3% — 1,087th highest of 2,946 counties
> Adults under 65, VA coverage (or multiple types): 0.8% — 525th lowest of 2,946 counties
> Adults under 65, employer-based insurance (or multiple types): 67.2% — 430th highest of 2,946 counties
> Adults under 65, direct-purchase insurance (or multiple types): 8.6% — 878th lowest of 2,946 counties
> Adults under 65, Tricare/military insurance (or many types): 0.8% — 613th lowest of 2,946 counties

Source: BOB WESTON / iStock via Getty Images
15. Pendleton County, Kentucky
> Adults under 65, no health insurance: 2.9%
> Adults under 65, Medicare coverage (or multiple types): 9.3% — 48th highest of 2,946 counties
> Adults under 65, Medicaid coverage (or multiple types): 28.8% — 691st highest of 2,946 counties
> Adults under 65, VA coverage (or multiple types): 0.5% — 176th lowest of 2,946 counties
> Adults under 65, employer-based insurance (or multiple types): 58.8% — 1,198th highest of 2,946 counties
> Adults under 65, direct-purchase insurance (or multiple types): 7.9% — 565th lowest of 2,946 counties
> Adults under 65, Tricare/military insurance (or many types): 1.0% — 790th lowest of 2,946 counties
[in-text-ad]

Source: Courtesy of Chuckmor via Wikimedia Commons
14. Winnebago County, Iowa
> Adults under 65, no health insurance: 2.9%
> Adults under 65, Medicare coverage (or multiple types): 2.6% — 679th lowest of 2,946 counties
> Adults under 65, Medicaid coverage (or multiple types): 19.1% — 1,035th lowest of 2,946 counties
> Adults under 65, VA coverage (or multiple types): 1.7% — 938th highest of 2,946 counties
> Adults under 65, employer-based insurance (or multiple types): 68.6% — 331st highest of 2,946 counties
> Adults under 65, direct-purchase insurance (or multiple types): 13.6% — 491st highest of 2,946 counties
> Adults under 65, Tricare/military insurance (or many types): 1.8% — 1,076th highest of 2,946 counties

Source: stresstensor / Getty Images
13. Middlesex County, Massachusetts
> Adults under 65, no health insurance: 2.8%
> Adults under 65, Medicare coverage (or multiple types): 1.9% — 253rd lowest of 2,946 counties
> Adults under 65, Medicaid coverage (or multiple types): 16.7% — 717th lowest of 2,946 counties
> Adults under 65, VA coverage (or multiple types): 0.4% — 107th lowest of 2,946 counties
> Adults under 65, employer-based insurance (or multiple types): 74.0% — 94th highest of 2,946 counties
> Adults under 65, direct-purchase insurance (or multiple types): 10.5% — 1,259th highest of 2,946 counties
> Adults under 65, Tricare/military insurance (or many types): 0.7% — 458th lowest of 2,946 counties

Source: BOB WESTON / iStock via Getty Images
12. Wilkin County, Minnesota
> Adults under 65, no health insurance: 2.8%
> Adults under 65, Medicare coverage (or multiple types): 3.4% — 1,265th lowest of 2,946 counties
> Adults under 65, Medicaid coverage (or multiple types): 18.4% — 941st lowest of 2,946 counties
> Adults under 65, VA coverage (or multiple types): 1.4% — 1,334th highest of 2,946 counties
> Adults under 65, employer-based insurance (or multiple types): 68.0% — 383rd highest of 2,946 counties
> Adults under 65, direct-purchase insurance (or multiple types): 15.6% — 302nd highest of 2,946 counties
> Adults under 65, Tricare/military insurance (or many types): 0.7% — 492nd lowest of 2,946 counties
[in-text-ad-2]

11. Benton County, Iowa
> Adults under 65, no health insurance: 2.7%
> Adults under 65, Medicare coverage (or multiple types): 3.1% — 1,048th lowest of 2,946 counties
> Adults under 65, Medicaid coverage (or multiple types): 18.1% — 900th lowest of 2,946 counties
> Adults under 65, VA coverage (or multiple types): 0.9% — 572nd lowest of 2,946 counties
> Adults under 65, employer-based insurance (or multiple types): 73.8% — 100th highest of 2,946 counties
> Adults under 65, direct-purchase insurance (or multiple types): 10.5% — 1,244th highest of 2,946 counties
> Adults under 65, Tricare/military insurance (or many types): 0.6% — 364th lowest of 2,946 counties

Source: DenisTangneyJr / iStock via Getty Images
10. Bristol County, Rhode Island
> Adults under 65, no health insurance: 2.7%
> Adults under 65, Medicare coverage (or multiple types): 2.1% — 382nd lowest of 2,946 counties
> Adults under 65, Medicaid coverage (or multiple types): 15.2% — 561st lowest of 2,946 counties
> Adults under 65, VA coverage (or multiple types): 0.8% — 450th lowest of 2,946 counties
> Adults under 65, employer-based insurance (or multiple types): 71.6% — 176th highest of 2,946 counties
> Adults under 65, direct-purchase insurance (or multiple types): 15.2% — 320th highest of 2,946 counties
> Adults under 65, Tricare/military insurance (or many types): 0.9% — 765th lowest of 2,946 counties
[in-text-ad]

Source: harmantasdc / iStock Editorial via Getty Images
9. Cedar County, Iowa
> Adults under 65, no health insurance: 2.6%
> Adults under 65, Medicare coverage (or multiple types): 2.4% — 520th lowest of 2,946 counties
> Adults under 65, Medicaid coverage (or multiple types): 14.9% — 521st lowest of 2,946 counties
> Adults under 65, VA coverage (or multiple types): 1.7% — 884th highest of 2,946 counties
> Adults under 65, employer-based insurance (or multiple types): 75.6% — 65th highest of 2,946 counties
> Adults under 65, direct-purchase insurance (or multiple types): 10.6% — 1,210th highest of 2,946 counties
> Adults under 65, Tricare/military insurance (or many types): 1.4% — 1,363rd lowest of 2,946 counties
 24/7 Wall St.
Source: pabradyphoto / iStock via Getty Images
8. Plymouth County, Massachusetts
> Adults under 65, no health insurance: 2.6%
> Adults under 65, Medicare coverage (or multiple types): 2.3% — 508th lowest of 2,946 counties
> Adults under 65, Medicaid coverage (or multiple types): 21.8% — 1,407th lowest of 2,946 counties
> Adults under 65, VA coverage (or multiple types): 0.8% — 467th lowest of 2,946 counties
> Adults under 65, employer-based insurance (or multiple types): 71.6% — 174th highest of 2,946 counties
> Adults under 65, direct-purchase insurance (or multiple types): 8.4% — 789th lowest of 2,946 counties
> Adults under 65, Tricare/military insurance (or many types): 0.9% — 746th lowest of 2,946 counties

Source: Douglas Rissing / iStock via Getty Images
7. Hampshire County, Massachusetts
> Adults under 65, no health insurance: 2.6%
> Adults under 65, Medicare coverage (or multiple types): 2.5% — 601st lowest of 2,946 counties
> Adults under 65, Medicaid coverage (or multiple types): 18.6% — 975th lowest of 2,946 counties
> Adults under 65, VA coverage (or multiple types): 0.8% — 498th lowest of 2,946 counties
> Adults under 65, employer-based insurance (or multiple types): 71.1% — 203rd highest of 2,946 counties
> Adults under 65, direct-purchase insurance (or multiple types): 12.0% — 744th highest of 2,946 counties
> Adults under 65, Tricare/military insurance (or many types): 1.0% — 816th lowest of 2,946 counties
[in-text-ad-2]

Source: Nic McPhee / Wikimedia Commons
6. Stevens County, Minnesota
> Adults under 65, no health insurance: 2.6%
> Adults under 65, Medicare coverage (or multiple types): 2.0% — 333rd lowest of 2,946 counties
> Adults under 65, Medicaid coverage (or multiple types): 15.0% — 537th lowest of 2,946 counties
> Adults under 65, VA coverage (or multiple types): 0.7% — 310th lowest of 2,946 counties
> Adults under 65, employer-based insurance (or multiple types): 71.4% — 187th highest of 2,946 counties
> Adults under 65, direct-purchase insurance (or multiple types): 14.2% — 417th highest of 2,946 counties
> Adults under 65, Tricare/military insurance (or many types): 1.0% — 924th lowest of 2,946 counties

Source: roadgeek / Flickr
5. Franklin County, Massachusetts
> Adults under 65, no health insurance: 2.6%
> Adults under 65, Medicare coverage (or multiple types): 5.1% — 736th highest of 2,946 counties
> Adults under 65, Medicaid coverage (or multiple types): 29.0% — 657th highest of 2,946 counties
> Adults under 65, VA coverage (or multiple types): 1.3% — 1,361st lowest of 2,946 counties
> Adults under 65, employer-based insurance (or multiple types): 64.1% — 669th highest of 2,946 counties
> Adults under 65, direct-purchase insurance (or multiple types): 10.2% — 1,387th highest of 2,946 counties
> Adults under 65, Tricare/military insurance (or many types): 1.0% — 828th lowest of 2,946 counties
[in-text-ad]

Source: Lolwhynot3498, CC BY-SA 4.0 , via Wikimedia Commons
4. Grundy County, Iowa
> Adults under 65, no health insurance: 2.4%
> Adults under 65, Medicare coverage (or multiple types): 2.1% — 338th lowest of 2,946 counties
> Adults under 65, Medicaid coverage (or multiple types): 13.6% — 385th lowest of 2,946 counties
> Adults under 65, VA coverage (or multiple types): 1.0% — 763rd lowest of 2,946 counties
> Adults under 65, employer-based insurance (or multiple types): 73.3% — 116th highest of 2,946 counties
> Adults under 65, direct-purchase insurance (or multiple types): 13.7% — 483rd highest of 2,946 counties
> Adults under 65, Tricare/military insurance (or many types): 0.8% — 563rd lowest of 2,946 counties

Source: Nst101, CC BY-SA 4.0 , via Wikimedia Commons
3. Carroll County, Iowa
> Adults under 65, no health insurance: 2.4%
> Adults under 65, Medicare coverage (or multiple types): 2.8% — 832nd lowest of 2,946 counties
> Adults under 65, Medicaid coverage (or multiple types): 18.7% — 984th lowest of 2,946 counties
> Adults under 65, VA coverage (or multiple types): 1.0% — 890th lowest of 2,946 counties
> Adults under 65, employer-based insurance (or multiple types): 66.4% — 482nd highest of 2,946 counties
> Adults under 65, direct-purchase insurance (or multiple types): 16.6% — 228th highest of 2,946 counties
> Adults under 65, Tricare/military insurance (or many types): 1.6% — 1,242nd highest of 2,946 counties
Source: roadgeek / Flickr
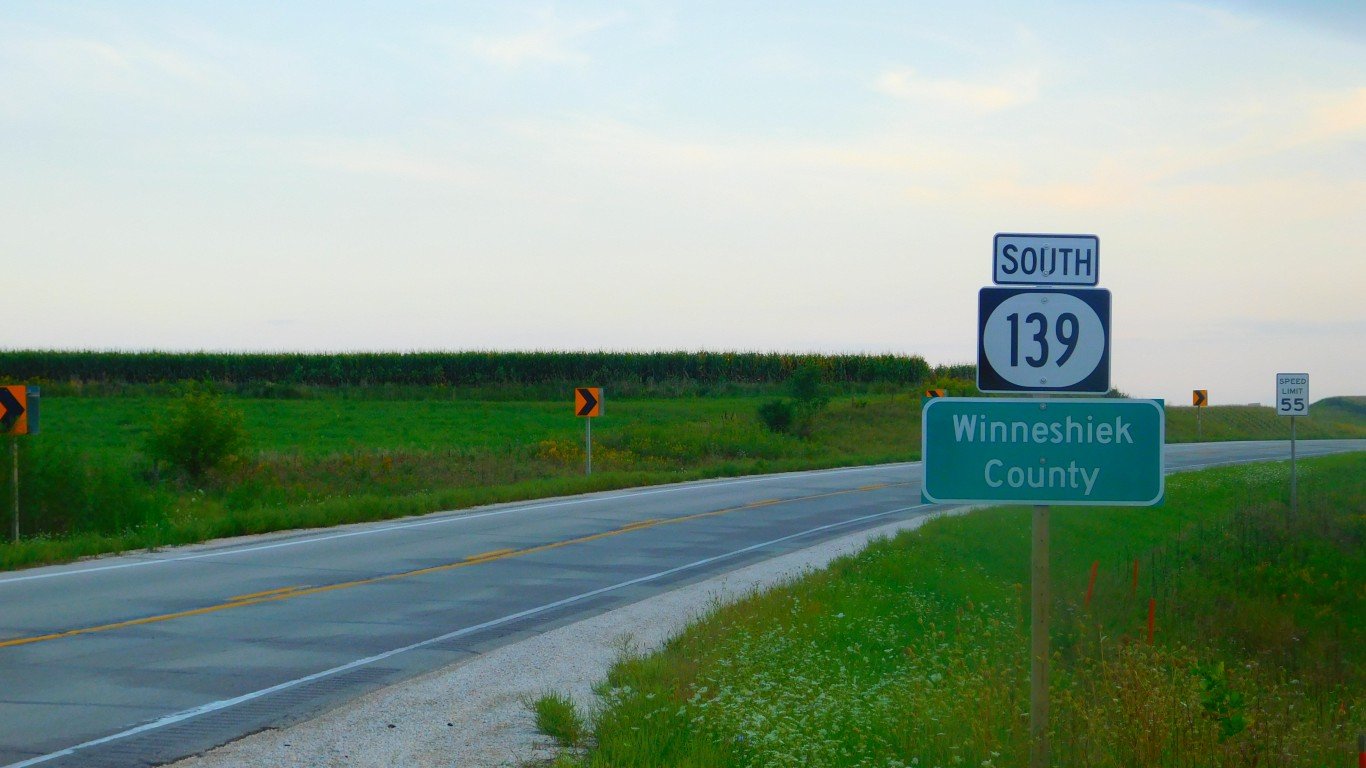
2. Winneshiek County, Iowa
> Adults under 65, no health insurance: 2.4%
> Adults under 65, Medicare coverage (or multiple types): 2.1% — 350th lowest of 2,946 counties
> Adults under 65, Medicaid coverage (or multiple types): 12.4% — 273rd lowest of 2,946 counties
> Adults under 65, VA coverage (or multiple types): 0.8% — 522nd lowest of 2,946 counties
> Adults under 65, employer-based insurance (or multiple types): 72.2% — 149th highest of 2,946 counties
> Adults under 65, direct-purchase insurance (or multiple types): 16.3% — 239th highest of 2,946 counties
> Adults under 65, Tricare/military insurance (or many types): 0.6% — 325th lowest of 2,946 counties
[in-text-ad-2]

Source: DenisTangneyJr / Getty Images
1. Norfolk County, Massachusetts
> Adults under 65, no health insurance: 2.1%
> Adults under 65, Medicare coverage (or multiple types): 1.8% — 215th lowest of 2,946 counties
> Adults under 65, Medicaid coverage (or multiple types): 14.6% — 493rd lowest of 2,946 counties
> Adults under 65, VA coverage (or multiple types): 0.5% — 166th lowest of 2,946 counties
> Adults under 65, employer-based insurance (or multiple types): 77.5% — 27th highest of 2,946 counties
> Adults under 65, direct-purchase insurance (or multiple types): 10.6% — 1,186th highest of 2,946 counties
> Adults under 65, Tricare/military insurance (or many types): 0.6% — 282nd lowest of 2,946 counties
Methodology:
To determine the counties with the best health insurance coverage in the nation, 24/7 Wall St. reviewed five-year estimates of the percentage of the noninstitutionalized civilian population under 65 without health insurance from the U.S. Census Bureau’s 2019 American Community Survey.
Of the 3,220 counties or county equivalents, 3,142 had boundaries that fell within one of the 50 states or the District of Columbia.
Counties were excluded if the noninstitutionalized civilian population under 65 was less than 1,000, or if the sampling error associated with a county’s data was deemed too high.
The sampling error was defined as too high if the coefficient of variation — a statistical assessment of how reliable an estimate is — for a county’s under 65 uninsured rate was above 15% and greater than two standard deviations above the mean CV for all counties’ under 65 uninsured rates. We similarly excluded counties that had a sampling error too high for their under 65 noninstitutionalized civilian population, using the same definition.
We selected the under 65 age group because Americans become eligible for Medicare at age 65, and the uninsured rate for the population above this age is less than 1% nationwide. However, because the census doesn’t publish insurance coverage estimates specifically for the under 65 age group, we aggregated the data from more granular age breakdowns.
To ensure each aggregate estimate’s sampling error could be assessed using the definition above, we derived a margin of error for each aggregate estimate using the successive differences replication variance estimation methodology recommended and used by the U.S. Census Bureau.
The remaining 2,946 places were ranked based on their under 65 uninsured rates. To break ties, we used the number of insured people in the same population group.
The shares of the population covered by each type of insurance — Medicare, Medicaid, VA, employer, direct-purchase, and Tricare/military — are for the same cohort and are also aggregated from five-year ACS estimates. The estimates reflect people who are covered by that type of insurance alone or in combination with other types on the list. So, when a person is covered by more than one type of insurance, they are included in each group.
Sponsored: Want to Retire Early? Here’s a Great First Step
Want retirement to come a few years earlier than you’d planned? Or are you ready to retire now, but want an extra set of eyes on your finances?
Now you can speak with up to 3 financial experts in your area for FREE. By simply clicking here you can begin to match with financial professionals who can help you build your plan to retire early. And the best part? The first conversation with them is free.
Click here to match with up to 3 financial pros who would be excited to help you make financial decisions.
Thank you for reading! Have some feedback for us?
Contact the 24/7 Wall St. editorial team.
Editors' Picks