
The U.S. has reported more than 35.6 million confirmed COVID-19 cases as of August 10. There have been more than 612,000 reported deaths from COVID-19-related causes — the highest death toll of any country.
The extent of the spread of the novel coronavirus continues to vary considerably from state to state, and from city to city. Even as the number of daily new cases is flattening or even declining in some parts of the country, it is surging at a growing rate in others.
Nationwide, the number of new cases is growing at an increasing rate. There were an average of 32.4 daily new coronavirus cases per 100,000 Americans in the week ending August 10, an increase from the week prior, when there were an average of 27.0 daily new coronavirus cases per 100,000 people.
Metropolitan areas with a high degree of mobility and a large population may be particularly vulnerable to outbreaks. While science and medical professionals are still studying how exactly the virus spreads, experts agree that outbreaks are more likely to occur in group settings where large numbers of people routinely have close contact with one another. Cities with high concentrations of dense spaces such as colleges, correctional facilities, and nursing homes are particularly at risk.
The city with the highest seven-day average of new daily COVID-19 cases per capita is in Louisiana. In the Houma-Thibodaux, LA, metro area, there were an average of 159.6 daily new coronavirus cases per 100,000 residents in the week ending August 10, the most of any U.S. metro area. Other cities where COVID-19 is growing the fastest include Hammond, LA; Mobile, AL; and Hattiesburg, MS.
To determine the metropolitan area in each state where COVID-19 is growing the fastest, 24/7 Wall St. compiled and reviewed data from state and local health departments. We ranked metropolitan areas according to the average number of new daily COVID-19 cases per 100,000 residents in the seven days ending August 10. Data was aggregated from the county level to the metropolitan area level using boundary definitions from the U.S. Census Bureau. Population data used to adjust case and death totals came from the U.S. Census Bureau’s 2019 American Community Survey and are five-year estimates. Unemployment data is from the Bureau of Labor Statistics and is seasonally adjusted.
Source: Sean Pavone / Getty Images
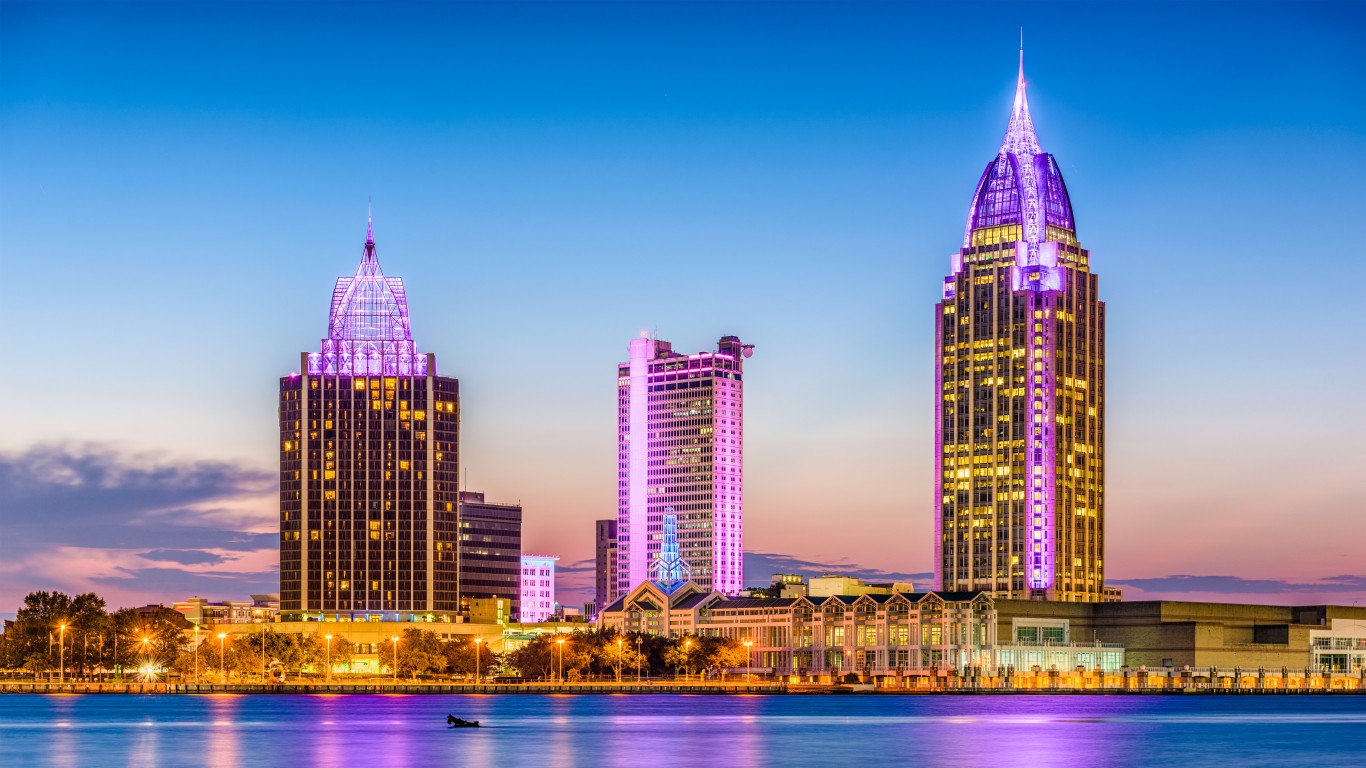
Alabama: Mobile
Avg. new daily cases in Mobile in week ending August 10: 120.5 per 100,000
Avg. new daily cases in Mobile in week ending August 3: 86.8 per 100,000
COVID-19 cases in Mobile as of August 10: 54,619 (12,682.8 per 100,000)
Peak pandemic unemployment in Mobile: 15.4% (April 2020)
Mobile population: 430,655 (186.5 people per sq. mi.)

Source: Chilkoot / Getty Images
Alaska: Anchorage
Avg. new daily cases in Anchorage in week ending August 10: 39.9 per 100,000
Avg. new daily cases in Anchorage in week ending August 3: 26.9 per 100,000
COVID-19 cases in Anchorage as of August 10: 46,320 (11,611.9 per 100,000)
Peak pandemic unemployment in Anchorage: 14.8% (April 2020)
Anchorage population: 398,900 (15.2 people per sq. mi.)
These are all the counties in Alaska where COVID-19 is slowing (and where it’s still getting worse).
Source: Chris Szwedo / iStock via Getty Images
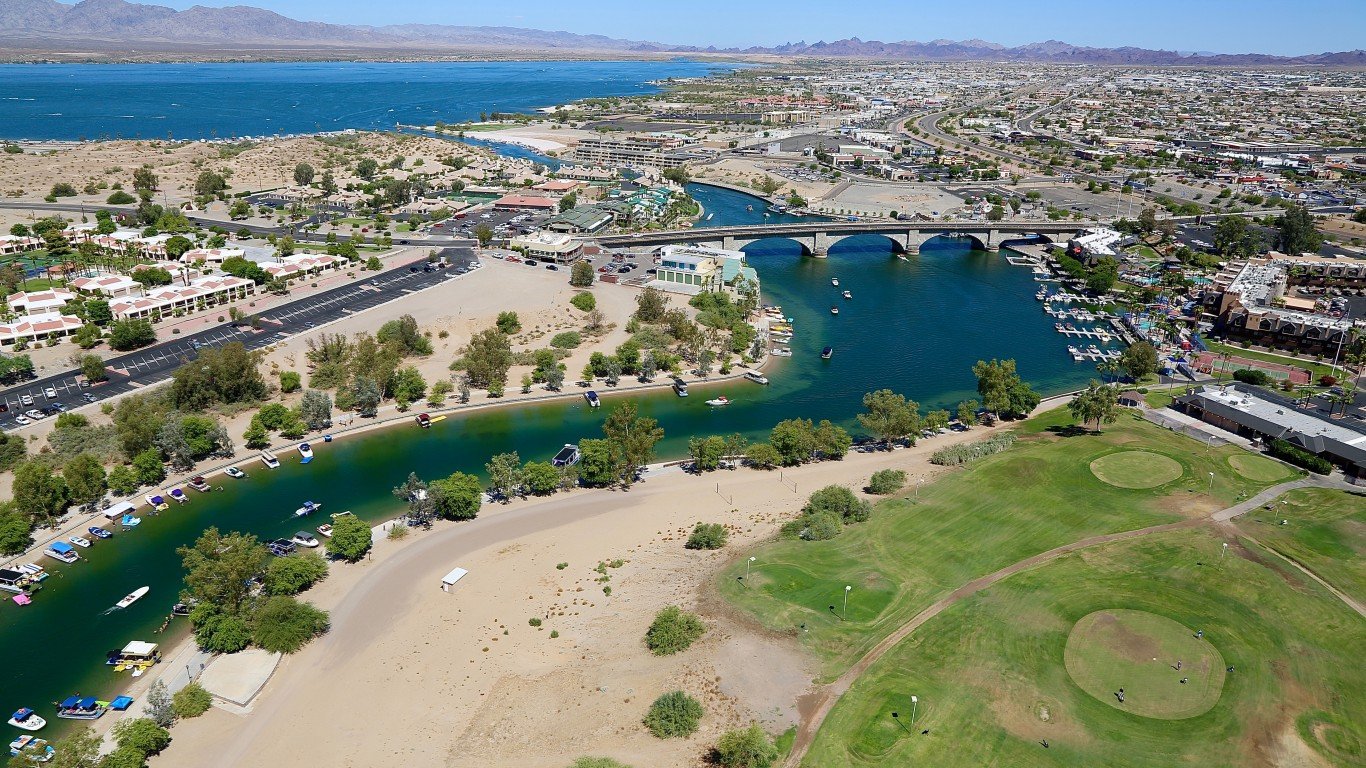
Arizona: Lake Havasu City-Kingman
Avg. new daily cases in Lake Havasu City in week ending August 10: 36.9 per 100,000
Avg. new daily cases in Lake Havasu City in week ending August 3: 34.2 per 100,000
COVID-19 cases in Lake Havasu City as of August 10: 26,071 (12,552.5 per 100,000)
Peak pandemic unemployment in Lake Havasu City: 19.8% (April 2020)
Lake Havasu City population: 207,695 (15.6 people per sq. mi.)

Source: danthi66 / Getty Images
Arkansas: Hot Springs
Avg. new daily cases in Hot Springs in week ending August 10: 87.8 per 100,000
Avg. new daily cases in Hot Springs in week ending August 3: 82.2 per 100,000
COVID-19 cases in Hot Springs as of August 10: 12,821 (13,009.0 per 100,000)
Peak pandemic unemployment in Hot Springs: 16.4% (April 2020)
Hot Springs population: 98,555 (145.4 people per sq. mi.)
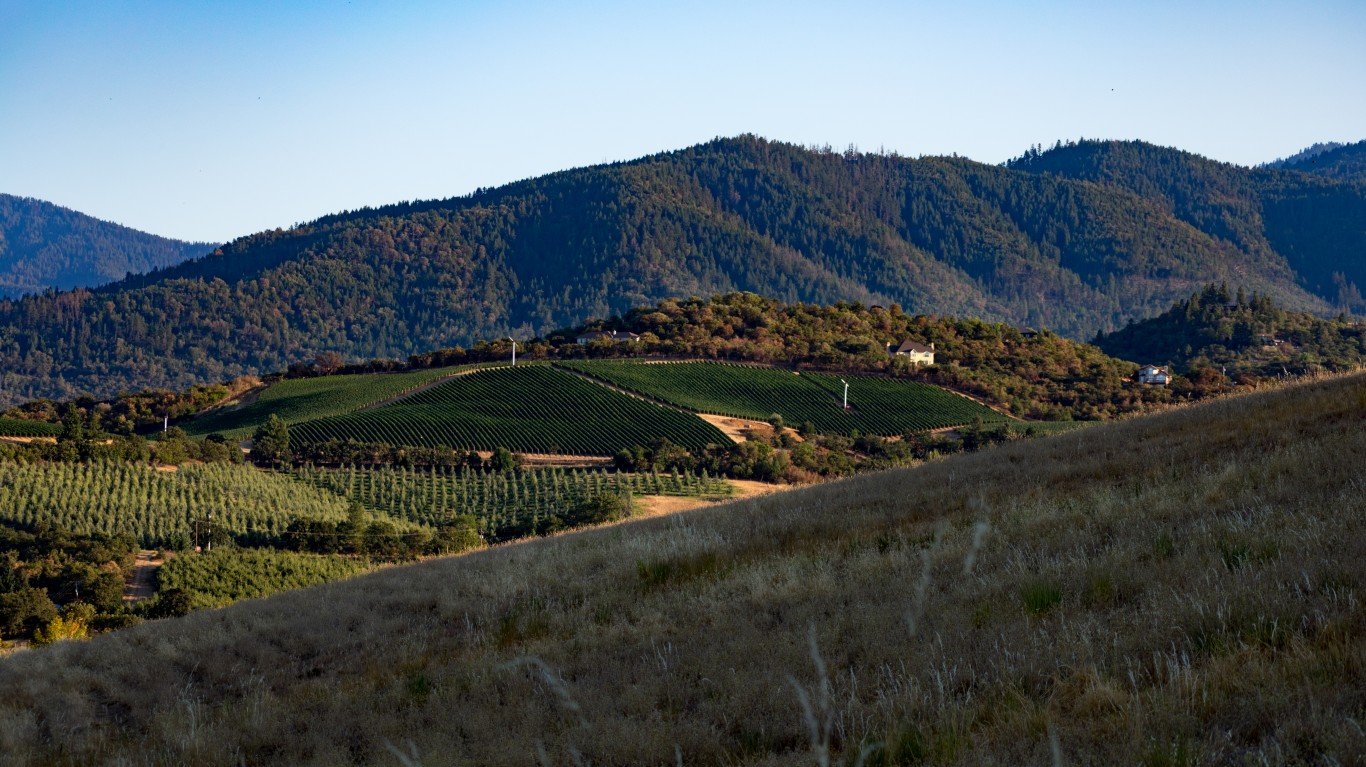
Source: peeterv / iStock via Getty Images
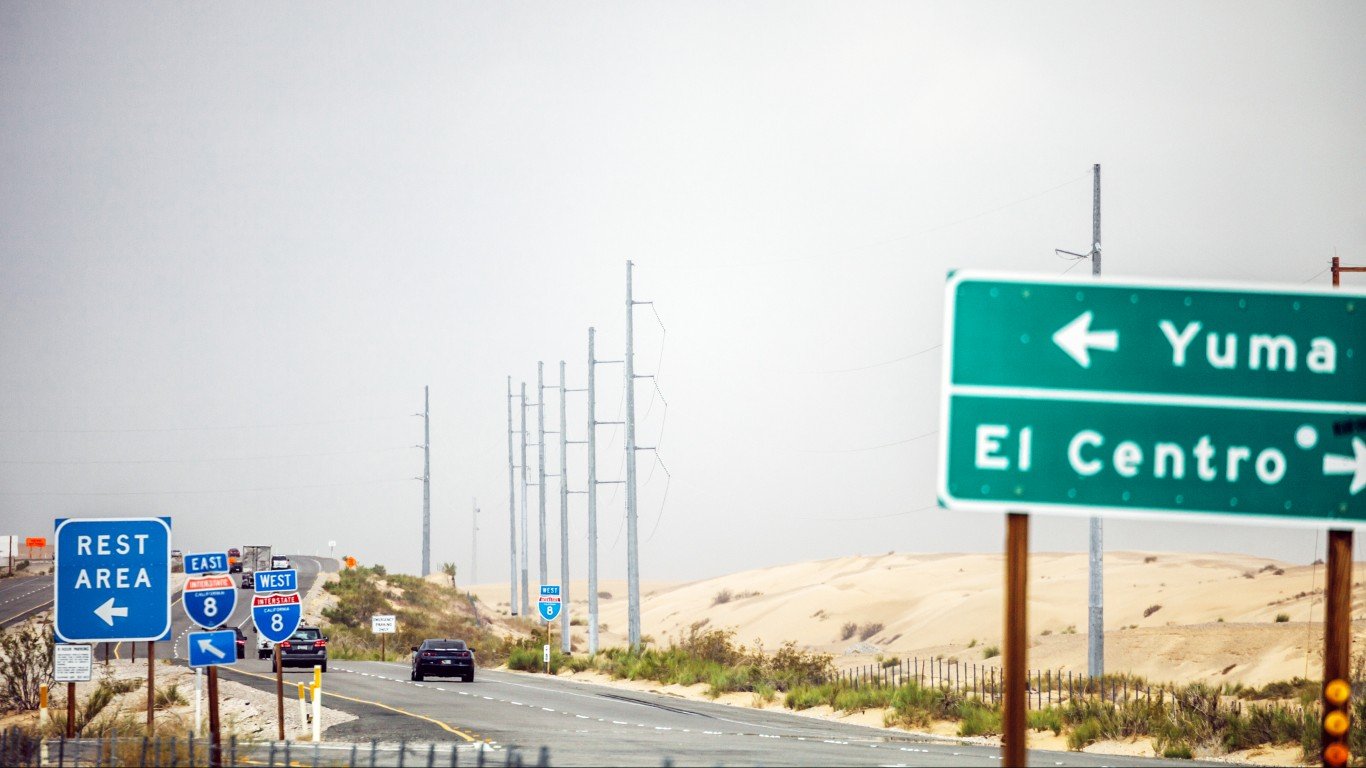
California: El Centro
Avg. new daily cases in El Centro in week ending August 10: 119.0 per 100,000
Avg. new daily cases in El Centro in week ending August 3: 11.3 per 100,000
COVID-19 cases in El Centro as of August 10: 29,470 (16,308.7 per 100,000)
Peak pandemic unemployment in El Centro: 30.0% (April 2020)
El Centro population: 180,701 (43.3 people per sq. mi.)
Source: oneillbro / Getty Images
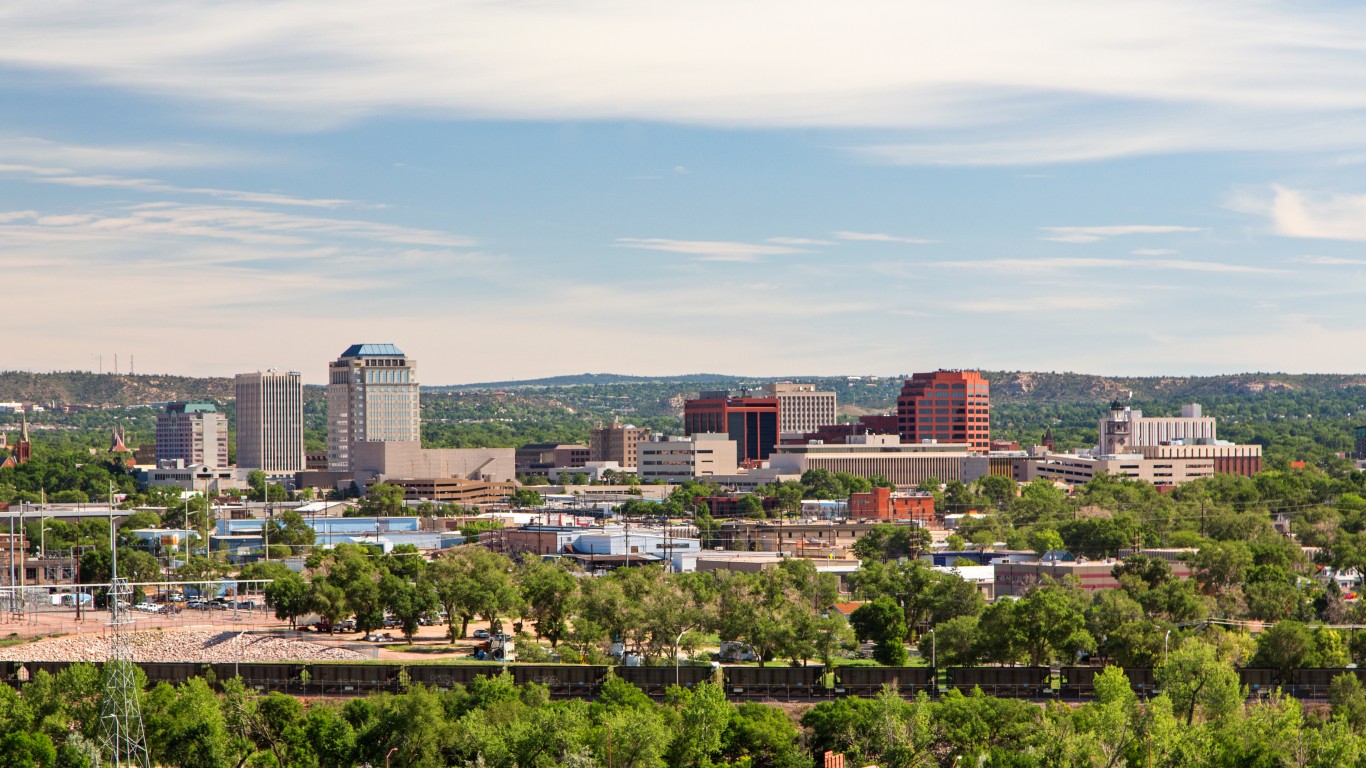
Colorado: Colorado Springs
Avg. new daily cases in Colorado Springs in week ending August 10: 25.5 per 100,000
Avg. new daily cases in Colorado Springs in week ending August 3: 16.4 per 100,000
COVID-19 cases in Colorado Springs as of August 10: 79,502 (10,988.6 per 100,000)
Peak pandemic unemployment in Colorado Springs: 12.6% (April 2020)
Colorado Springs population: 723,498 (269.6 people per sq. mi.)
Source: pabradyphoto / iStock via Getty Images
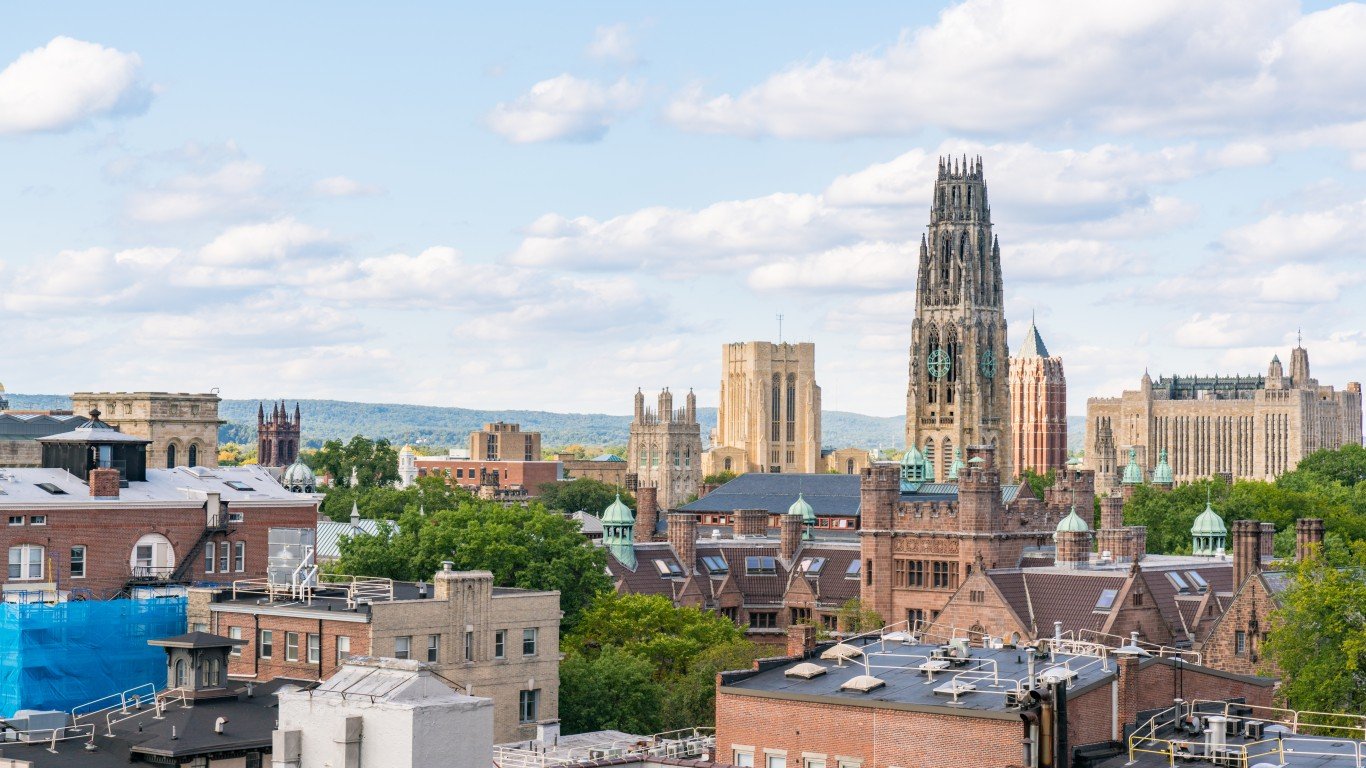
Connecticut: New Haven-Milford
Avg. new daily cases in New Haven in week ending August 10: 16.5 per 100,000
Avg. new daily cases in New Haven in week ending August 3: 8.0 per 100,000
COVID-19 cases in New Haven as of August 10: 94,736 (11,047.8 per 100,000)
Peak pandemic unemployment in New Haven: 9.5% (July 2020)
New Haven population: 857,513 (1,418.5 people per sq. mi.)

Source: aimintang / Getty Images
Delaware: Dover
Avg. new daily cases in Dover in week ending August 10: 16.9 per 100,000
Avg. new daily cases in Dover in week ending August 3: 7.0 per 100,000
COVID-19 cases in Dover as of August 10: 18,883 (10,686.5 per 100,000)
Peak pandemic unemployment in Dover: 17.3% (May 2020)
Dover population: 176,699 (301.4 people per sq. mi.)

Source: SeanPavonePhoto / Getty Images
Florida: Jacksonville
Avg. new daily cases in Jacksonville in week ending August 10: 119.6 per 100,000
Avg. new daily cases in Jacksonville in week ending August 3: 109.8 per 100,000
COVID-19 cases in Jacksonville as of August 10: 205,986 (13,699.8 per 100,000)
Peak pandemic unemployment in Jacksonville: 11.4% (April 2020)
Jacksonville population: 1,503,574 (469.7 people per sq. mi.)
Source: Janabi / Getty Images
Georgia: Valdosta
Avg. new daily cases in Valdosta in week ending August 10: 117.6 per 100,000
Avg. new daily cases in Valdosta in week ending August 3: 33.9 per 100,000
COVID-19 cases in Valdosta as of August 10: 17,931 (12,339.4 per 100,000)
Peak pandemic unemployment in Valdosta: 10.3% (April 2020)
Valdosta population: 145,315 (91.4 people per sq. mi.)

Source: 7Michael / iStock via Getty Images
Hawaii: Kahului-Wailuku-Lahaina
Avg. new daily cases in Kahului in week ending August 10: 28.7 per 100,000
Avg. new daily cases in Kahului in week ending August 3: 13.9 per 100,000
COVID-19 cases in Kahului as of August 10: 5,754 (3,466.7 per 100,000)
Peak pandemic unemployment in Kahului: 34.8% (April 2020)
Kahului population: 165,979 (142.9 people per sq. mi.)
These are all the counties in Hawaii where COVID-19 is slowing (and where it’s still getting worse).
Source: bpperry / iStock via Getty Images
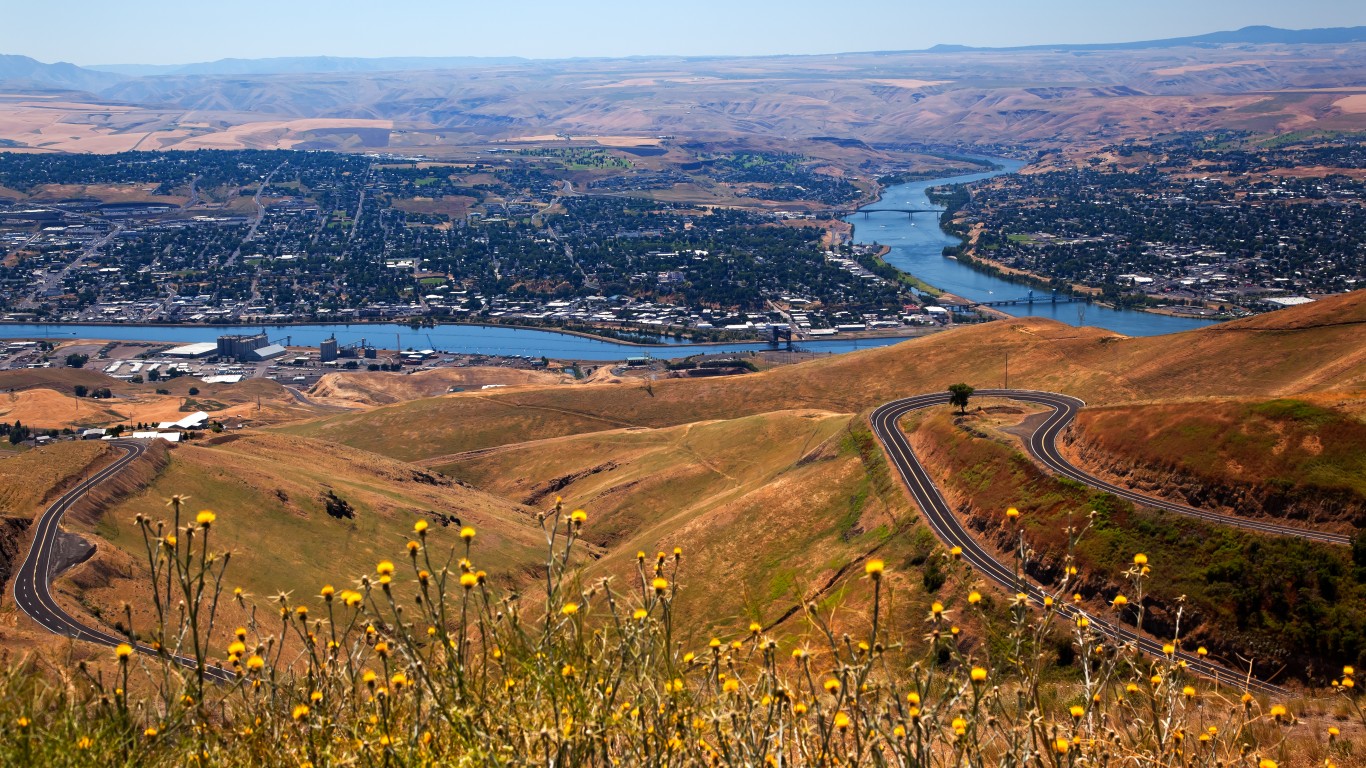
Idaho: Lewiston, ID-WA
Avg. new daily cases in Lewiston in week ending August 10: 48.5 per 100,000
Avg. new daily cases in Lewiston in week ending August 3: 18.1 per 100,000
COVID-19 cases in Lewiston as of August 10: 5,687 (9,079.2 per 100,000)
Peak pandemic unemployment in Lewiston: 11.2% (April 2020)
Lewiston population: 62,638 (42.2 people per sq. mi.)
These are all the counties in Idaho where COVID-19 is slowing (and where it’s still getting worse).

Source: sshepard / iStock Unreleased via Getty Images
Illinois: Carbondale-Marion
Avg. new daily cases in Carbondale in week ending August 10: 66.1 per 100,000
Avg. new daily cases in Carbondale in week ending August 3: 48.7 per 100,000
COVID-19 cases in Carbondale as of August 10: 15,954 (11,596.8 per 100,000)
Peak pandemic unemployment in Carbondale: 18.1% (April 2020)
Carbondale population: 137,573 (102.0 people per sq. mi.)
Source: DenisTangneyJr / iStock via Getty Images
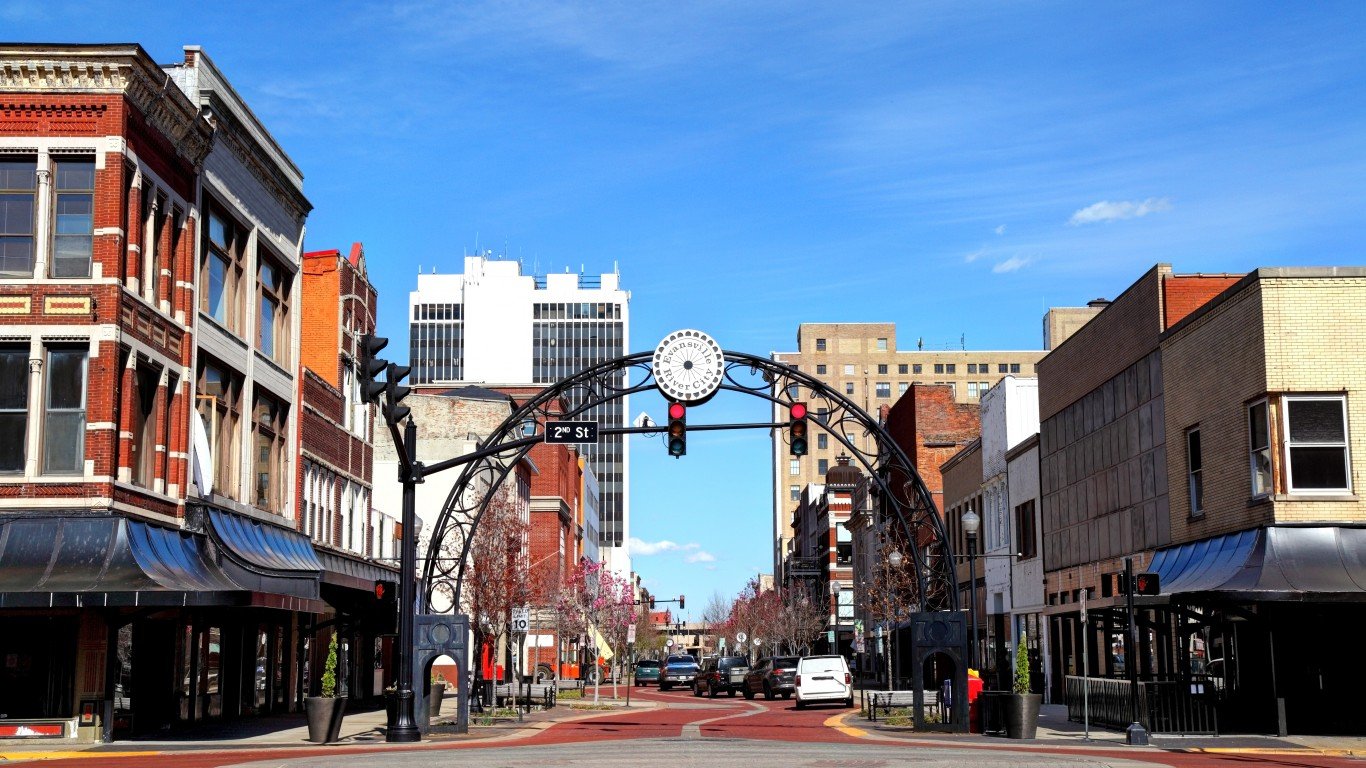
Indiana: Evansville, IN-KY
Avg. new daily cases in Evansville in week ending August 10: 43.0 per 100,000
Avg. new daily cases in Evansville in week ending August 3: 21.4 per 100,000
COVID-19 cases in Evansville as of August 10: 40,611 (12,894.0 per 100,000)
Peak pandemic unemployment in Evansville: 15.2% (April 2020)
Evansville population: 314,960 (215.1 people per sq. mi.)

Source: Jacob Boomsma / Getty Images
Iowa: Waterloo-Cedar Falls
Avg. new daily cases in Waterloo in week ending August 10: 22.9 per 100,000
Avg. new daily cases in Waterloo in week ending August 3: 15.4 per 100,000
COVID-19 cases in Waterloo as of August 10: 21,496 (12,677.8 per 100,000)
Peak pandemic unemployment in Waterloo: 11.6% (April 2020)
Waterloo population: 169,556 (112.8 people per sq. mi.)
These are all the counties in Iowa where COVID-19 is slowing (and where it’s still getting worse).
Source: LawrenceSawyer / Getty Images
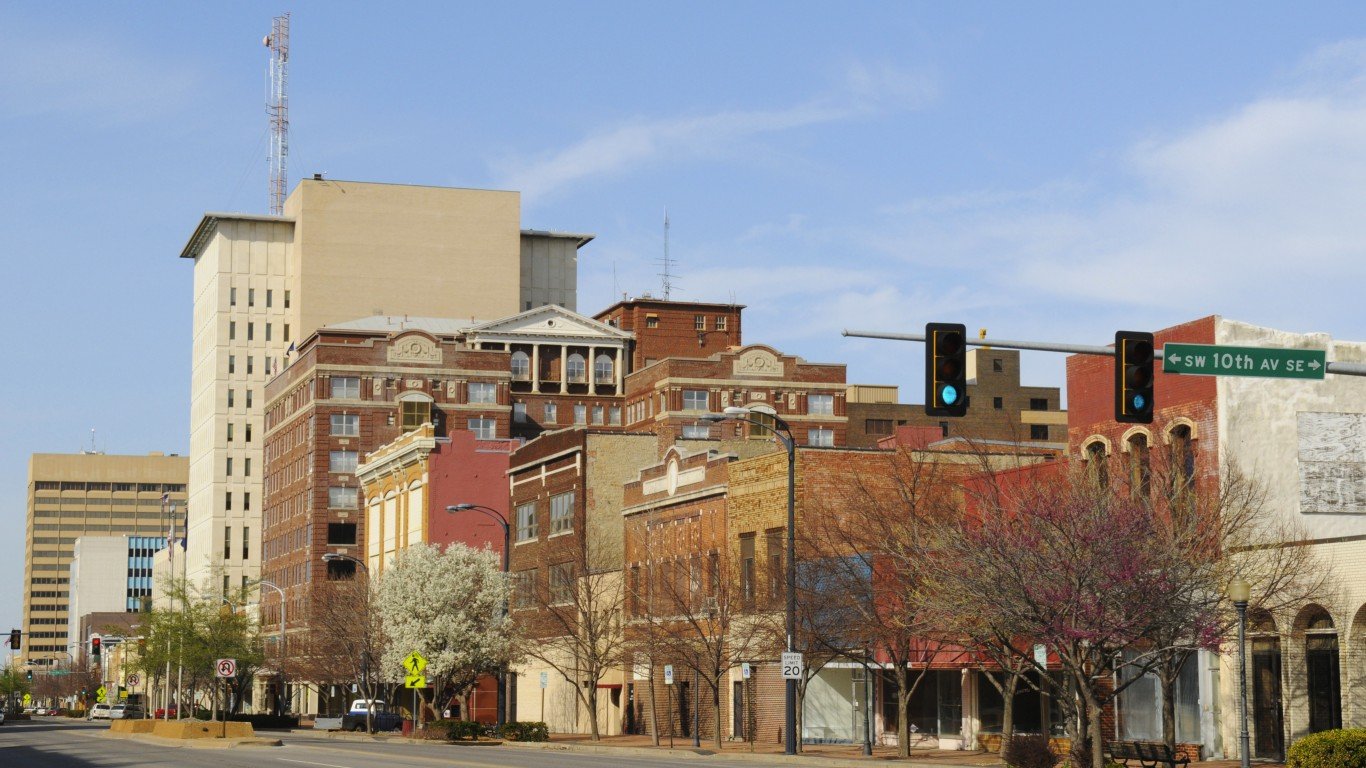
Kansas: Topeka
Avg. new daily cases in Topeka in week ending August 10: 27.2 per 100,000
Avg. new daily cases in Topeka in week ending August 3: 23.4 per 100,000
COVID-19 cases in Topeka as of August 10: 24,571 (10,555.6 per 100,000)
Peak pandemic unemployment in Topeka: 12.4% (April 2020)
Topeka population: 232,778 (72.0 people per sq. mi.)
These are all the counties in Kansas where COVID-19 is slowing (and where it’s still getting worse).

Source: DenisTangneyJr / iStock via Getty Images
Kentucky: Owensboro
Avg. new daily cases in Owensboro in week ending August 10: 49.8 per 100,000
Avg. new daily cases in Owensboro in week ending August 3: 31.0 per 100,000
COVID-19 cases in Owensboro as of August 10: 13,877 (11,712.8 per 100,000)
Peak pandemic unemployment in Owensboro: 15.5% (April 2020)
Owensboro population: 118,477 (131.9 people per sq. mi.)
 by Ken Lund")
Louisiana: Houma-Thibodaux
Avg. new daily cases in Houma in week ending August 10: 159.6 per 100,000
Avg. new daily cases in Houma in week ending August 3: 97.5 per 100,000
COVID-19 cases in Houma as of August 10: 27,117 (12,902.9 per 100,000)
Peak pandemic unemployment in Houma: 13.1% (April 2020)
Houma population: 210,162 (91.4 people per sq. mi.)

Source: DenisTangneyJr / Getty Images
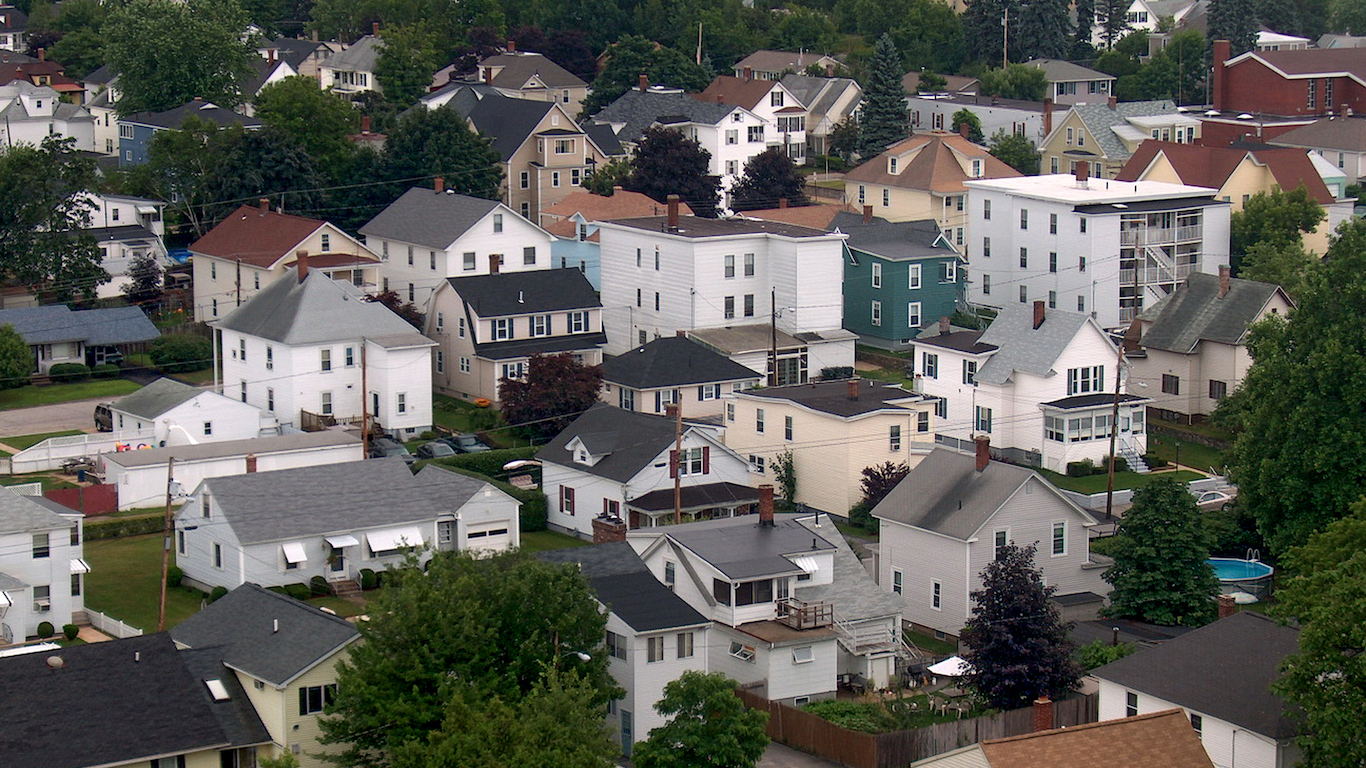
Maine: Bangor
Avg. new daily cases in Bangor in week ending August 10: 10.3 per 100,000
Avg. new daily cases in Bangor in week ending August 3: 4.9 per 100,000
COVID-19 cases in Bangor as of August 10: 6,611 (4,355.8 per 100,000)
Peak pandemic unemployment in Bangor: 9.6% (April 2020)
Bangor population: 151,774 (44.7 people per sq. mi.)
These are all the counties in Maine where COVID-19 is slowing (and where it’s still getting worse).
Source: DenisTangneyJr / Getty Images
Maryland: Salisbury, MD-DE
Avg. new daily cases in Salisbury in week ending August 10: 15.7 per 100,000
Avg. new daily cases in Salisbury in week ending August 3: 9.0 per 100,000
COVID-19 cases in Salisbury as of August 10: 41,598 (10,285.9 per 100,000)
Peak pandemic unemployment in Salisbury: 16.0% (April 2020)
Salisbury population: 404,417 (192.7 people per sq. mi.)

Source: OlegAlbinsky / iStock via Getty Images
Massachusetts: Barnstable Town
Avg. new daily cases in Barnstable Town in week ending August 10: 17.3 per 100,000
Avg. new daily cases in Barnstable Town in week ending August 3: 18.3 per 100,000
COVID-19 cases in Barnstable Town as of August 10: 14,718 (6,893.8 per 100,000)
Peak pandemic unemployment in Barnstable Town: 20.6% (April 2020)
Barnstable Town population: 213,496 (542.3 people per sq. mi.)

Source: DenisTangneyJr / Getty Images
Michigan: Saginaw
Avg. new daily cases in Saginaw in week ending August 10: 12.8 per 100,000
Avg. new daily cases in Saginaw in week ending August 3: 7.9 per 100,000
COVID-19 cases in Saginaw as of August 10: 21,839 (11,385.1 per 100,000)
Peak pandemic unemployment in Saginaw: 25.9% (April 2020)
Saginaw population: 191,821 (239.7 people per sq. mi.)

Minnesota: St. Cloud
Avg. new daily cases in St. Cloud in week ending August 10: 15.5 per 100,000
Avg. new daily cases in St. Cloud in week ending August 3: 6.9 per 100,000
COVID-19 cases in St. Cloud as of August 10: 28,865 (14,535.6 per 100,000)
Peak pandemic unemployment in St. Cloud: 9.4% (May 2020)
St. Cloud population: 198,581 (113.4 people per sq. mi.)
Source: DenisTangneyJr / Getty Images
Mississippi: Hattiesburg
Avg. new daily cases in Hattiesburg in week ending August 10: 120.2 per 100,000
Avg. new daily cases in Hattiesburg in week ending August 3: 66.3 per 100,000
COVID-19 cases in Hattiesburg as of August 10: 21,471 (12,766.9 per 100,000)
Peak pandemic unemployment in Hattiesburg: 13.3% (April 2020)
Hattiesburg population: 168,177 (83.1 people per sq. mi.)
Source: gnagel / Getty Images
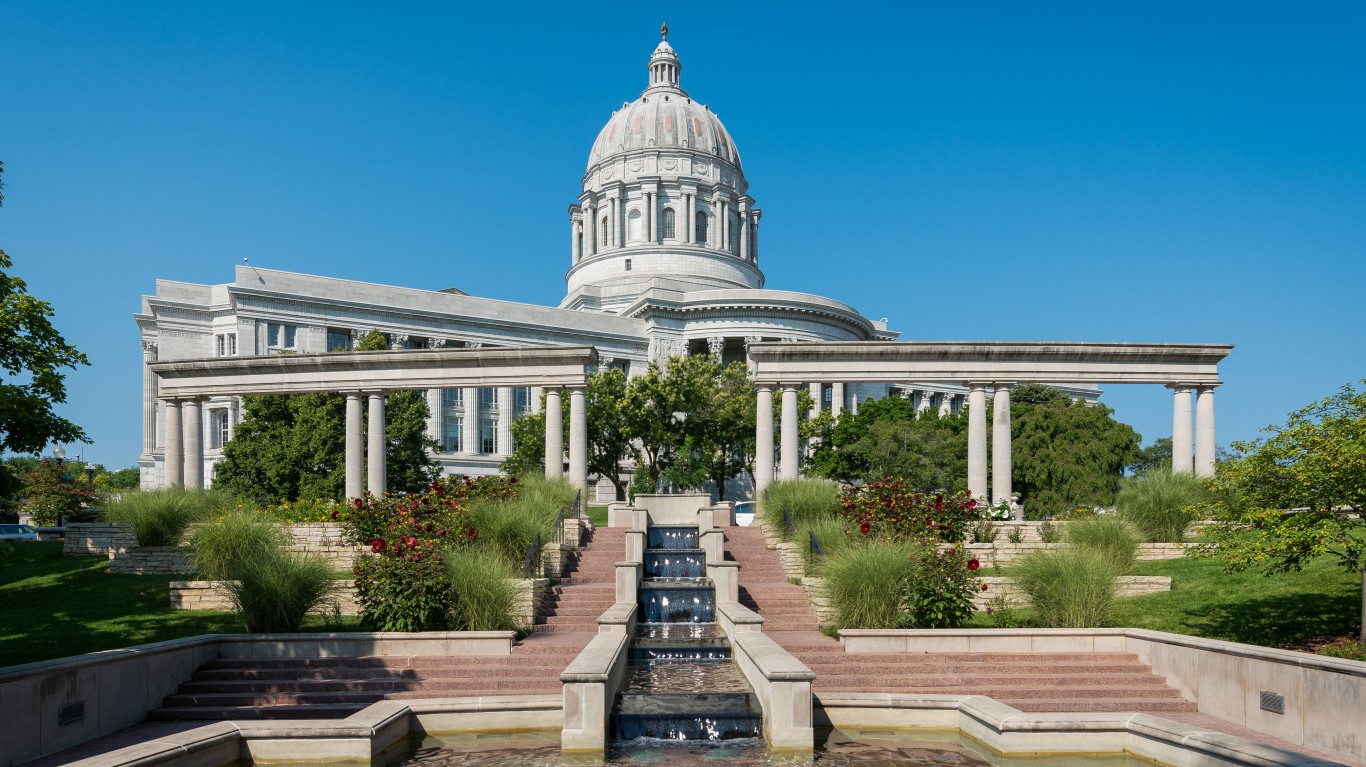
Missouri: Jefferson City
Avg. new daily cases in Jefferson City in week ending August 10: 77.1 per 100,000
Avg. new daily cases in Jefferson City in week ending August 3: 61.1 per 100,000
COVID-19 cases in Jefferson City as of August 10: 21,192 (14,009.1 per 100,000)
Peak pandemic unemployment in Jefferson City: 7.1% (April 2020)
Jefferson City population: 151,273 (67.3 people per sq. mi.)

Source: leezsnow / Getty Images
Montana: Great Falls
Avg. new daily cases in Great Falls in week ending August 10: 22.3 per 100,000
Avg. new daily cases in Great Falls in week ending August 3: 18.0 per 100,000
COVID-19 cases in Great Falls as of August 10: 9,906 (12,136.0 per 100,000)
Peak pandemic unemployment in Great Falls: 12.6% (April 2020)
Great Falls population: 81,625 (30.3 people per sq. mi.)

Source: Davel5957 / iStock via Getty Images
Nebraska: Omaha-Council Bluffs, NE-IA
Avg. new daily cases in Omaha in week ending August 10: 1.9 per 100,000
Avg. new daily cases in Omaha in week ending August 3: 1.3 per 100,000
COVID-19 cases in Omaha as of August 10: 117,016 (12,558.3 per 100,000)
Peak pandemic unemployment in Omaha: 10.2% (April 2020)
Omaha population: 931,779 (214.2 people per sq. mi.)

Source: f11photo / Getty Images
Nevada: Las Vegas-Henderson-Paradise
Avg. new daily cases in Las Vegas in week ending August 10: 45.7 per 100,000
Avg. new daily cases in Las Vegas in week ending August 3: 39.3 per 100,000
COVID-19 cases in Las Vegas as of August 10: 285,938 (13,104.4 per 100,000)
Peak pandemic unemployment in Las Vegas: 34.2% (April 2020)
Las Vegas population: 2,182,004 (276.5 people per sq. mi.)
These are all the counties in Nevada where COVID-19 is slowing (and where it’s still getting worse).
Source: stockphoto52 / iStock
New Hampshire: Manchester-Nashua
Avg. new daily cases in Manchester in week ending August 10: 9.3 per 100,000
Avg. new daily cases in Manchester in week ending August 3: 4.0 per 100,000
COVID-19 cases in Manchester as of August 10: 37,051 (8,970.4 per 100,000)
Peak pandemic unemployment in Manchester: 17.5% (April 2020)
Manchester population: 413,035 (471.4 people per sq. mi.)
Source: Aneese / Getty Images
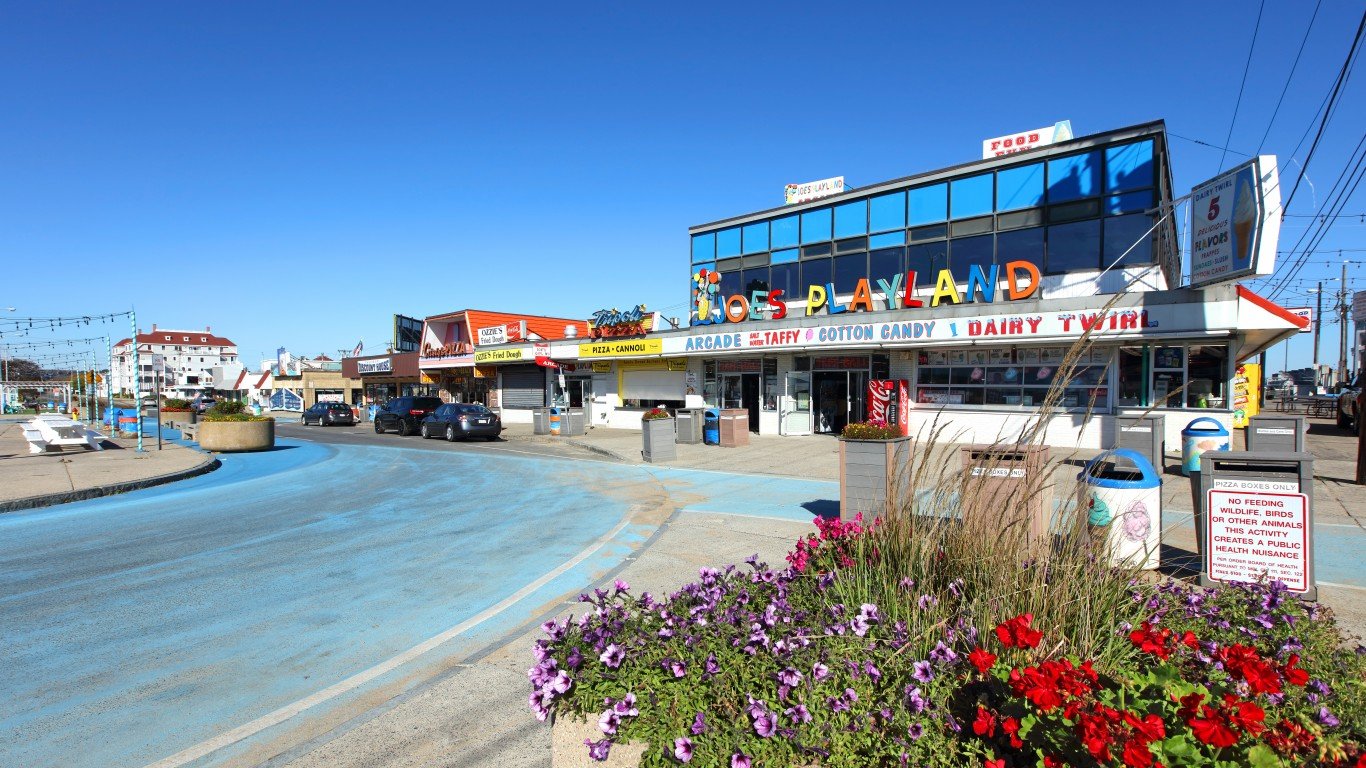
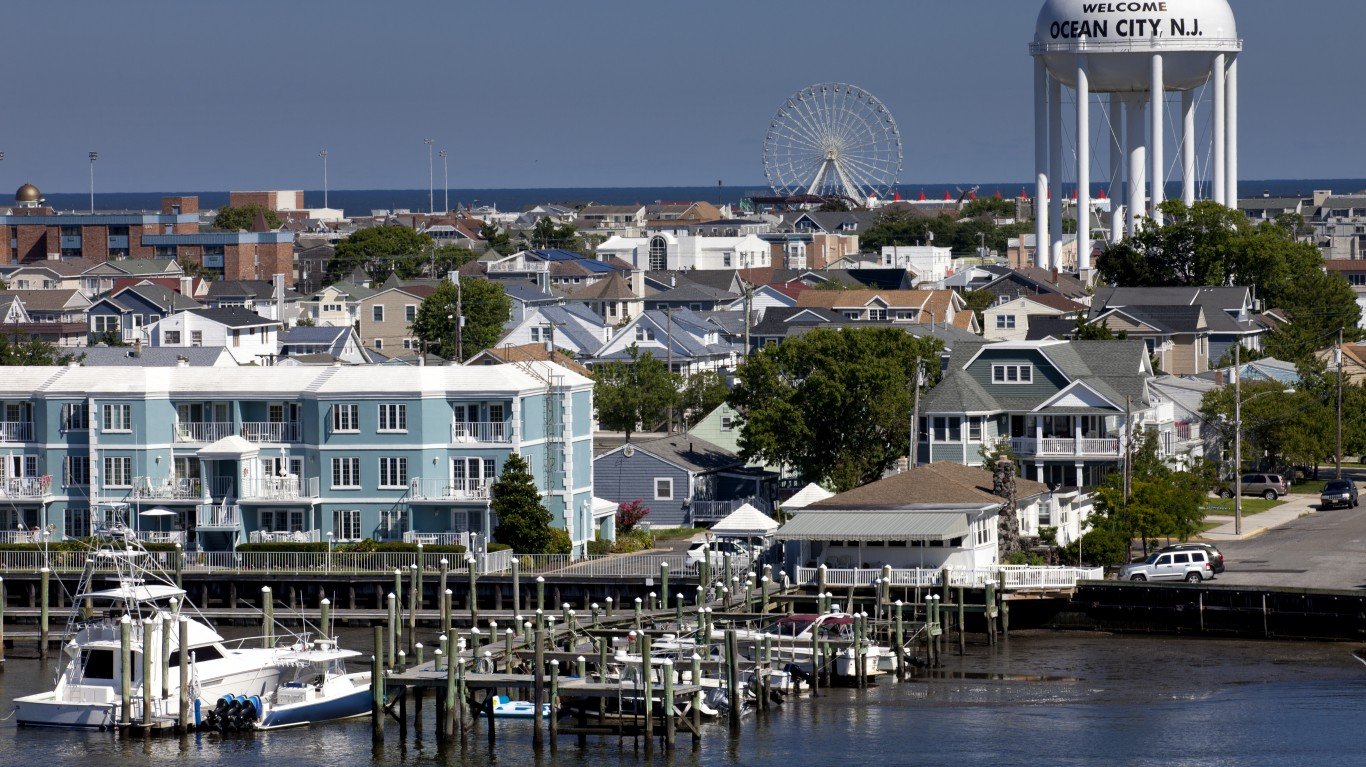
New Jersey: Ocean City
Avg. new daily cases in Ocean City in week ending August 10: 27.8 per 100,000
Avg. new daily cases in Ocean City in week ending August 3: 7.5 per 100,000
COVID-19 cases in Ocean City as of August 10: 9,668 (10,386.1 per 100,000)
Peak pandemic unemployment in Ocean City: 26.6% (June 2020)
Ocean City population: 93,086 (370.2 people per sq. mi.)

Source: ferrantraite / Getty Images
New Mexico: Albuquerque
Avg. new daily cases in Albuquerque in week ending August 10: 20.2 per 100,000
Avg. new daily cases in Albuquerque in week ending August 3: 11.4 per 100,000
COVID-19 cases in Albuquerque as of August 10: 82,580 (9,053.8 per 100,000)
Peak pandemic unemployment in Albuquerque: 12.8% (April 2020)
Albuquerque population: 912,108 (98.3 people per sq. mi.)

Source: FilippoBacci / E+ via Getty Images
New York: New York-Newark-Jersey City, NY-NJ-PA
Avg. new daily cases in New York in week ending August 10: 16.5 per 100,000
Avg. new daily cases in New York in week ending August 3: 11.2 per 100,000
COVID-19 cases in New York as of August 10: 2,385,393 (12,363.2 per 100,000)
Peak pandemic unemployment in New York: 17.2% (June 2020)
New York population: 19,294,236 (2,885.4 people per sq. mi.)
Source: DenisTangneyJr / Getty Images
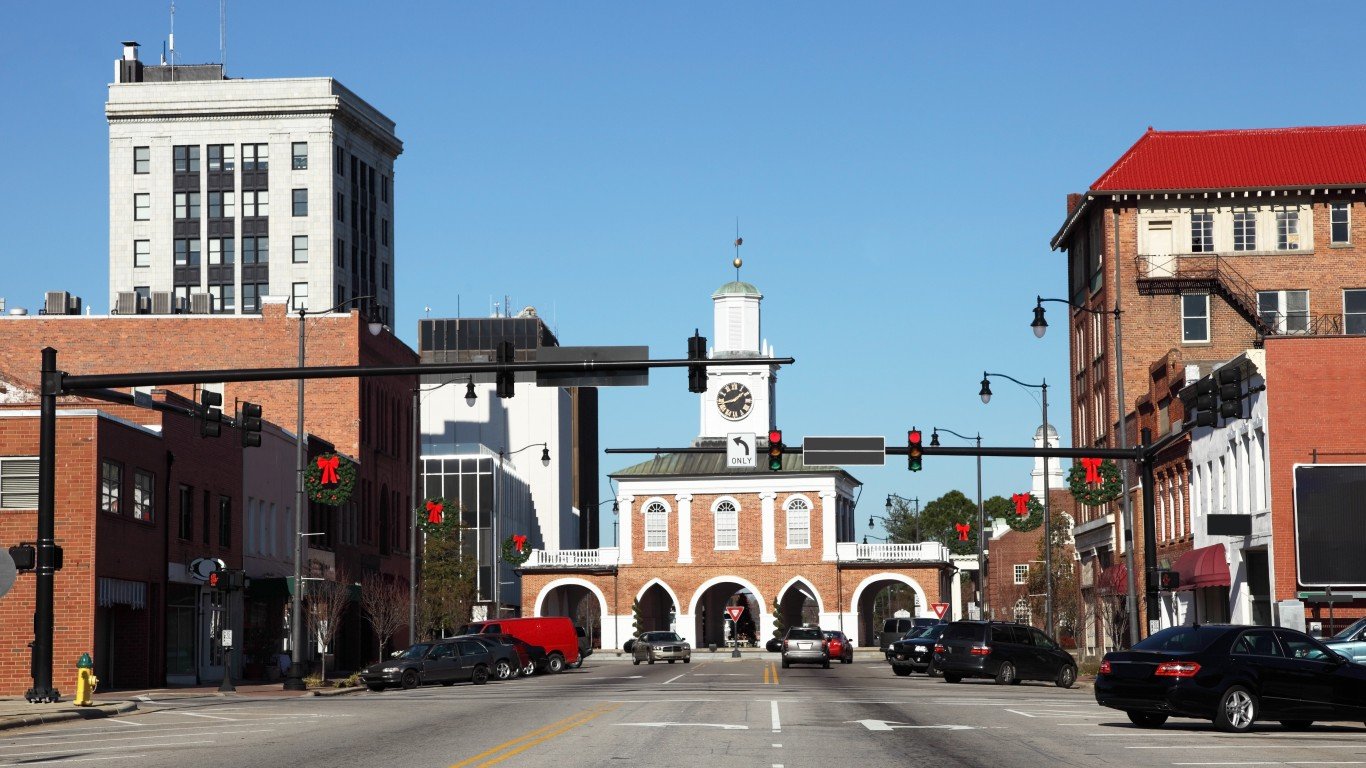
North Carolina: Fayetteville
Avg. new daily cases in Fayetteville in week ending August 10: 41.7 per 100,000
Avg. new daily cases in Fayetteville in week ending August 3: 29.4 per 100,000
COVID-19 cases in Fayetteville as of August 10: 51,600 (9,940.3 per 100,000)
Peak pandemic unemployment in Fayetteville: 15.8% (May 2020)
Fayetteville population: 519,101 (316.9 people per sq. mi.)
Source: powerofforever / Getty Images
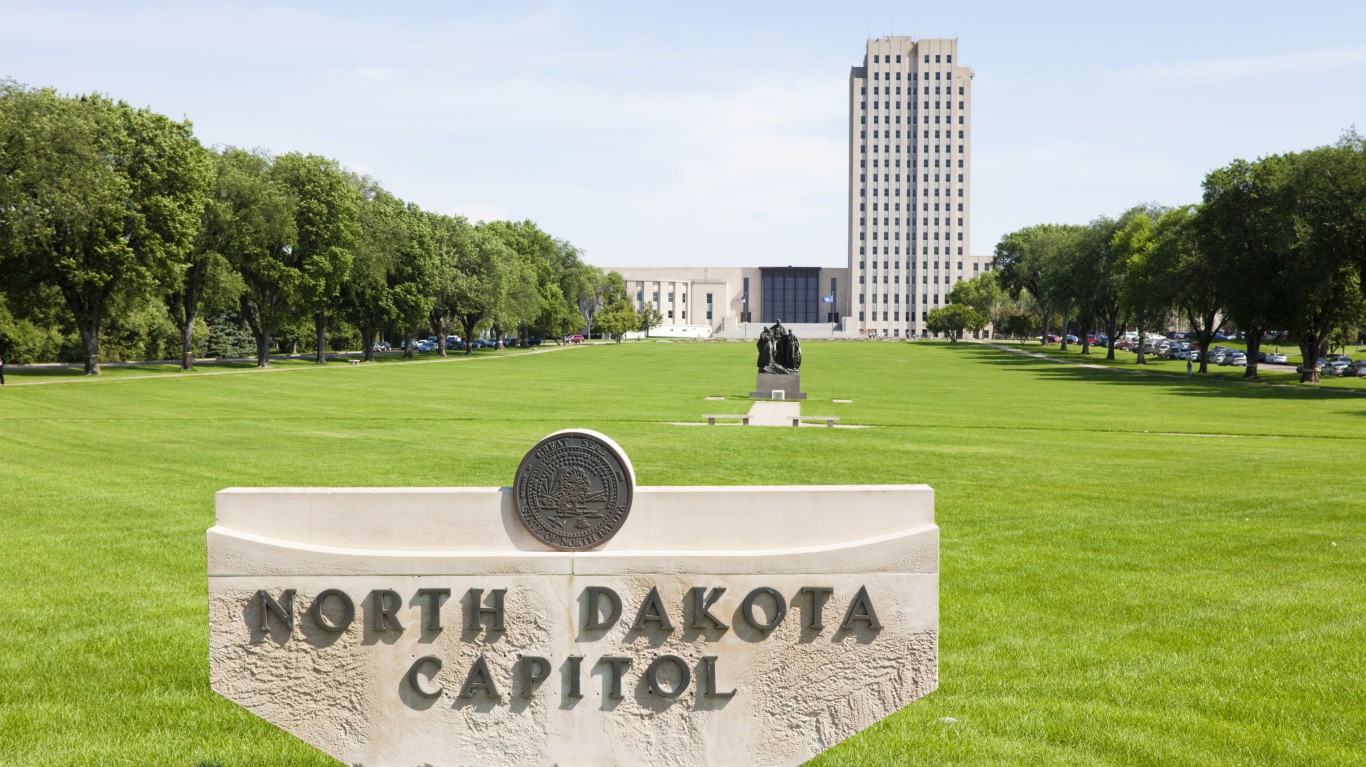
North Dakota: Bismarck
Avg. new daily cases in Bismarck in week ending August 10: 14.2 per 100,000
Avg. new daily cases in Bismarck in week ending August 3: 8.5 per 100,000
COVID-19 cases in Bismarck as of August 10: 21,899 (17,175.3 per 100,000)
Peak pandemic unemployment in Bismarck: 9.5% (April 2020)
Bismarck population: 127,503 (29.8 people per sq. mi.)

Source: ehrlif / iStock Editorial via Getty Images
Ohio: Mansfield
Avg. new daily cases in Mansfield in week ending August 10: 20.2 per 100,000
Avg. new daily cases in Mansfield in week ending August 3: 8.4 per 100,000
COVID-19 cases in Mansfield as of August 10: 12,038 (9,940.5 per 100,000)
Peak pandemic unemployment in Mansfield: 20.4% (April 2020)
Mansfield population: 121,100 (244.5 people per sq. mi.)
These are all the counties in Ohio where COVID-19 is slowing (and where it’s still getting worse).

Source: Davel5957 / Getty Images
Oklahoma: Tulsa
Avg. new daily cases in Tulsa in week ending August 10: 48.5 per 100,000
Avg. new daily cases in Tulsa in week ending August 3: 35.5 per 100,000
COVID-19 cases in Tulsa as of August 10: 122,548 (12,371.8 per 100,000)
Peak pandemic unemployment in Tulsa: 15.7% (April 2020)
Tulsa population: 990,544 (158.0 people per sq. mi.)
Source: Grant Wylie / Getty Images
Oregon: Medford
Avg. new daily cases in Medford in week ending August 10: 53.0 per 100,000
Avg. new daily cases in Medford in week ending August 3: 24.3 per 100,000
COVID-19 cases in Medford as of August 10: 13,438 (6,204.8 per 100,000)
Peak pandemic unemployment in Medford: 15.6% (April 2020)
Medford population: 216,574 (77.8 people per sq. mi.)
These are all the counties in Oregon where COVID-19 is slowing (and where it’s still getting worse).

Source: CynthiaAnnF / iStock via Getty Images
Pennsylvania: East Stroudsburg
Avg. new daily cases in East Stroudsburg in week ending August 10: 13.2 per 100,000
Avg. new daily cases in East Stroudsburg in week ending August 3: 8.3 per 100,000
COVID-19 cases in East Stroudsburg as of August 10: 15,275 (9,090.5 per 100,000)
Peak pandemic unemployment in East Stroudsburg: 20.5% (April 2020)
East Stroudsburg population: 168,032 (276.2 people per sq. mi.)

Source: Sean Pavone / iStock via Getty Images
Rhode Island: Providence-Warwick, RI-MA
Avg. new daily cases in Providence in week ending August 10: 14.2 per 100,000
Avg. new daily cases in Providence in week ending August 3: 7.8 per 100,000
COVID-19 cases in Providence as of August 10: 211,469 (13,067.6 per 100,000)
Peak pandemic unemployment in Providence: 18.5% (April 2020)
Providence population: 1,618,268 (1,019.8 people per sq. mi.)

Source: Sean Pavone / iStock via Getty Images
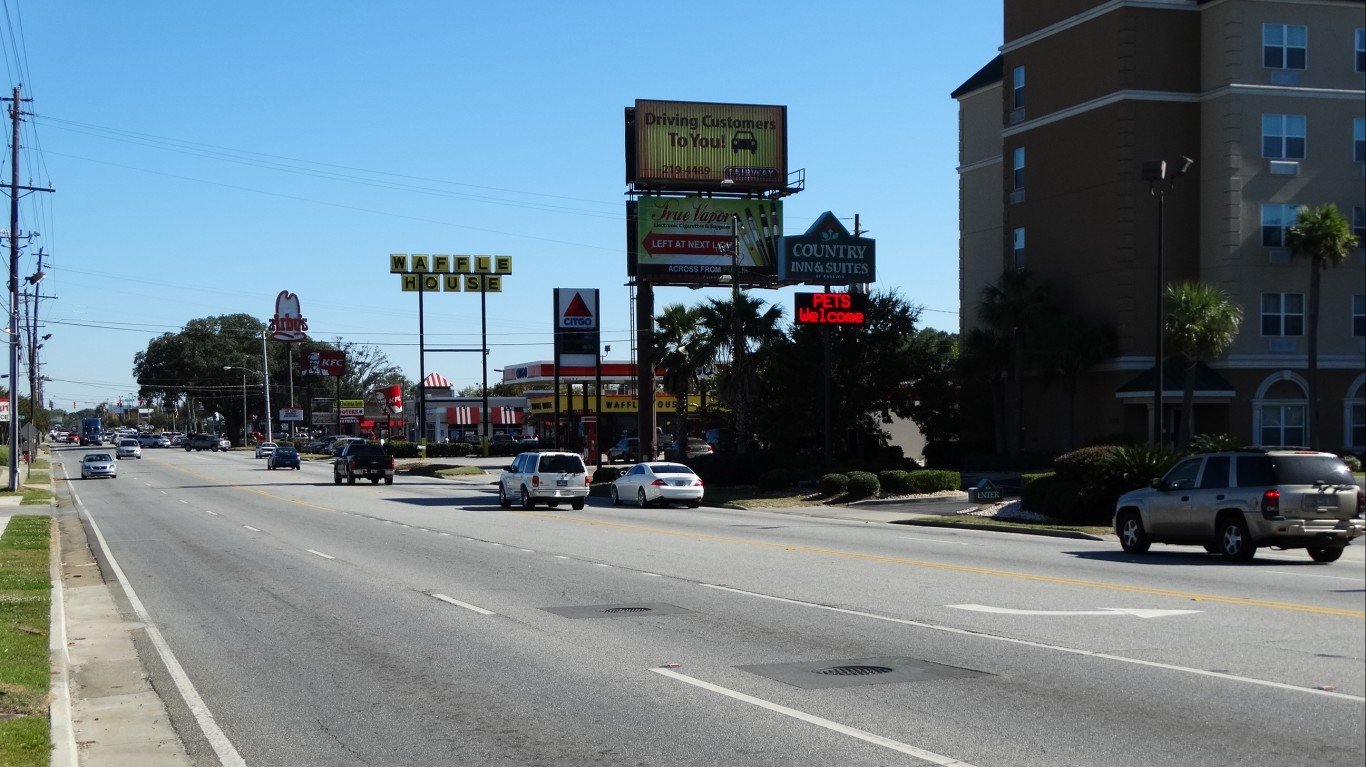
South Carolina: Myrtle Beach-Conway-North Myrtle Beach, SC-NC
Avg. new daily cases in Myrtle Beach in week ending August 10: 65.7 per 100,000
Avg. new daily cases in Myrtle Beach in week ending August 3: 30.9 per 100,000
COVID-19 cases in Myrtle Beach as of August 10: 53,992 (11,636.5 per 100,000)
Peak pandemic unemployment in Myrtle Beach: 22.0% (April 2020)
Myrtle Beach population: 463,987 (234.2 people per sq. mi.)
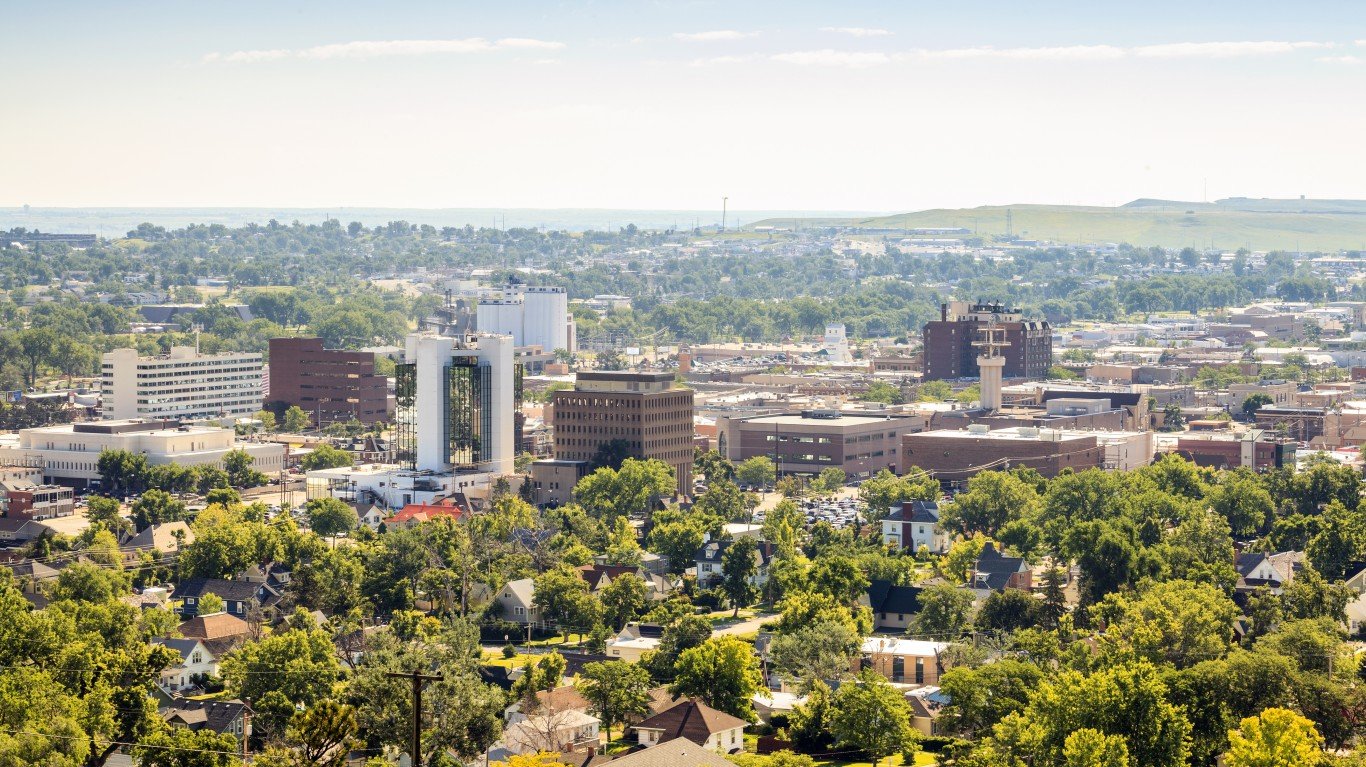
Source: EunikaSopotnicka / Getty Images
South Dakota: Rapid City
Avg. new daily cases in Rapid City in week ending August 10: 8.6 per 100,000
Avg. new daily cases in Rapid City in week ending August 3: 6.0 per 100,000
COVID-19 cases in Rapid City as of August 10: 17,013 (12,292.5 per 100,000)
Peak pandemic unemployment in Rapid City: 13.8% (April 2020)
Rapid City population: 138,402 (22.2 people per sq. mi.)

Source: BOB WESTON / Getty Images
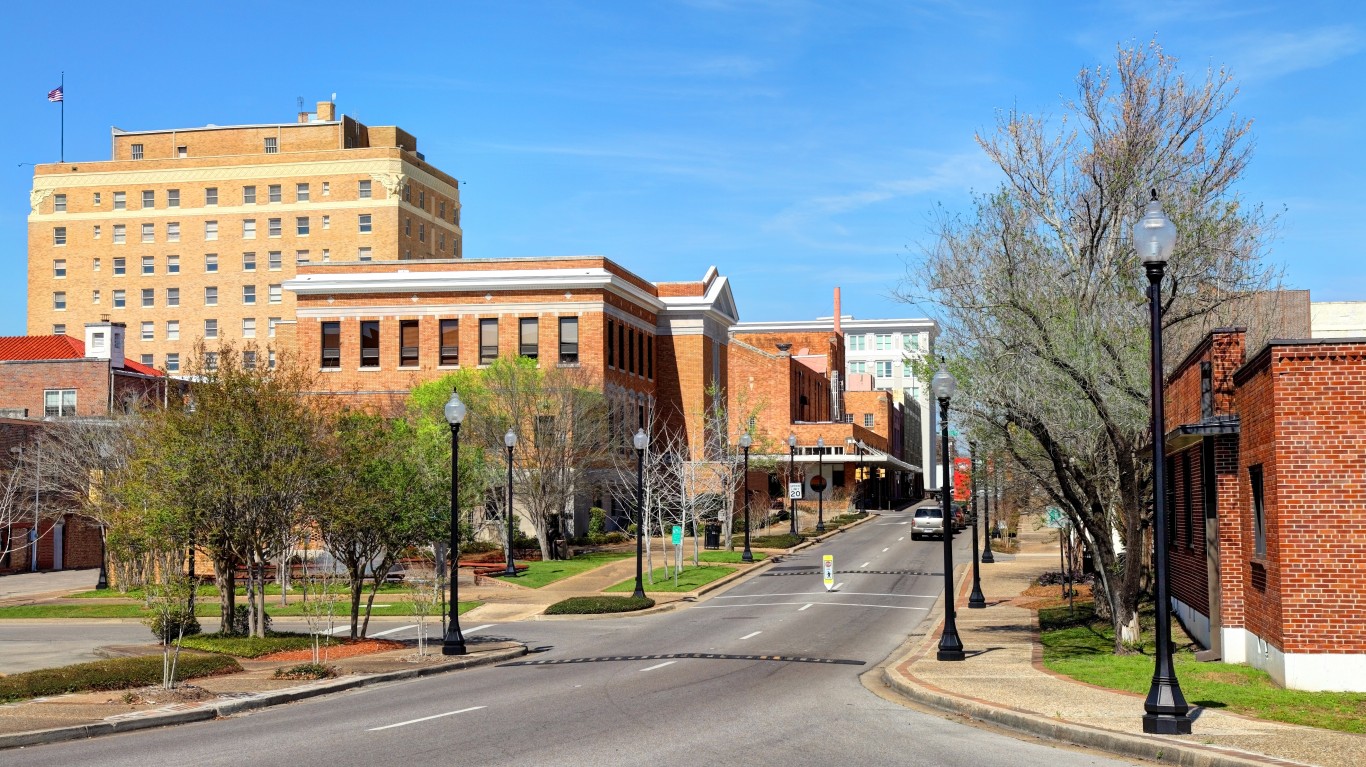
Tennessee: Jackson
Avg. new daily cases in Jackson in week ending August 10: 56.8 per 100,000
Avg. new daily cases in Jackson in week ending August 3: 26.1 per 100,000
COVID-19 cases in Jackson as of August 10: 24,120 (13,517.0 per 100,000)
Peak pandemic unemployment in Jackson: 14.0% (April 2020)
Jackson population: 178,442 (104.3 people per sq. mi.)
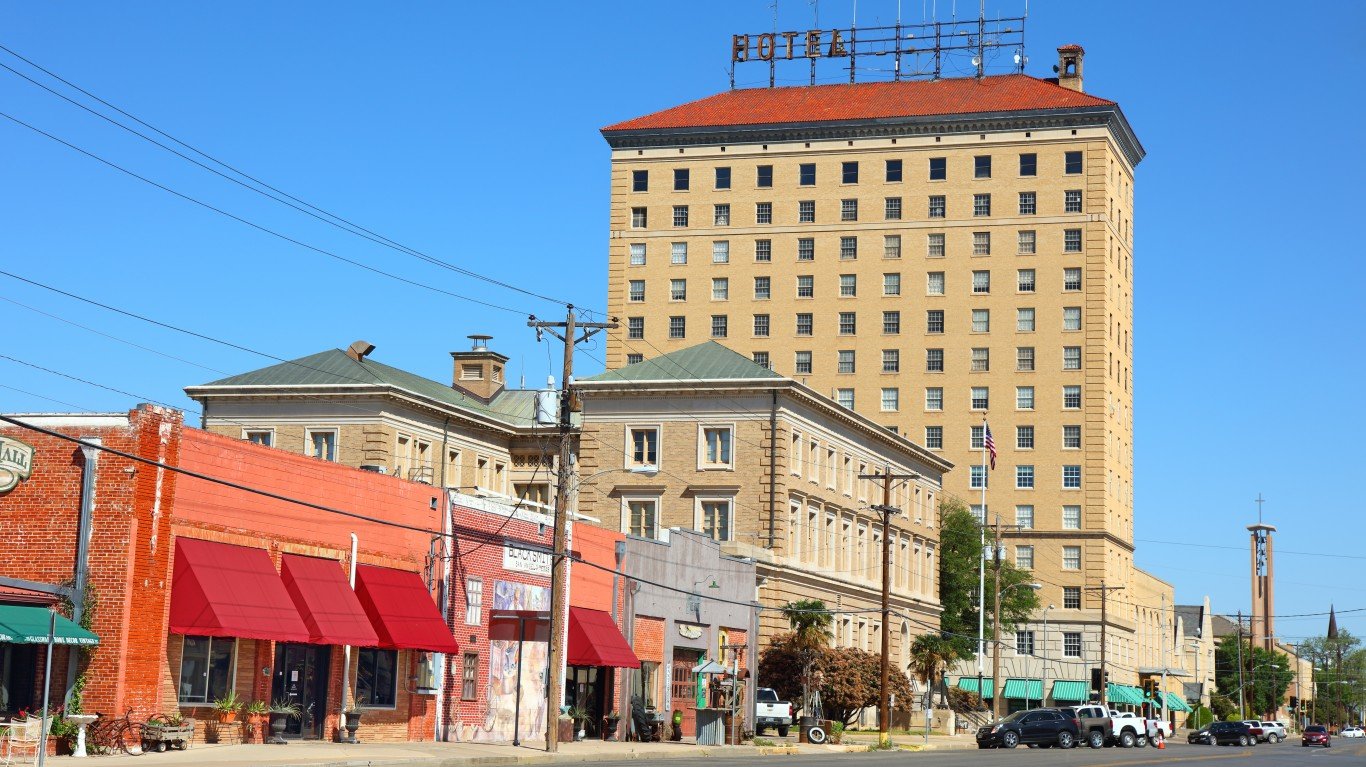
Source: DenisTangneyJr / Getty Images
Texas: San Angelo
Avg. new daily cases in San Angelo in week ending August 10: 85.4 per 100,000
Avg. new daily cases in San Angelo in week ending August 3: 53.3 per 100,000
COVID-19 cases in San Angelo as of August 10: 18,531 (15,706.1 per 100,000)
Peak pandemic unemployment in San Angelo: 11.1% (April 2020)
San Angelo population: 117,986 (77.5 people per sq. mi.)
These are all the counties in Texas where COVID-19 is slowing (and where it’s still getting worse).
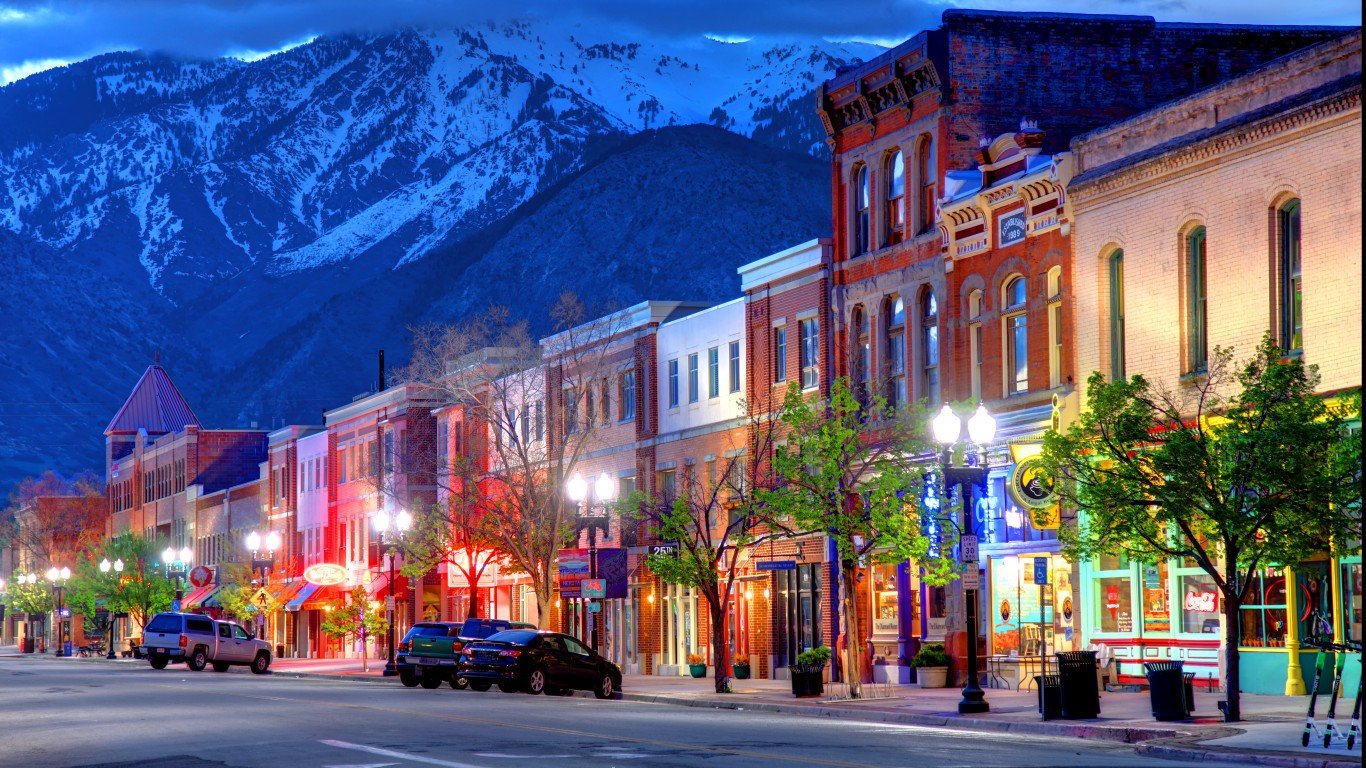
Source: DenisTangneyJr / iStock via Getty Images
Utah: Ogden-Clearfield
Avg. new daily cases in Ogden in week ending August 10: 69.5 per 100,000
Avg. new daily cases in Ogden in week ending August 3: 14.6 per 100,000
COVID-19 cases in Ogden as of August 10: 82,519 (12,448.7 per 100,000)
Peak pandemic unemployment in Ogden: 9.8% (April 2020)
Ogden population: 662,875 (91.7 people per sq. mi.)
These are all the counties in Utah where COVID-19 is slowing (and where it’s still getting worse).

Source: Sean Pavone / iStock via Getty Images
Vermont: Burlington-South Burlington
Avg. new daily cases in Burlington in week ending August 10: 12.8 per 100,000
Avg. new daily cases in Burlington in week ending August 3: 5.9 per 100,000
COVID-19 cases in Burlington as of August 10: 10,242 (4,681.3 per 100,000)
Peak pandemic unemployment in Burlington: 14.8% (April 2020)
Burlington population: 218,784 (174.7 people per sq. mi.)

Source: Sean Pavone / Getty Images
Virginia: Richmond
Avg. new daily cases in Richmond in week ending August 10: 21.8 per 100,000
Avg. new daily cases in Richmond in week ending August 3: 11.0 per 100,000
COVID-19 cases in Richmond as of August 10: 107,706 (8,483.9 per 100,000)
Peak pandemic unemployment in Richmond: 11.7% (April 2020)
Richmond population: 1,269,530 (290.9 people per sq. mi.)
Source: alohadave / iStock via Getty Images
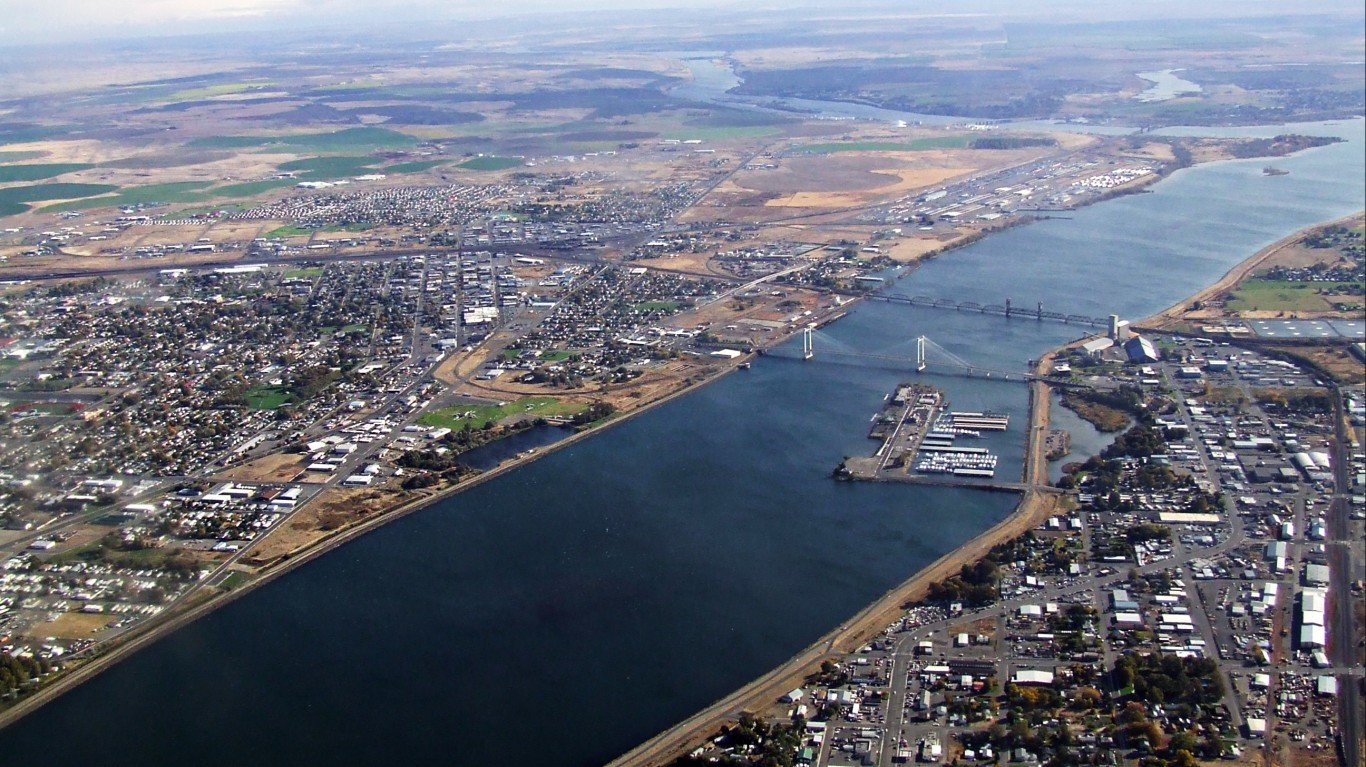
Washington: Kennewick-Richland
Avg. new daily cases in Kennewick in week ending August 10: 70.0 per 100,000
Avg. new daily cases in Kennewick in week ending August 3: 47.2 per 100,000
COVID-19 cases in Kennewick as of August 10: 34,892 (12,051.4 per 100,000)
Peak pandemic unemployment in Kennewick: 13.7% (April 2020)
Kennewick population: 289,527 (98.4 people per sq. mi.)

Source: traveler1116 / Getty Images
West Virginia: Huntington-Ashland, WV-KY-OH
Avg. new daily cases in Huntington in week ending August 10: 29.7 per 100,000
Avg. new daily cases in Huntington in week ending August 3: 15.1 per 100,000
COVID-19 cases in Huntington as of August 10: 36,422 (10,066.0 per 100,000)
Peak pandemic unemployment in Huntington: 17.2% (April 2020)
Huntington population: 361,832 (144.7 people per sq. mi.)

Source: Sean Pavone / iStock via Getty Images
Wisconsin: Milwaukee-Waukesha
Avg. new daily cases in Milwaukee in week ending August 10: 32.2 per 100,000
Avg. new daily cases in Milwaukee in week ending August 3: 15.9 per 100,000
COVID-19 cases in Milwaukee as of August 10: 201,136 (12,768.7 per 100,000)
Peak pandemic unemployment in Milwaukee: 14.1% (April 2020)
Milwaukee population: 1,575,223 (1,082.8 people per sq. mi.)

Source: Davel5957 / Getty Images
Wyoming: Cheyenne
Avg. new daily cases in Cheyenne in week ending August 10: 41.8 per 100,000
Avg. new daily cases in Cheyenne in week ending August 3: 26.9 per 100,000
COVID-19 cases in Cheyenne as of August 10: 11,796 (11,997.6 per 100,000)
Peak pandemic unemployment in Cheyenne: 9.2% (April 2020)
Cheyenne population: 98,320 (36.6 people per sq. mi.)
Click here to see all coronavirus data for every state.
Sponsored: Find a Qualified Financial Advisor
Finding a qualified financial advisor doesn’t have to be hard. SmartAsset’s free tool matches you with up to 3 fiduciary financial advisors in your area in 5 minutes. Each advisor has been vetted by SmartAsset and is held to a fiduciary standard to act in your best interests. If you’re ready to be matched with local advisors that can help you achieve your financial goals, get started now.
Thank you for reading! Have some feedback for us?
Contact the 24/7 Wall St. editorial team.
Editors' Picks


