
The U.S. has reported more than 36.5 million confirmed COVID-19 cases as of August 17, 2021. More than 610,000 Americans have died of COVID-19 — the highest death toll of any country.
The virus has spread throughout the country in a way that has been difficult to predict, surging in one region, then showing signs of improvement, and then reappearing in other regions. Though local outbreaks may ebb and flow, the current surge in cases has been felt nearly nationwide, leading to new travel restrictions and business closures around the country.
Nationwide, there were an average of 37.9 daily new coronavirus cases per 100,000 Americans in the week ending August 17, 2021. Cumulatively, the U.S. has reported 11,170.9 cases per 100,000 Americans, and 188.5 deaths per 100,000 Americans.
The extent of the spread of the novel coronavirus continues to vary considerably from state to state, and even from county to county. Even as the number of daily new cases is flattening or even declining in some parts of the country, new cases are surging at a growing rate in others.
The nation’s worst COVID-19 hot spot is in Colorado. In San Juan County, there were an average of 386.4 daily new coronavirus cases per 100,000 Americans in the week ending August 17, 2021 — more than 10.0 times greater than the national case growth rate and the most of any county in the country.
Other national hot spots include Cameron County, Texas; Neshoba County, Mississippi; and Lafourche Parish, Louisiana. Case growth in these counties range from 275.1 daily new cases per 100,000 residents to 192.9 daily new cases per 100,000.
To determine the county in each state with the highest rate of daily cases of the virus, 24/7 Wall St. compiled and reviewed data from state and local health departments. We ranked counties according to the average new number of cases per 100,000 residents per day during the week ending August 17, 2021. Population data used to adjust case and death totals came from the U.S. Census Bureau’s 2018 American Community Survey and are five-year estimates.

Source: Public Domain / Wikimedia Commons
Alabama: Mobile County
> Avg. new daily cases in Mobile County in week ending Aug 17, 2021: 148.5 per 100,000
> Cumulative confirmed COVID-19 cases in Mobile County as of Aug 17, 2021: 56,968 (13,738.5 per 100,000)
> Cumulative confirmed COVID-19 deaths in Mobile County as of Aug 17, 2021: 917 (221.1 per 100,000)
> Population: 414,659
> Largest place in Mobile County: Mobile

Alaska: Nome Census Area
> Avg. new daily cases in Nome Census Area in week ending Aug 17, 2021: 90.7 per 100,000
> Cumulative confirmed COVID-19 cases in Nome Census Area as of Aug 17, 2021: 530 (5,340.1 per 100,000)
> Cumulative confirmed COVID-19 deaths in Nome Census Area as of Aug 17, 2021: 0 (0.0 per 100,000)
> Population: 9,925
> Largest place in Nome Census Area: Nome
These are all the counties in Alaska where COVID-19 is slowing (and where it’s still getting worse).

Source: gionnixxx / Getty Images
Arizona: Pinal County
> Avg. new daily cases in Pinal County in week ending Aug 17, 2021: 48.5 per 100,000
> Cumulative confirmed COVID-19 cases in Pinal County as of Aug 17, 2021: 59,324 (14,134.2 per 100,000)
> Cumulative confirmed COVID-19 deaths in Pinal County as of Aug 17, 2021: 930 (221.6 per 100,000)
> Population: 419,721
> Largest place in Pinal County: Casa Grande

Source: usdagov / Flickr
Arkansas: Woodruff County
> Avg. new daily cases in Woodruff County in week ending Aug 17, 2021: 131.8 per 100,000
> Cumulative confirmed COVID-19 cases in Woodruff County as of Aug 17, 2021: 833 (12,507.5 per 100,000)
> Cumulative confirmed COVID-19 deaths in Woodruff County as of Aug 17, 2021: 16 (240.2 per 100,000)
> Population: 6,660
> Largest place in Woodruff County: Augusta

Source: Jeffrey Schwartz / iStock via Getty Images
California: Del Norte County
> Avg. new daily cases in Del Norte County in week ending Aug 17, 2021: 101.3 per 100,000
> Cumulative confirmed COVID-19 cases in Del Norte County as of Aug 17, 2021: 2,060 (7,511.7 per 100,000)
> Cumulative confirmed COVID-19 deaths in Del Norte County as of Aug 17, 2021: 10 (36.5 per 100,000)
> Population: 27,424
> Largest place in Del Norte County: Crescent City North

Source: JeffGoulden / iStock via Getty Images
Colorado: San Juan County
> Avg. new daily cases in San Juan County in week ending Aug 17, 2021: 386.4 per 100,000
> Cumulative confirmed COVID-19 cases in San Juan County as of Aug 17, 2021: 73 (13,419.1 per 100,000)
> Cumulative confirmed COVID-19 deaths in San Juan County as of Aug 17, 2021: 0 (0.0 per 100,000)
> Population: 544
> Largest place in San Juan County: Silverton

Source: DenisTangneyJr / Getty Images
Connecticut: Hartford County
> Avg. new daily cases in Hartford County in week ending Aug 17, 2021: 17.5 per 100,000
> Cumulative confirmed COVID-19 cases in Hartford County as of Aug 17, 2021: 88,038 (9,839.6 per 100,000)
> Cumulative confirmed COVID-19 deaths in Hartford County as of Aug 17, 2021: 2,447 (273.5 per 100,000)
> Population: 894,730
> Largest place in Hartford County: Hartford

Source: David Osberg / Getty Images
Delaware: Kent County
> Avg. new daily cases in Kent County in week ending Aug 17, 2021: 29.9 per 100,000
> Cumulative confirmed COVID-19 cases in Kent County as of Aug 17, 2021: 19,336 (11,060.4 per 100,000)
> Cumulative confirmed COVID-19 deaths in Kent County as of Aug 17, 2021: 384 (219.7 per 100,000)
> Population: 174,822
> Largest place in Kent County: Dover

Source: Joe Raedle / Getty Images News via Getty Images
Florida: Columbia County
> Avg. new daily cases in Columbia County in week ending Aug 17, 2021: 177.0 per 100,000
> Cumulative confirmed COVID-19 cases in Columbia County as of Aug 17, 2021: 11,331 (16,396.8 per 100,000)
> Cumulative confirmed COVID-19 deaths in Columbia County as of Aug 17, 2021: 170 (246.0 per 100,000)
> Population: 69,105
> Largest place in Columbia County: Lake City
Source: usdagov / Flickr
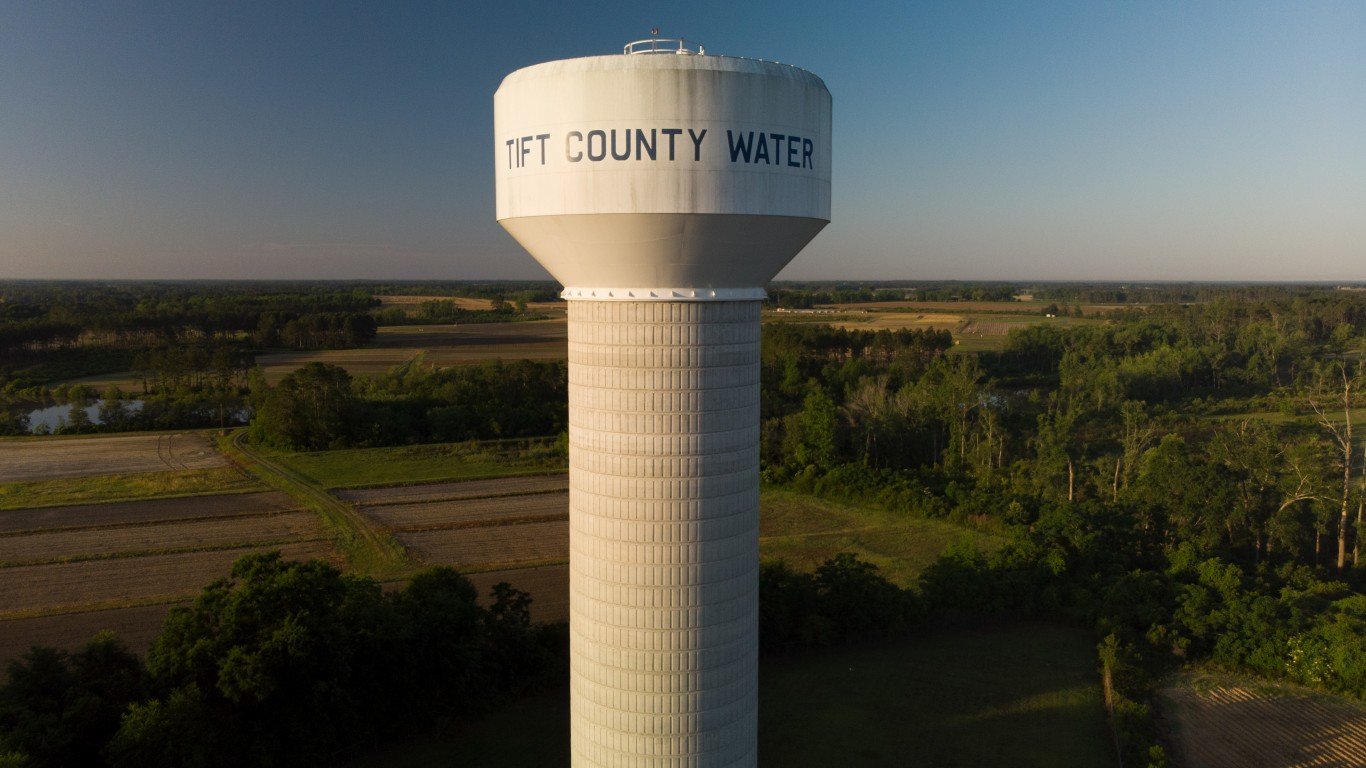
Georgia: Tift County
> Avg. new daily cases in Tift County in week ending Aug 17, 2021: 182.0 per 100,000
> Cumulative confirmed COVID-19 cases in Tift County as of Aug 17, 2021: 6,220 (15,354.2 per 100,000)
> Cumulative confirmed COVID-19 deaths in Tift County as of Aug 17, 2021: 137 (338.2 per 100,000)
> Population: 40,510
> Largest place in Tift County: Tifton

Source: Boogich / iStock via Getty Images
Hawaii: Hawaii County
> Avg. new daily cases in Hawaii County in week ending Aug 17, 2021: 49.7 per 100,000
> Cumulative confirmed COVID-19 cases in Hawaii County as of Aug 17, 2021: 5,589 (2,827.6 per 100,000)
> Cumulative confirmed COVID-19 deaths in Hawaii County as of Aug 17, 2021: 59 (29.8 per 100,000)
> Population: 197,658
> Largest place in Hawaii County: Hilo
These are all the counties in Hawaii where COVID-19 is slowing (and where it’s still getting worse).

Source: ChrisBoswell / iStock via Getty Images
Idaho: Clearwater County
> Avg. new daily cases in Clearwater County in week ending Aug 17, 2021: 62.8 per 100,000
> Cumulative confirmed COVID-19 cases in Clearwater County as of Aug 17, 2021: 1,172 (13,564.8 per 100,000)
> Cumulative confirmed COVID-19 deaths in Clearwater County as of Aug 17, 2021: 16 (185.2 per 100,000)
> Population: 8,640
> Largest place in Clearwater County: Orofino
These are all the counties in Idaho where COVID-19 is slowing (and where it’s still getting worse).

Illinois: Hardin County
> Avg. new daily cases in Hardin County in week ending Aug 17, 2021: 105.9 per 100,000
> Cumulative confirmed COVID-19 cases in Hardin County as of Aug 17, 2021: 449 (11,199.8 per 100,000)
> Cumulative confirmed COVID-19 deaths in Hardin County as of Aug 17, 2021: 12 (299.3 per 100,000)
> Population: 4,009
> Largest place in Hardin County: Rosiclare

Indiana: Huntington County
> Avg. new daily cases in Huntington County in week ending Aug 17, 2021: 98.3 per 100,000
> Cumulative confirmed COVID-19 cases in Huntington County as of Aug 17, 2021: 4,675 (12,851.2 per 100,000)
> Cumulative confirmed COVID-19 deaths in Huntington County as of Aug 17, 2021: 82 (225.4 per 100,000)
> Population: 36,378
> Largest place in Huntington County: Huntington

Source: BOB WESTON / iStock via Getty Images
Iowa: Lee County
> Avg. new daily cases in Lee County in week ending Aug 17, 2021: 72.3 per 100,000
> Cumulative confirmed COVID-19 cases in Lee County as of Aug 17, 2021: 4,321 (12,509.8 per 100,000)
> Cumulative confirmed COVID-19 deaths in Lee County as of Aug 17, 2021: 59 (170.8 per 100,000)
> Population: 34,541
> Largest place in Lee County: Fort Madison
These are all the counties in Iowa where COVID-19 is slowing (and where it’s still getting worse).

Source: thenationalguard / Flickr
Kansas: Bourbon County
> Avg. new daily cases in Bourbon County in week ending Aug 17, 2021: 149.9 per 100,000
> Cumulative confirmed COVID-19 cases in Bourbon County as of Aug 17, 2021: 1,909 (12,984.6 per 100,000)
> Cumulative confirmed COVID-19 deaths in Bourbon County as of Aug 17, 2021: N/A (N/A per 100,000)
> Population: 14,702
> Largest place in Bourbon County: Fort Scott
These are all the counties in Kansas where COVID-19 is slowing (and where it’s still getting worse).

Source: BOB WESTON / iStock via Getty Images
Kentucky: Clay County
> Avg. new daily cases in Clay County in week ending Aug 17, 2021: 134.4 per 100,000
> Cumulative confirmed COVID-19 cases in Clay County as of Aug 17, 2021: 3,372 (16,352.3 per 100,000)
> Cumulative confirmed COVID-19 deaths in Clay County as of Aug 17, 2021: 46 (223.1 per 100,000)
> Population: 20,621
> Largest place in Clay County: Manchester

Louisiana: Lafourche Parish
> Avg. new daily cases in Lafourche Parish in week ending Aug 17, 2021: 192.9 per 100,000
> Cumulative confirmed COVID-19 cases in Lafourche Parish as of Aug 17, 2021: 14,605 (14,870.6 per 100,000)
> Cumulative confirmed COVID-19 deaths in Lafourche Parish as of Aug 17, 2021: 229 (233.2 per 100,000)
> Population: 98,214
> Largest place in Lafourche Parish: Thibodaux

Source: A Janick / iStock via Getty Images
Maine: Waldo County
> Avg. new daily cases in Waldo County in week ending Aug 17, 2021: 41.7 per 100,000
> Cumulative confirmed COVID-19 cases in Waldo County as of Aug 17, 2021: 1,344 (3,409.6 per 100,000)
> Cumulative confirmed COVID-19 deaths in Waldo County as of Aug 17, 2021: 22 (55.8 per 100,000)
> Population: 39,418
> Largest place in Waldo County: Belfast
These are all the counties in Maine where COVID-19 is slowing (and where it’s still getting worse).

Source: Win McNamee / Getty Images News via Getty Images
Maryland: Dorchester County
> Avg. new daily cases in Dorchester County in week ending Aug 17, 2021: 29.5 per 100,000
> Cumulative confirmed COVID-19 cases in Dorchester County as of Aug 17, 2021: 3,045 (9,438.6 per 100,000)
> Cumulative confirmed COVID-19 deaths in Dorchester County as of Aug 17, 2021: 65 (201.5 per 100,000)
> Population: 32,261
> Largest place in Dorchester County: Cambridge

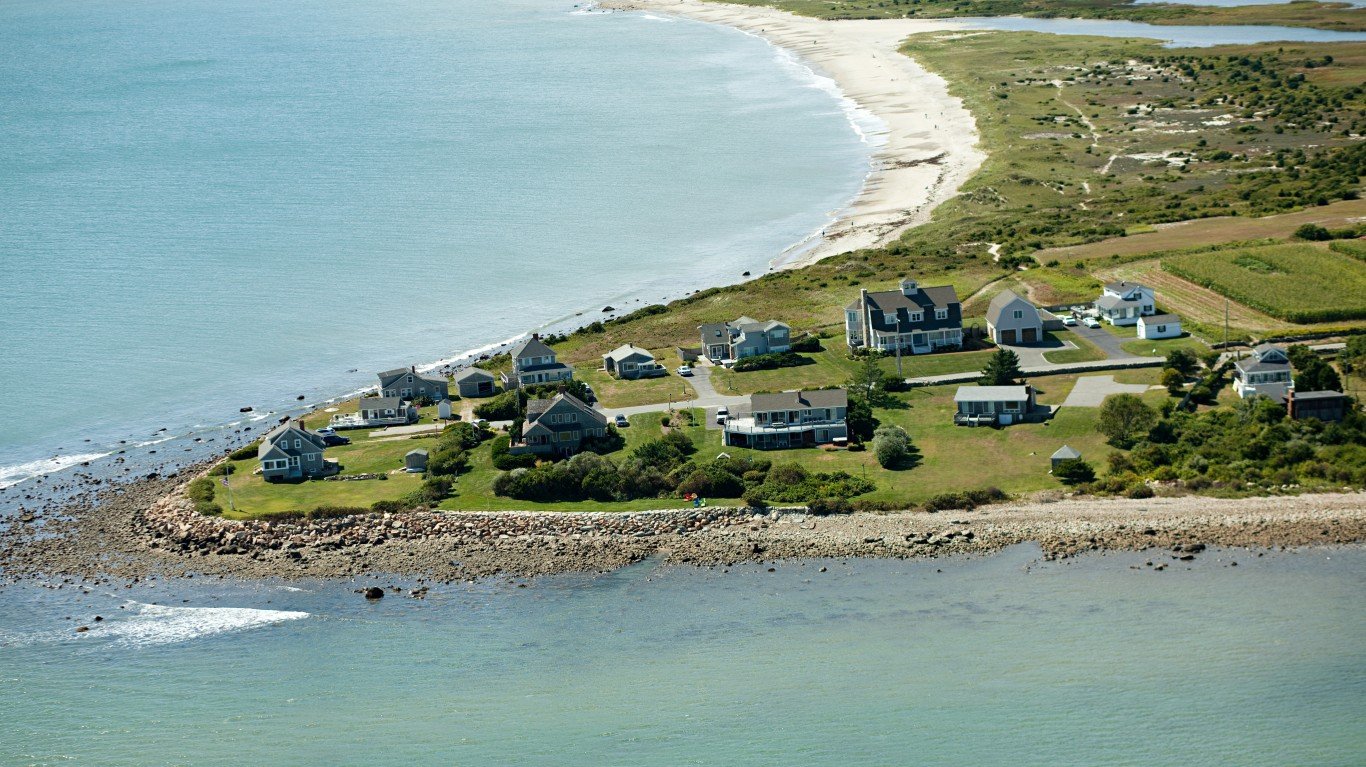
Source: grantreig / iStock via Getty Images
Massachusetts: Nantucket County
> Avg. new daily cases in Nantucket County in week ending Aug 17, 2021: 107.4 per 100,000
> Cumulative confirmed COVID-19 cases in Nantucket County as of Aug 17, 2021: 1,718 (15,476.1 per 100,000)
> Cumulative confirmed COVID-19 deaths in Nantucket County as of Aug 17, 2021: 6 (54.0 per 100,000)
> Population: 11,101
> Largest place in Nantucket County: Nantucket

Michigan: Branch County
> Avg. new daily cases in Branch County in week ending Aug 17, 2021: 38.0 per 100,000
> Cumulative confirmed COVID-19 cases in Branch County as of Aug 17, 2021: 5,274 (12,100.8 per 100,000)
> Cumulative confirmed COVID-19 deaths in Branch County as of Aug 17, 2021: 98 (224.9 per 100,000)
> Population: 43,584
> Largest place in Branch County: Coldwater

Source: akaplummer / iStock via Getty Images
Minnesota: Dodge County
> Avg. new daily cases in Dodge County in week ending Aug 17, 2021: 34.9 per 100,000
> Cumulative confirmed COVID-19 cases in Dodge County as of Aug 17, 2021: 2,003 (9,731.8 per 100,000)
> Cumulative confirmed COVID-19 deaths in Dodge County as of Aug 17, 2021: 3 (14.6 per 100,000)
> Population: 20,582
> Largest place in Dodge County: Kasson

Source: BOB WESTON / Getty Images
Mississippi: Neshoba County
> Avg. new daily cases in Neshoba County in week ending Aug 17, 2021: 271.9 per 100,000
> Cumulative confirmed COVID-19 cases in Neshoba County as of Aug 17, 2021: 5,263 (17,916.0 per 100,000)
> Cumulative confirmed COVID-19 deaths in Neshoba County as of Aug 17, 2021: 182 (619.6 per 100,000)
> Population: 29,376
> Largest place in Neshoba County: Philadelphia
Source: BOB WESTON / iStock via Getty Images
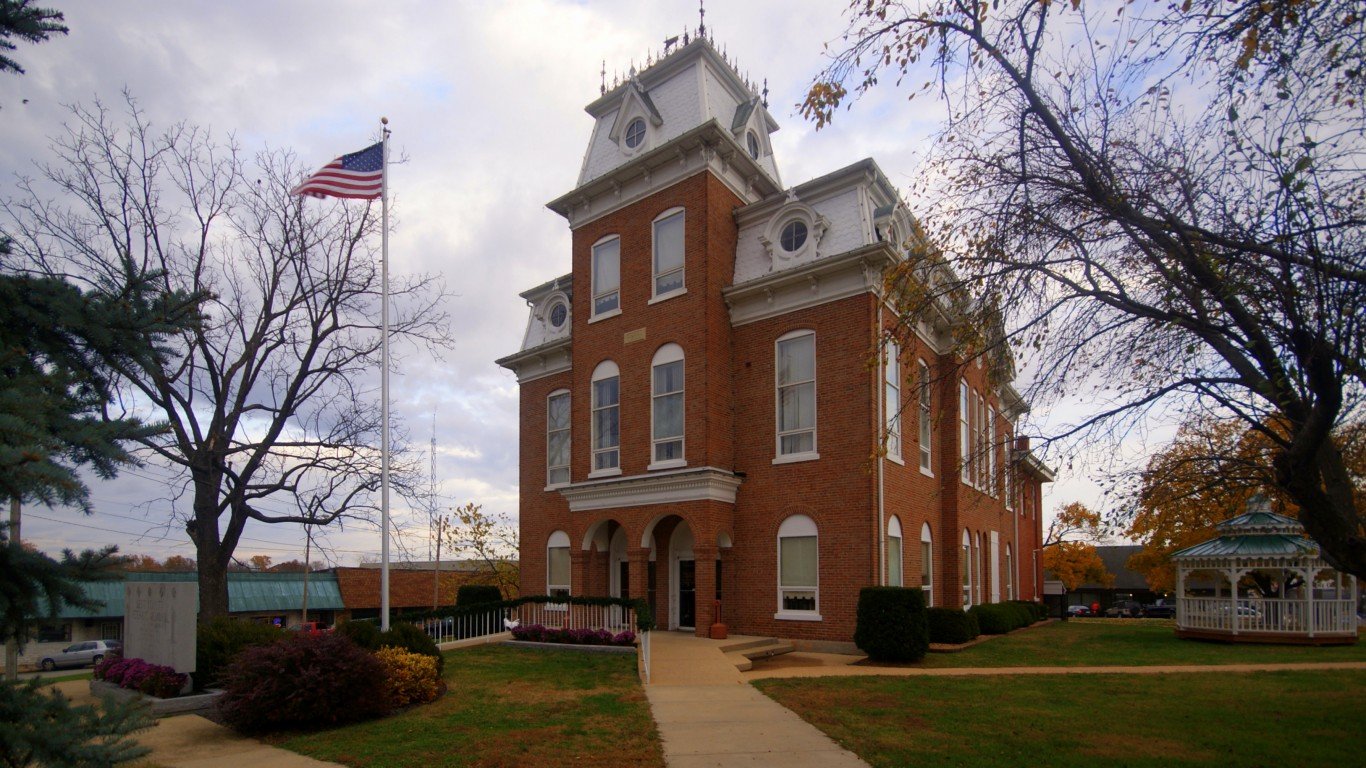
Missouri: Dent County
> Avg. new daily cases in Dent County in week ending Aug 17, 2021: 105.4 per 100,000
> Cumulative confirmed COVID-19 cases in Dent County as of Aug 17, 2021: 1,461 (9,423.4 per 100,000)
> Cumulative confirmed COVID-19 deaths in Dent County as of Aug 17, 2021: 22 (141.9 per 100,000)
> Population: 15,504
> Largest place in Dent County: Salem
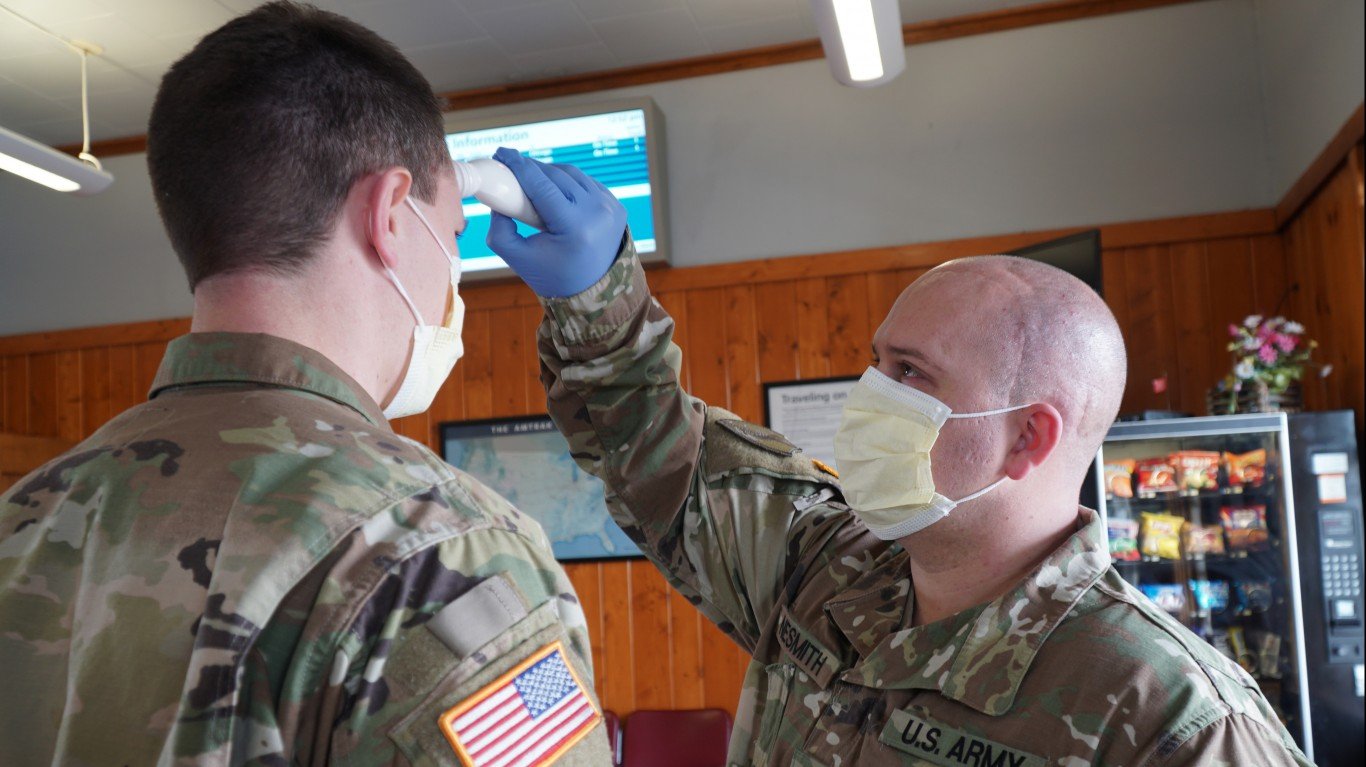
Source: thenationalguard / Flickr
Montana: Liberty County
> Avg. new daily cases in Liberty County in week ending Aug 17, 2021: 52.8 per 100,000
> Cumulative confirmed COVID-19 cases in Liberty County as of Aug 17, 2021: 134 (5,877.2 per 100,000)
> Cumulative confirmed COVID-19 deaths in Liberty County as of Aug 17, 2021: 1 (43.9 per 100,000)
> Population: 2,280
> Largest place in Liberty County: Chester
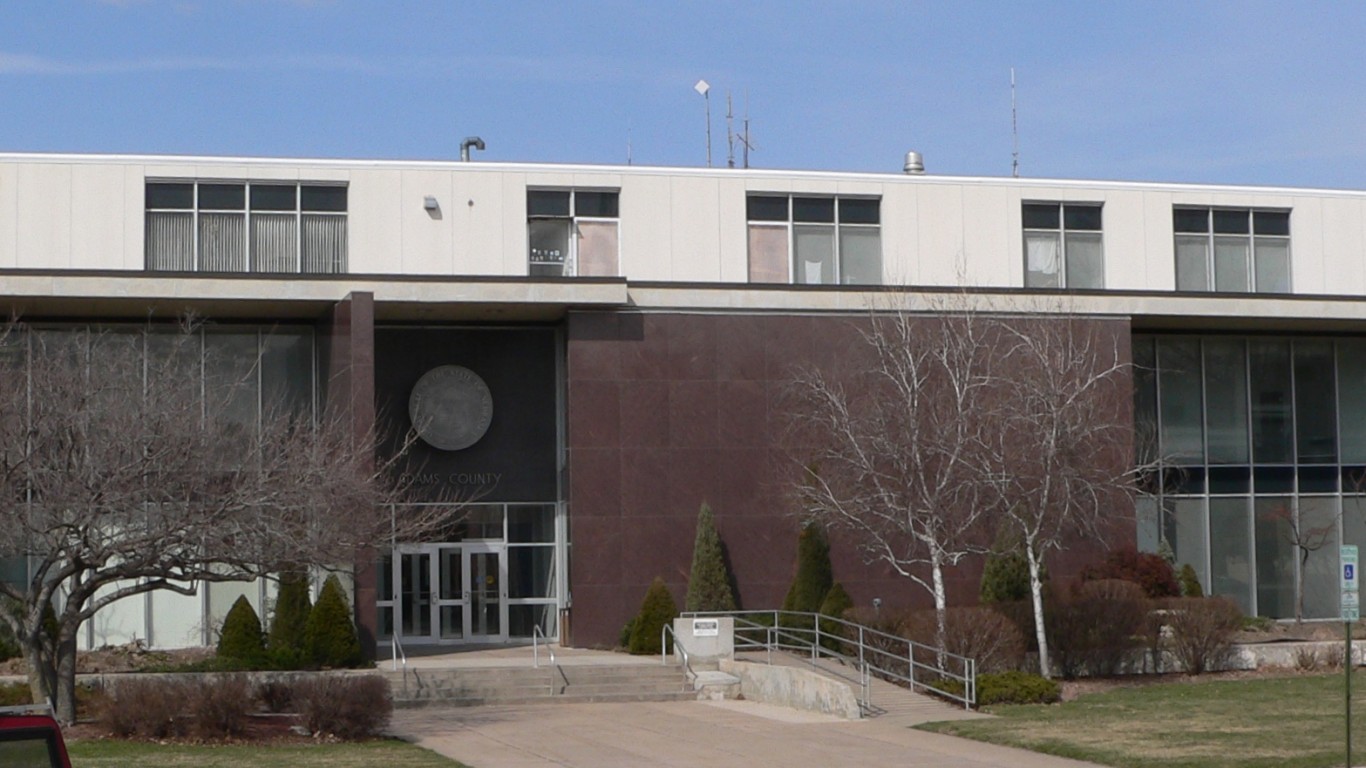
Source: Public Domain / Wikimedia Commons
Nebraska: Adams County
> Avg. new daily cases in Adams County in week ending Aug 17, 2021: 0.0 per 100,000
> Cumulative confirmed COVID-19 cases in Adams County as of Aug 17, 2021: 2,993 (9,476.6 per 100,000)
> Cumulative confirmed COVID-19 deaths in Adams County as of Aug 17, 2021: 46 (145.6 per 100,000)
> Population: 31,583
> Largest place in Adams County: Hastings

Nevada: Lyon County
> Avg. new daily cases in Lyon County in week ending Aug 17, 2021: 58.8 per 100,000
> Cumulative confirmed COVID-19 cases in Lyon County as of Aug 17, 2021: 3,934 (7,401.0 per 100,000)
> Cumulative confirmed COVID-19 deaths in Lyon County as of Aug 17, 2021: 70 (131.7 per 100,000)
> Population: 53,155
> Largest place in Lyon County: Fernley
These are all the counties in Nevada where COVID-19 is slowing (and where it’s still getting worse).

Source: BOB WESTON / Getty Images
New Hampshire: Coos County
> Avg. new daily cases in Coos County in week ending Aug 17, 2021: 20.1 per 100,000
> Cumulative confirmed COVID-19 cases in Coos County as of Aug 17, 2021: 2,171 (6,776.3 per 100,000)
> Cumulative confirmed COVID-19 deaths in Coos County as of Aug 17, 2021: 45 (140.5 per 100,000)
> Population: 32,038
> Largest place in Coos County: Berlin
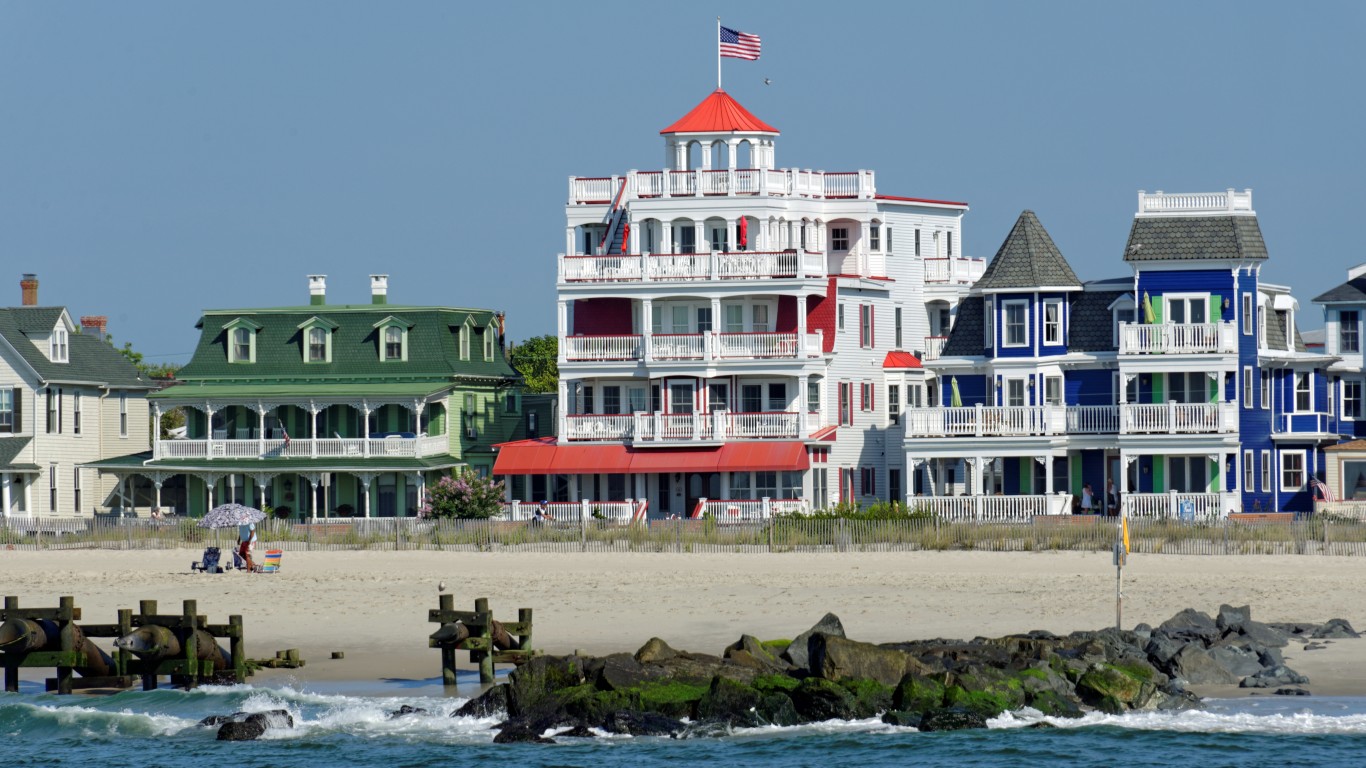
Source: sparhawk4242 / Getty Images
New Jersey: Cape May County
> Avg. new daily cases in Cape May County in week ending Aug 17, 2021: 36.1 per 100,000
> Cumulative confirmed COVID-19 cases in Cape May County as of Aug 17, 2021: 9,948 (10,616.3 per 100,000)
> Cumulative confirmed COVID-19 deaths in Cape May County as of Aug 17, 2021: 210 (224.1 per 100,000)
> Population: 93,705
> Largest place in Cape May County: Ocean City

Source: BOB WESTON / iStock via Getty Images
New Mexico: Lea County
> Avg. new daily cases in Lea County in week ending Aug 17, 2021: 107.8 per 100,000
> Cumulative confirmed COVID-19 cases in Lea County as of Aug 17, 2021: 9,817 (13,999.1 per 100,000)
> Cumulative confirmed COVID-19 deaths in Lea County as of Aug 17, 2021: 205 (292.3 per 100,000)
> Population: 70,126
> Largest place in Lea County: Hobbs

Source: DebraMillet / Getty Images
New York: Hamilton County
> Avg. new daily cases in Hamilton County in week ending Aug 17, 2021: 36.6 per 100,000
> Cumulative confirmed COVID-19 cases in Hamilton County as of Aug 17, 2021: 335 (7,322.4 per 100,000)
> Cumulative confirmed COVID-19 deaths in Hamilton County as of Aug 17, 2021: 2 (43.7 per 100,000)
> Population: 4,575
> Largest place in Hamilton County: Speculator

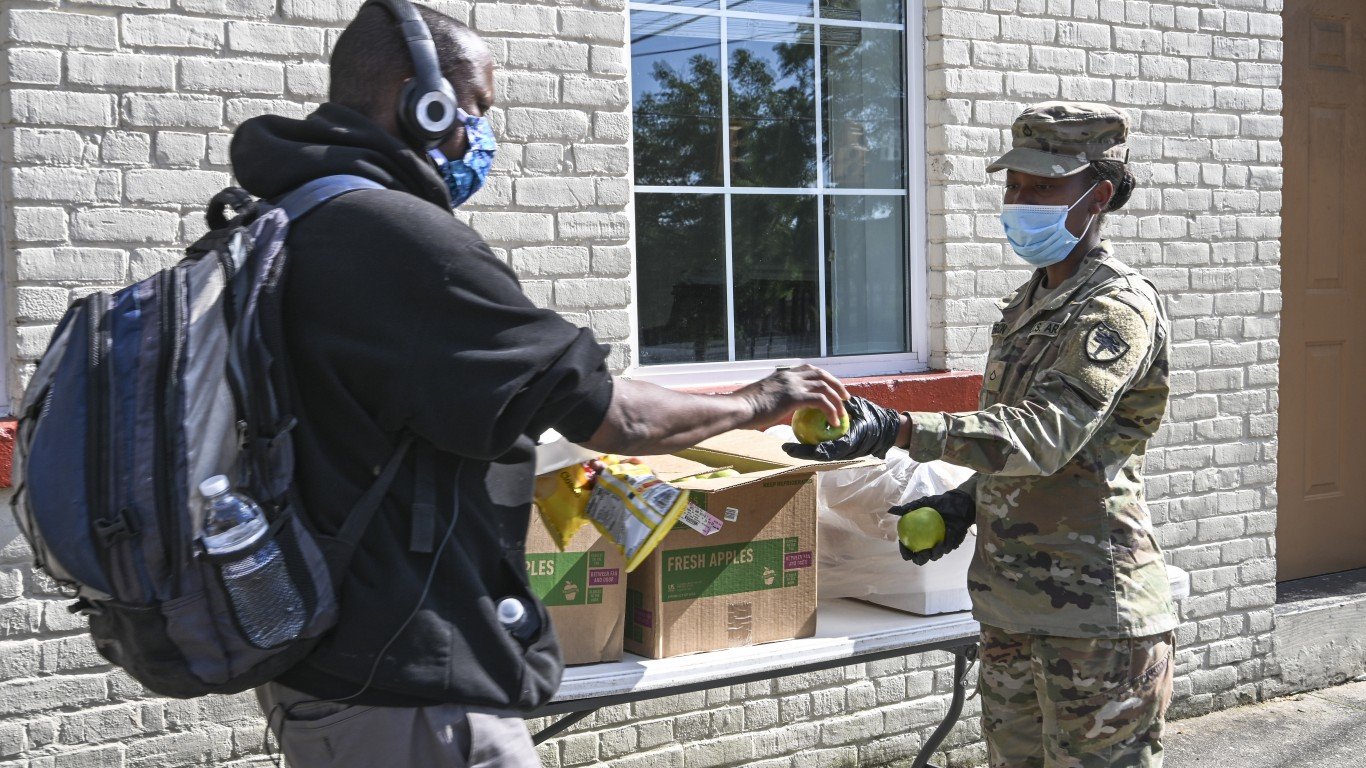
Source: thenationalguard / Flickr
North Carolina: Cherokee County
> Avg. new daily cases in Cherokee County in week ending Aug 17, 2021: 91.4 per 100,000
> Cumulative confirmed COVID-19 cases in Cherokee County as of Aug 17, 2021: 3,034 (10,965.7 per 100,000)
> Cumulative confirmed COVID-19 deaths in Cherokee County as of Aug 17, 2021: 39 (141.0 per 100,000)
> Population: 27,668
> Largest place in Cherokee County: Andrews

North Dakota: Mountrail County
> Avg. new daily cases in Mountrail County in week ending Aug 17, 2021: 25.1 per 100,000
> Cumulative confirmed COVID-19 cases in Mountrail County as of Aug 17, 2021: 1,447 (14,253.3 per 100,000)
> Cumulative confirmed COVID-19 deaths in Mountrail County as of Aug 17, 2021: 18 (177.3 per 100,000)
> Population: 10,152
> Largest place in Mountrail County: Stanley

Ohio: Scioto County
> Avg. new daily cases in Scioto County in week ending Aug 17, 2021: 53.4 per 100,000
> Cumulative confirmed COVID-19 cases in Scioto County as of Aug 17, 2021: 7,399 (9,687.5 per 100,000)
> Cumulative confirmed COVID-19 deaths in Scioto County as of Aug 17, 2021: 109 (142.7 per 100,000)
> Population: 76,377
> Largest place in Scioto County: Portsmouth
These are all the counties in Ohio where COVID-19 is slowing (and where it’s still getting worse).

Source: Omnedon, Public domain, via Wikimedia Commons
Oklahoma: Adair County
> Avg. new daily cases in Adair County in week ending Aug 17, 2021: 105.3 per 100,000
> Cumulative confirmed COVID-19 cases in Adair County as of Aug 17, 2021: 3,776 (17,075.9 per 100,000)
> Cumulative confirmed COVID-19 deaths in Adair County as of Aug 17, 2021: 46 (208.0 per 100,000)
> Population: 22,113
> Largest place in Adair County: Stilwell

Oregon: Morrow County
> Avg. new daily cases in Morrow County in week ending Aug 17, 2021: 114.3 per 100,000
> Cumulative confirmed COVID-19 cases in Morrow County as of Aug 17, 2021: 1,377 (12,278.2 per 100,000)
> Cumulative confirmed COVID-19 deaths in Morrow County as of Aug 17, 2021: 18 (160.5 per 100,000)
> Population: 11,215
> Largest place in Morrow County: Boardman
These are all the counties in Oregon where COVID-19 is slowing (and where it’s still getting worse).

Pennsylvania: Northampton County
> Avg. new daily cases in Northampton County in week ending Aug 17, 2021: 21.5 per 100,000
> Cumulative confirmed COVID-19 cases in Northampton County as of Aug 17, 2021: 37,359 (12,379.6 per 100,000)
> Cumulative confirmed COVID-19 deaths in Northampton County as of Aug 17, 2021: 723 (239.6 per 100,000)
> Population: 301,778
> Largest place in Northampton County: Bethlehem
Source: Image Source / Getty Images
Rhode Island: Newport County
> Avg. new daily cases in Newport County in week ending Aug 17, 2021: 22.5 per 100,000
> Cumulative confirmed COVID-19 cases in Newport County as of Aug 17, 2021: 7,309 (8,798.1 per 100,000)
> Cumulative confirmed COVID-19 deaths in Newport County as of Aug 17, 2021: N/A (N/A per 100,000)
> Population: 83,075
> Largest place in Newport County: Newport
Source: thenationalguard / Flickr
South Carolina: Dorchester County
> Avg. new daily cases in Dorchester County in week ending Aug 17, 2021: 93.1 per 100,000
> Cumulative confirmed COVID-19 cases in Dorchester County as of Aug 17, 2021: 21,488 (13,821.0 per 100,000)
> Cumulative confirmed COVID-19 deaths in Dorchester County as of Aug 17, 2021: 236 (151.8 per 100,000)
> Population: 155,474
> Largest place in Dorchester County: North Charleston

Source: Michael Ciaglo / Getty Images
South Dakota: Dewey County
> Avg. new daily cases in Dewey County in week ending Aug 17, 2021: 50.9 per 100,000
> Cumulative confirmed COVID-19 cases in Dewey County as of Aug 17, 2021: 1,531 (26,492.5 per 100,000)
> Cumulative confirmed COVID-19 deaths in Dewey County as of Aug 17, 2021: 29 (501.8 per 100,000)
> Population: 5,779
> Largest place in Dewey County: North Eagle Butte

Source: thenationalguard / Flickr
Tennessee: Crockett County
> Avg. new daily cases in Crockett County in week ending Aug 17, 2021: 123.7 per 100,000
> Cumulative confirmed COVID-19 cases in Crockett County as of Aug 17, 2021: 2,406 (16,594.2 per 100,000)
> Cumulative confirmed COVID-19 deaths in Crockett County as of Aug 17, 2021: 52 (358.6 per 100,000)
> Population: 14,499
> Largest place in Crockett County: Bells
Source: milehightraveler / iStock via Getty Images
Texas: Cameron County
> Avg. new daily cases in Cameron County in week ending Aug 17, 2021: 275.1 per 100,000
> Cumulative confirmed COVID-19 cases in Cameron County as of Aug 17, 2021: 55,180 (13,083.6 per 100,000)
> Cumulative confirmed COVID-19 deaths in Cameron County as of Aug 17, 2021: 1,731 (410.4 per 100,000)
> Population: 421,750
> Largest place in Cameron County: Brownsville
These are all the counties in Texas where COVID-19 is slowing (and where it’s still getting worse).

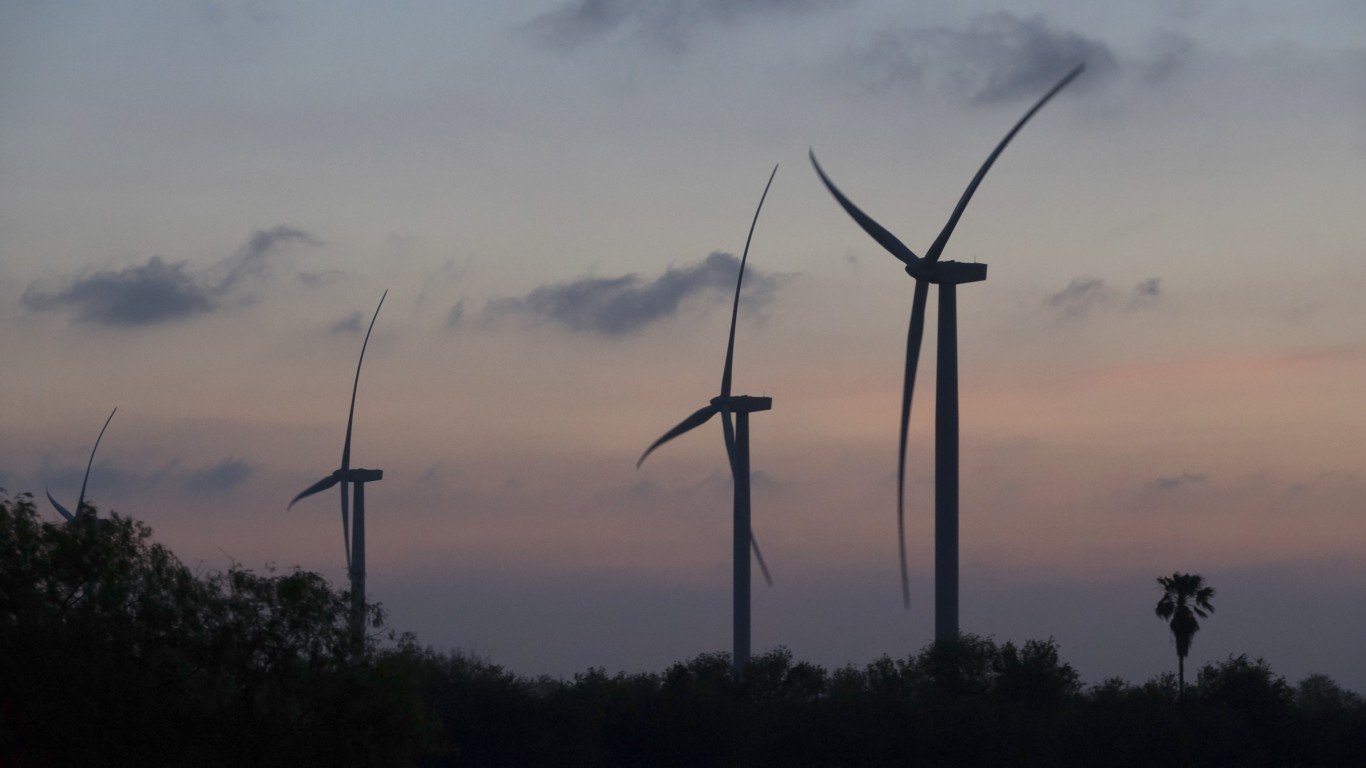
Source: Robert_Ford / iStock via Getty Images
Utah: Millard County
> Avg. new daily cases in Millard County in week ending Aug 17, 2021: 47.1 per 100,000
> Cumulative confirmed COVID-19 cases in Millard County as of Aug 17, 2021: 1,628 (12,785.7 per 100,000)
> Cumulative confirmed COVID-19 deaths in Millard County as of Aug 17, 2021: 17 (133.5 per 100,000)
> Population: 12,733
> Largest place in Millard County: Delta
These are all the counties in Utah where COVID-19 is slowing (and where it’s still getting worse).

Source: hstiver / Getty Images
Vermont: Chittenden County
> Avg. new daily cases in Chittenden County in week ending Aug 17, 2021: 23.5 per 100,000
> Cumulative confirmed COVID-19 cases in Chittenden County as of Aug 17, 2021: 8,206 (5,063.8 per 100,000)
> Cumulative confirmed COVID-19 deaths in Chittenden County as of Aug 17, 2021: 108 (66.6 per 100,000)
> Population: 162,052
> Largest place in Chittenden County: Burlington

Source: Tim Pennington / iStock via Getty Images
Virginia: Wythe County
> Avg. new daily cases in Wythe County in week ending Aug 17, 2021: 58.2 per 100,000
> Cumulative confirmed COVID-19 cases in Wythe County as of Aug 17, 2021: 3,006 (10,387.0 per 100,000)
> Cumulative confirmed COVID-19 deaths in Wythe County as of Aug 17, 2021: 82 (283.3 per 100,000)
> Population: 28,940
> Largest place in Wythe County: Wytheville

Washington: Franklin County
> Avg. new daily cases in Franklin County in week ending Aug 17, 2021: 79.2 per 100,000
> Cumulative confirmed COVID-19 cases in Franklin County as of Aug 17, 2021: 14,801 (16,325.8 per 100,000)
> Cumulative confirmed COVID-19 deaths in Franklin County as of Aug 17, 2021: 128 (141.2 per 100,000)
> Population: 90,660
> Largest place in Franklin County: Pasco

Source: BackyardProduction / iStock Editorial via Getty Images
West Virginia: Upshur County
> Avg. new daily cases in Upshur County in week ending Aug 17, 2021: 66.1 per 100,000
> Cumulative confirmed COVID-19 cases in Upshur County as of Aug 17, 2021: 2,198 (8,933.1 per 100,000)
> Cumulative confirmed COVID-19 deaths in Upshur County as of Aug 17, 2021: 35 (142.2 per 100,000)
> Population: 24,605
> Largest place in Upshur County: Buckhannon

Source: Sean Pavone / iStock via Getty Images
Wisconsin: Milwaukee County
> Avg. new daily cases in Milwaukee County in week ending Aug 17, 2021: 33.3 per 100,000
> Cumulative confirmed COVID-19 cases in Milwaukee County as of Aug 17, 2021: 125,408 (13,142.6 per 100,000)
> Cumulative confirmed COVID-19 deaths in Milwaukee County as of Aug 17, 2021: 1,441 (151.0 per 100,000)
> Population: 954,209
> Largest place in Milwaukee County: Milwaukee

Wyoming: Carbon County
> Avg. new daily cases in Carbon County in week ending Aug 17, 2021: 60.1 per 100,000
> Cumulative confirmed COVID-19 cases in Carbon County as of Aug 17, 2021: 1,895 (12,244.0 per 100,000)
> Cumulative confirmed COVID-19 deaths in Carbon County as of Aug 17, 2021: 25 (161.5 per 100,000)
> Population: 15,477
> Largest place in Carbon County: Rawlins
Click here to see all coronavirus data for every state.
Sponsored: Attention Savvy Investors: Speak to 3 Financial Experts – FREE
Ever wanted an extra set of eyes on an investment you’re considering? Now you can speak with up to 3 financial experts in your area for FREE. By simply
clicking here you can begin to match with financial professionals who can help guide you through the financial decisions you’re making. And the best part? The first conversation with them is free.
Click here to match with up to 3 financial pros who would be excited to help you make financial decisions.
Thank you for reading! Have some feedback for us?
Contact the 24/7 Wall St. editorial team.
Editors' Picks


