
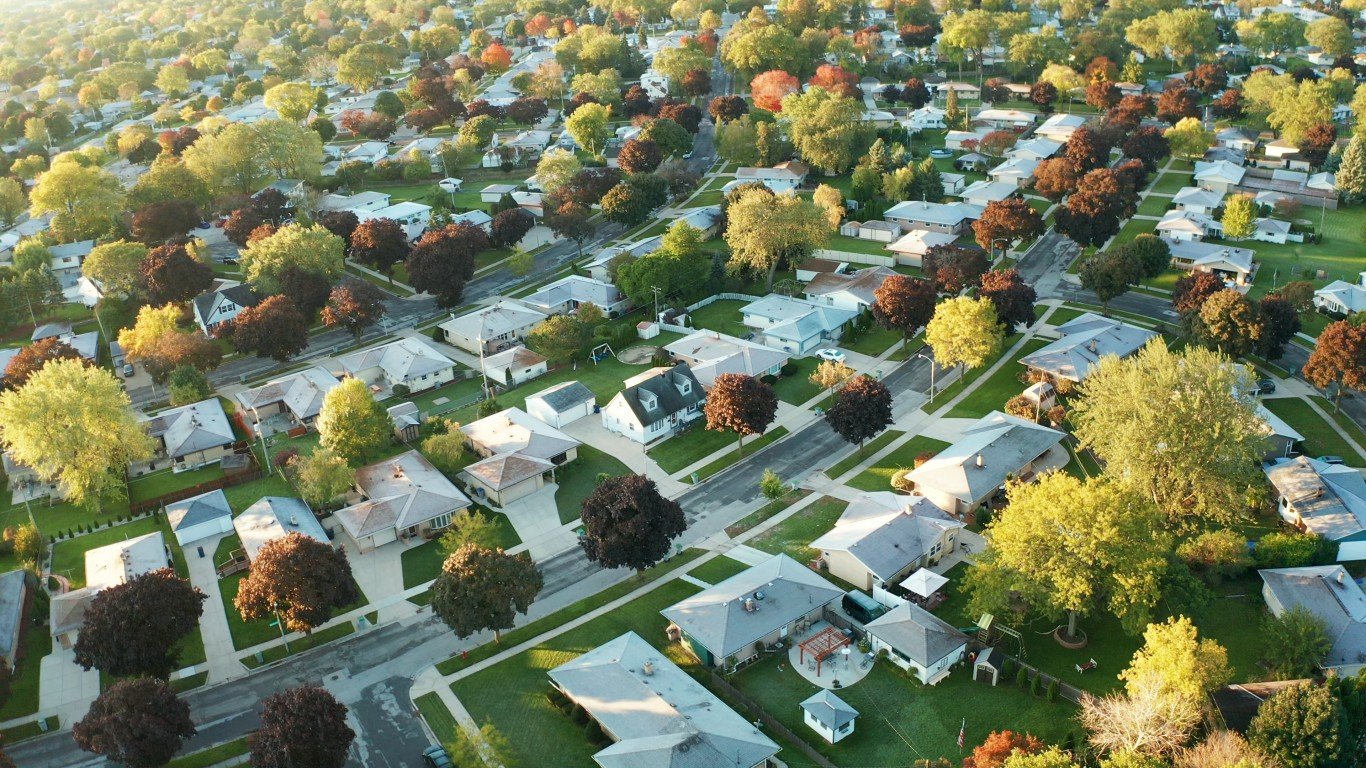
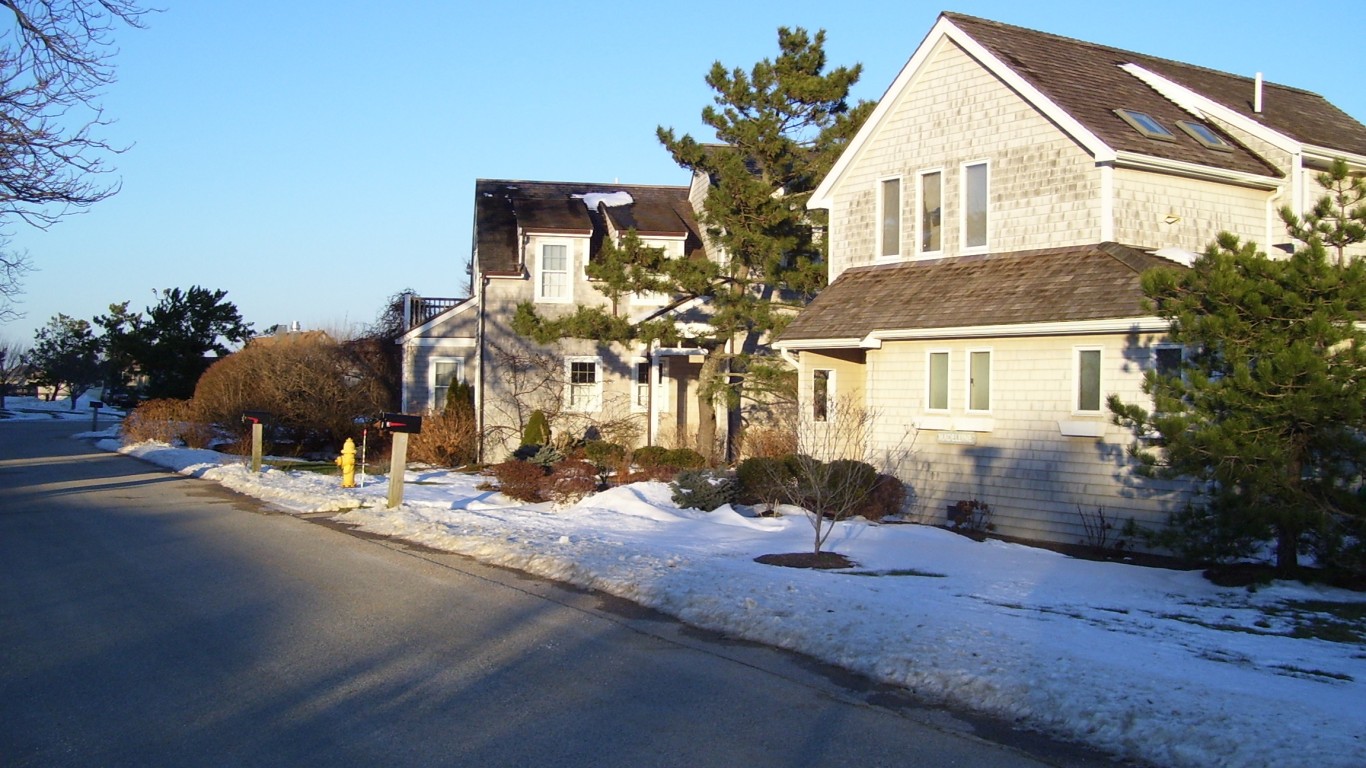
Home values have soared over the past year. In many markets, home prices have risen by double digits. The widely followed S&P Case-Shiller real estate index, which measures home prices in major metropolitan areas nationwide, showed home prices hit a record high annual gain of 19.7% in July.
Home price increases have been driven by people leaving the largest cities because of the COVID-19 pandemic. Other drivers include solid middle- and upper-class incomes and low mortgage rates. The value of home equity for the average homeowner nationwide rose by $51,500 in the second quarter of 2021 compared with the same period a year ago. Nationwide, home equity rose 29.3%, or nearly $2.9 trillion, according to CoreLogic. The state where home equity rose the most was California.
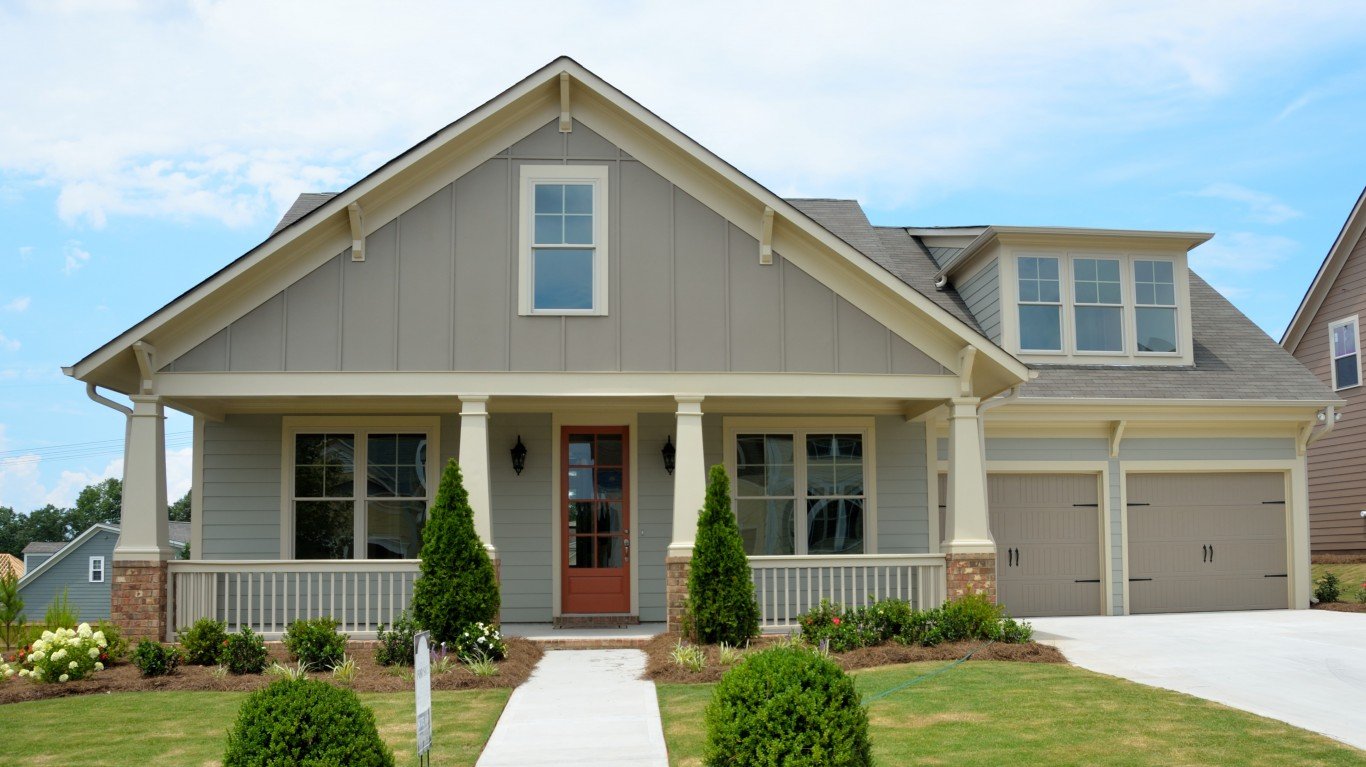
CoreLogic’s researchers commented that consumer confidence in June 2021 had risen to its highest level since the pandemic struck. They added that thanks to the different government programs, vaccines, and home equity gains, homeowners are in a better position to remain current on their mortgage payments. Further, “the majority of borrowers that fell behind on payments have a large home equity cushion that will help them avoid foreclosure.”
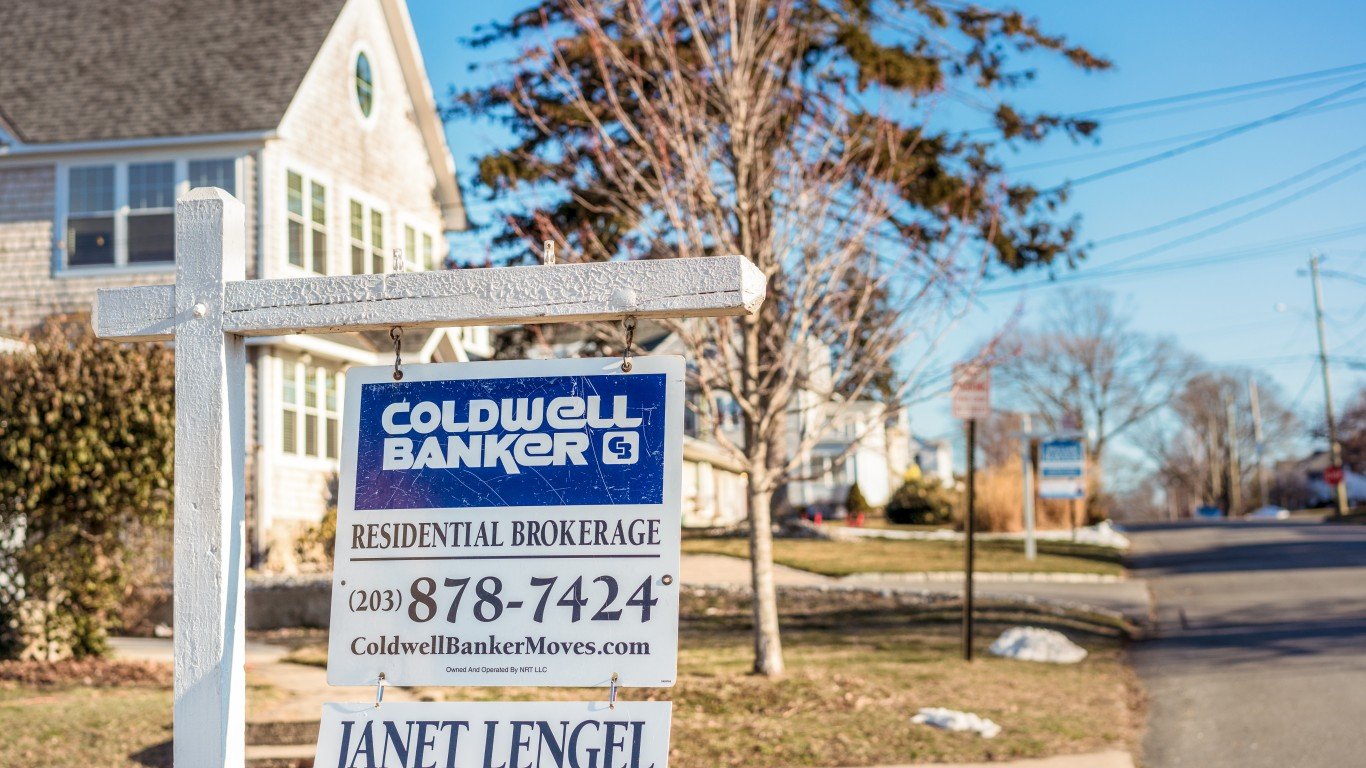
To determine the states where people are getting rich on their homes, 24/7 Wall St. reviewed data from property data provider CoreLogic’s Homeowner Equity Insights report. States were ranked on their average equity gain for the second quarter of 2021. Data was not available for Mississippi, South Dakota, Vermont, and West Virginia.
The state where home equity rose the most was California at $116,300. Washington and Idaho had the second and third largest average equity gains at $102,900 and $97,000, respectively. Western states, in general, experienced the highest increases in home equity, while states in the Midwest the lowest.
Just like it did in the first quarter, the state that did the worst was North Dakota, where home equity rose only $10,600. These are the states with highest homeownership.
It remains to be seen what will happen to home equity for the balance of the year. For now, however, with home equity rising, the number of homeowners nationwide with negative equity — those who owe more on their home than it is worth — is decreasing, falling in the second quarter by 12% year over year. These are the most at risk housing markets.
Click here to see the state where people are getting rich on their homes
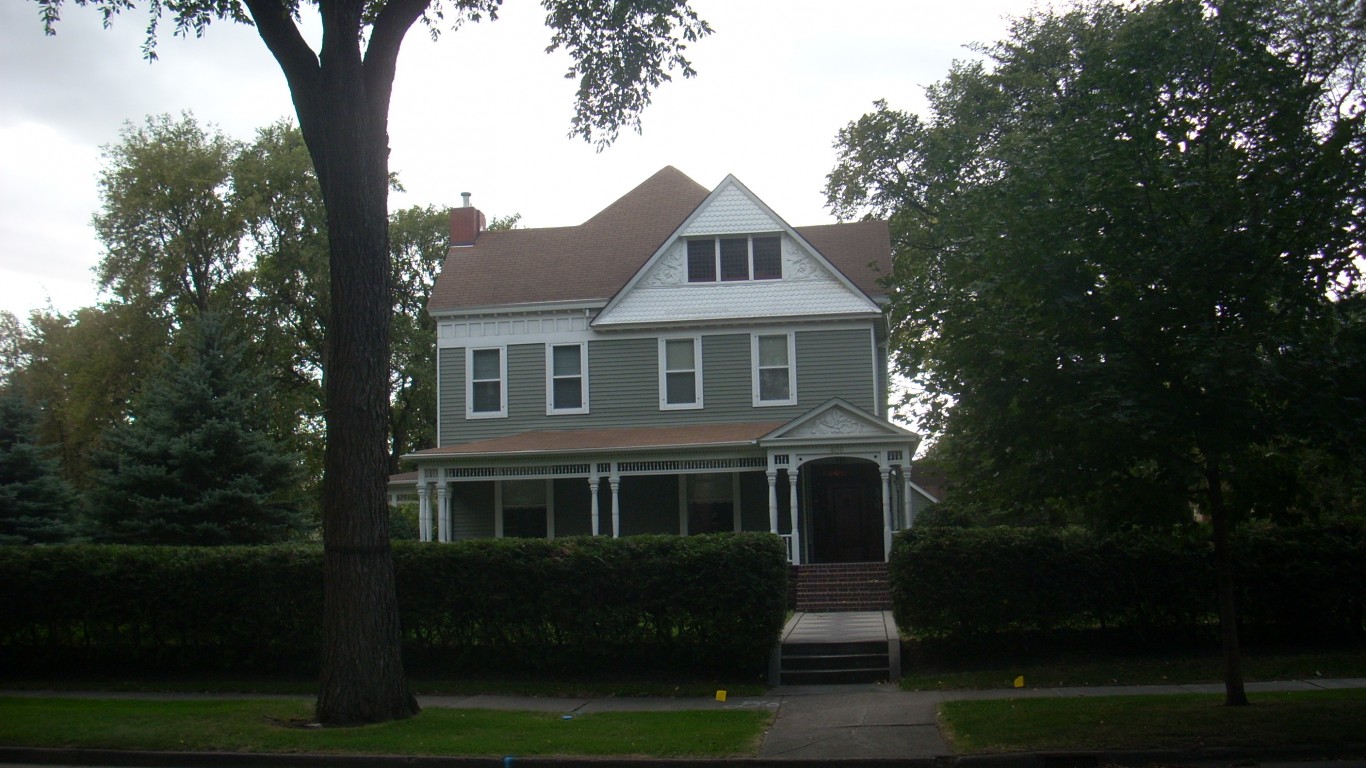
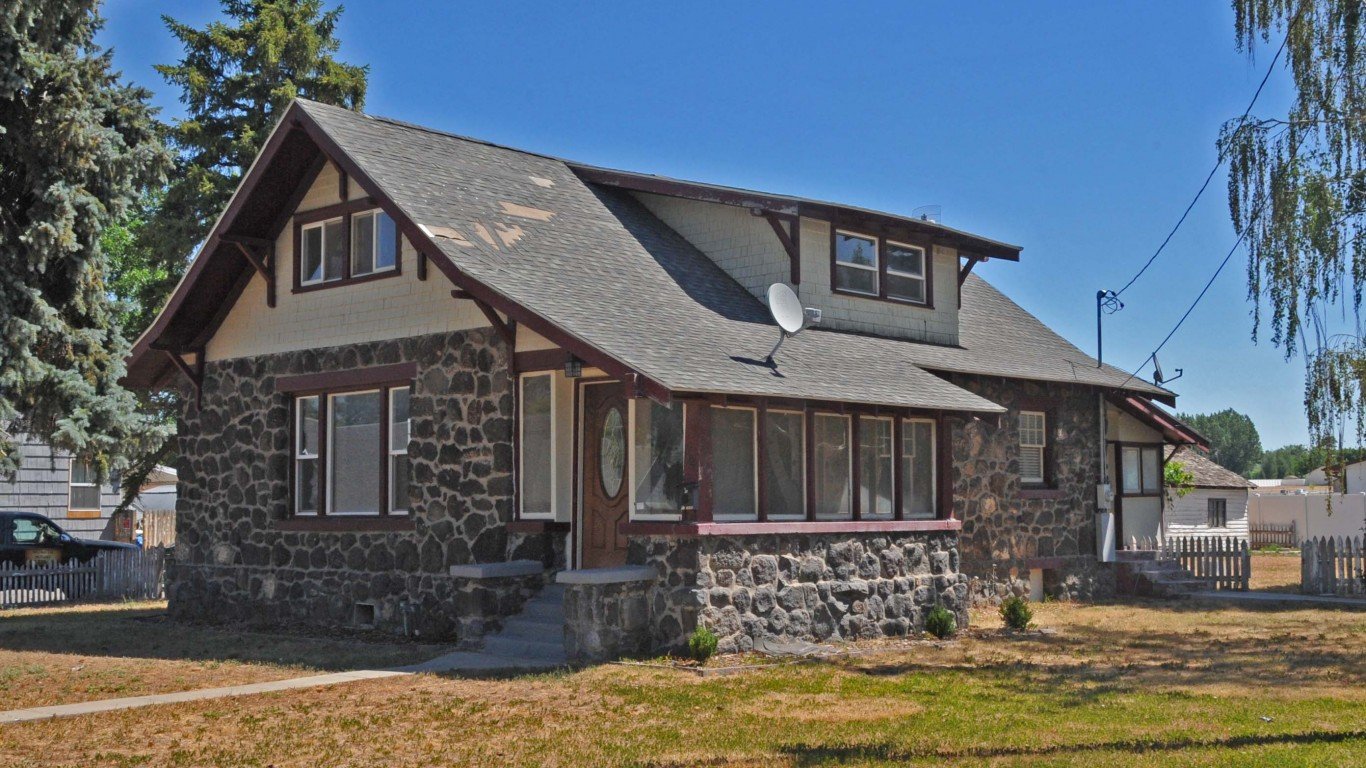
Source: https://commons.m.wikimedia.org/wiki/File:George_B._Clifford_House,_Grand_Forks_North_Dakota.jpg
46. North Dakota
> Avg. equity gain, 12 months through Q2 2021: +$10,600
> Median household income: $64,577 (20th highest)
> Median home listing price: $254,950 (13th lowest)
> Pct. of homeowners who owe more than their home is worth: 3.8% (6th most)
[in-text-ad]

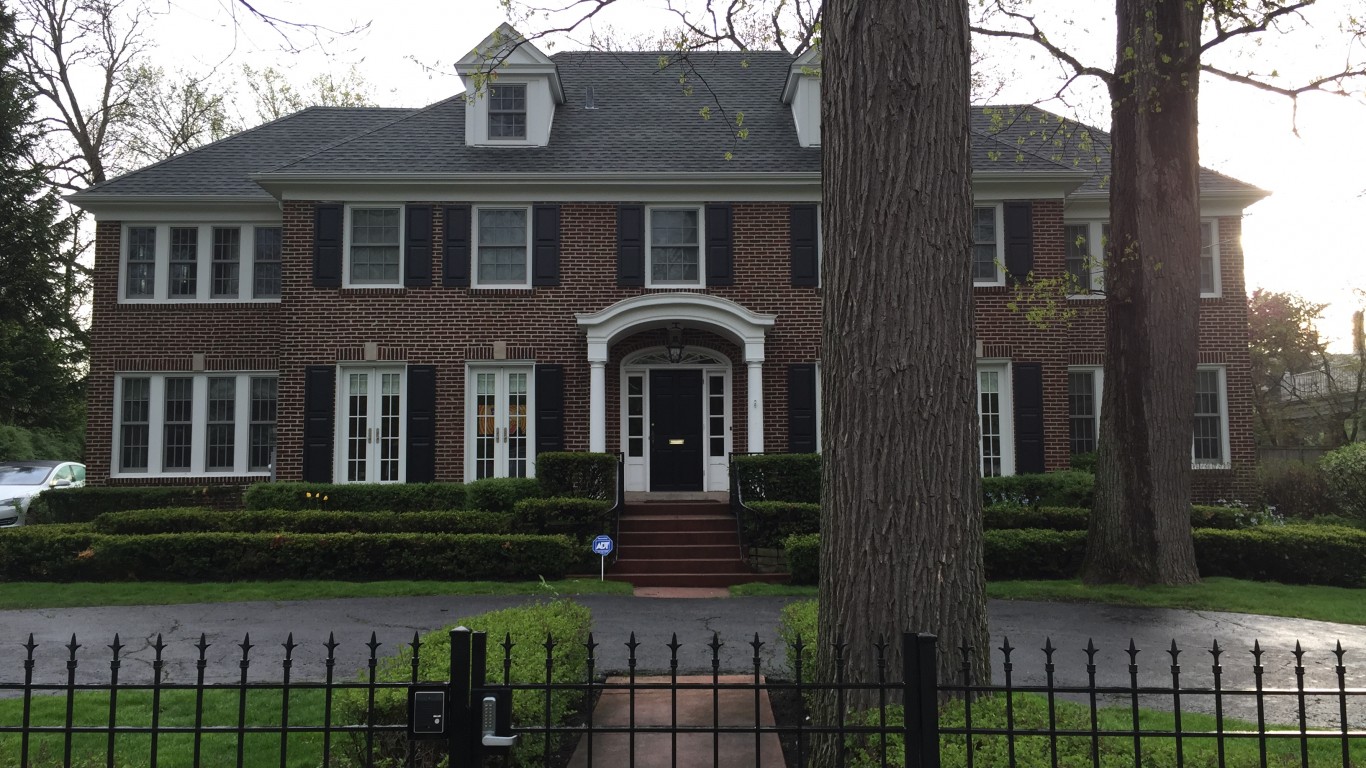
Source: NNehring / Getty Images
45. Iowa
> Avg. equity gain, 12 months through Q2 2021: +$15,000
> Median household income: $61,691 (21st lowest)
> Median home listing price: $219,500 (4th lowest)
> Pct. of homeowners who owe more than their home is worth: 5.2% (2nd most)

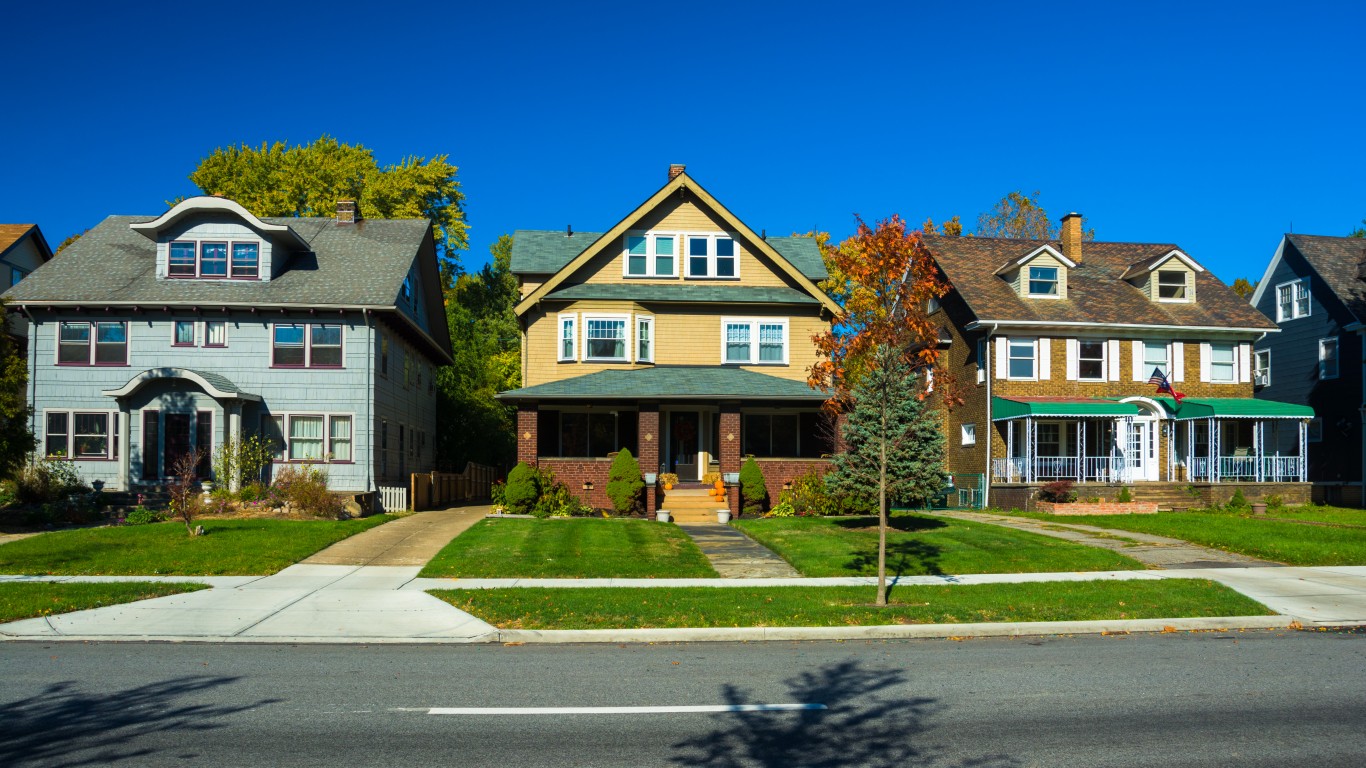
Source: disorderly / Getty Images
44. Oklahoma
> Avg. equity gain, 12 months through Q2 2021: +$17,000
> Median household income: $54,449 (8th lowest)
> Median home listing price: $234,461 (8th lowest)
> Pct. of homeowners who owe more than their home is worth: 4.4% (4th most)

Source: jnatkin / Getty Images
43. Kentucky
> Avg. equity gain, 12 months through Q2 2021: +$20,000
> Median household income: $52,295 (7th lowest)
> Median home listing price: $249,000 (11th lowest)
> Pct. of homeowners who owe more than their home is worth: 3.6% (8th most)
[in-text-ad-2]

Source: Wonderlane / Wikimedia Commons
42. Alaska
> Avg. equity gain, 12 months through Q2 2021: +$20,000
> Median household income: $75,463 (12th highest)
> Median home listing price: $342,250 (25th lowest)
> Pct. of homeowners who owe more than their home is worth: 1.4% (14th least)

Source: SeanPavonePhoto / Getty Images
41. Louisiana
> Avg. equity gain, 12 months through Q2 2021: +$22,000
> Median household income: $51,073 (4th lowest)
> Median home listing price: $269,900 (16th lowest)
> Pct. of homeowners who owe more than their home is worth: 7.8% (the most)
[in-text-ad]
Source: Famartin / Wikimedia Commons
40. Illinois
> Avg. equity gain, 12 months through Q2 2021: +$24,000
> Median household income: $69,187 (17th highest)
> Median home listing price: $259,900 (14th lowest)
> Pct. of homeowners who owe more than their home is worth: 4.7% (3rd most)

Source: BlazenImages / Getty Images
39. Arkansas
> Avg. equity gain, 12 months through Q2 2021: +$24,000
> Median household income: $48,952 (3rd lowest)
> Median home listing price: $229,950 (5th lowest)
> Pct. of homeowners who owe more than their home is worth: 4.1% (5th most)
Source: Davel5957 / Getty Images
38. Ohio
> Avg. equity gain, 12 months through Q2 2021: +$26,000
> Median household income: $58,642 (15th lowest)
> Median home listing price: $203,900 (2nd lowest)
> Pct. of homeowners who owe more than their home is worth: 2.7% (13th most)
[in-text-ad-2]

Source: Kruck20 / iStock via Getty Images
37. Alabama
> Avg. equity gain, 12 months through Q2 2021: +$26,000
> Median household income: $51,734 (5th lowest)
> Median home listing price: $278,648 (18th lowest)
> Pct. of homeowners who owe more than their home is worth: 2.5% (18th most)
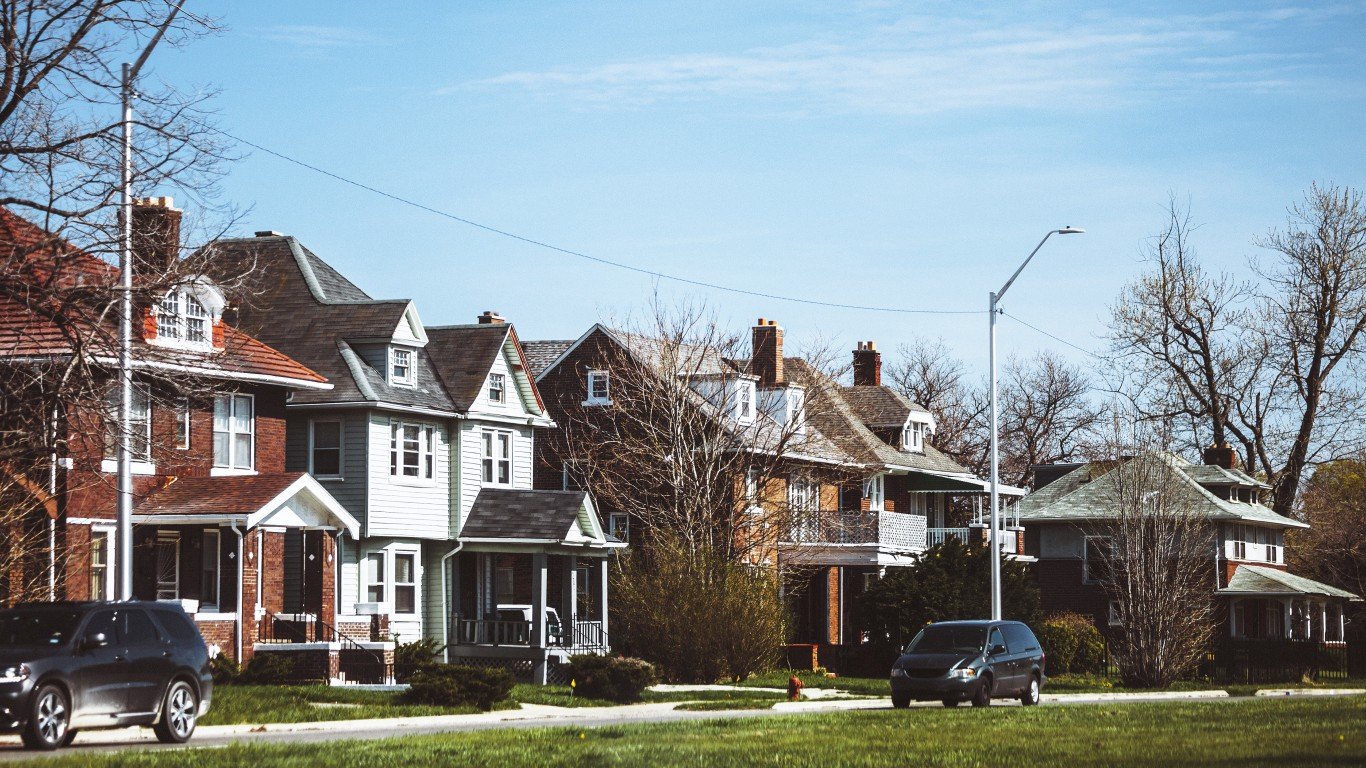
Source: peeterv / Getty Images
36. Michigan
> Avg. equity gain, 12 months through Q2 2021: +$27,000
> Median household income: $59,584 (19th lowest)
> Median home listing price: $248,450 (10th lowest)
> Pct. of homeowners who owe more than their home is worth: 3.0% (12th most)
[in-text-ad]
Source: AlenaMozhjer / iStock via Getty Images
35. Wisconsin
> Avg. equity gain, 12 months through Q2 2021: +$28,000
> Median household income: $64,168 (21st highest)
> Median home listing price: $275,000 (17th lowest)
> Pct. of homeowners who owe more than their home is worth: 3.2% (10th most)
 24/7 Wall St.
Source: Public Domain / Wikimedia Commons
34. Nebraska
> Avg. equity gain, 12 months through Q2 2021: +$28,000
> Median household income: $63,229 (25th highest)
> Median home listing price: $253,475 (12th lowest)
> Pct. of homeowners who owe more than their home is worth: 1.5% (18th least)

Source: beverett / Getty Images
33. Kansas
> Avg. equity gain, 12 months through Q2 2021: +$29,000
> Median household income: $62,087 (24th lowest)
> Median home listing price: $212,450 (3rd lowest)
> Pct. of homeowners who owe more than their home is worth: 1.5% (18th least)
[in-text-ad-2]

Source: biglanphoto / Getty Images
32. Missouri
> Avg. equity gain, 12 months through Q2 2021: +$30,000
> Median household income: $57,409 (13th lowest)
> Median home listing price: $243,750 (9th lowest)
> Pct. of homeowners who owe more than their home is worth: 2.6% (15th most)

Source: SeanPavonePhoto / Getty Images
31. Pennsylvania
> Avg. equity gain, 12 months through Q2 2021: +$30,000
> Median household income: $63,463 (23rd highest)
> Median home listing price: $267,000 (15th lowest)
> Pct. of homeowners who owe more than their home is worth: 2.4% (19th most)
[in-text-ad]
Source: Andrew Farkas / Wikimedia Commons
30. Wyoming
> Avg. equity gain, 12 months through Q2 2021: +$31,000
> Median household income: $65,003 (19th highest)
> Median home listing price: $329,500 (23rd lowest)
> Pct. of homeowners who owe more than their home is worth: 2.2% (22nd most)
Source: RoschetzkyIstockPhoto / Getty Images
29. Texas
> Avg. equity gain, 12 months through Q2 2021: +$31,000
> Median household income: $64,034 (22nd highest)
> Median home listing price: $350,000 (24th highest)
> Pct. of homeowners who owe more than their home is worth: 1.6% (20th least)

Source: benedek / Getty Images
28. New York
> Avg. equity gain, 12 months through Q2 2021: +$32,000
> Median household income: $72,108 (14th highest)
> Median home listing price: $574,000 (6th highest)
> Pct. of homeowners who owe more than their home is worth: 3.7% (7th most)
[in-text-ad-2]

Source: Tim Kiser (w:User:Malepheasant) / Wikimedia Commons
27. Minnesota
> Avg. equity gain, 12 months through Q2 2021: +$33,000
> Median household income: $74,593 (13th highest)
> Median home listing price: $319,900 (21st lowest)
> Pct. of homeowners who owe more than their home is worth: 2.1% (23rd most)

Source: bauhaus1000 / Getty Images
26. South Carolina
> Avg. equity gain, 12 months through Q2 2021: +$35,000
> Median household income: $56,227 (10th lowest)
> Median home listing price: $325,450 (22nd lowest)
> Pct. of homeowners who owe more than their home is worth: 2.4% (19th most)
[in-text-ad]
Source: Purdue9394 / Getty Images
25. Indiana
> Avg. equity gain, 12 months through Q2 2021: +$35,000
> Median household income: $57,603 (14th lowest)
> Median home listing price: $232,500 (7th lowest)
> Pct. of homeowners who owe more than their home is worth: 1.4% (14th least)
Source: TennesseePhotographer / Getty Images
24. Tennessee
> Avg. equity gain, 12 months through Q2 2021: +$37,000
> Median household income: $56,071 (9th lowest)
> Median home listing price: $346,532 (25th highest)
> Pct. of homeowners who owe more than their home is worth: 2.6% (15th most)
Source: Paulbr / Getty Images
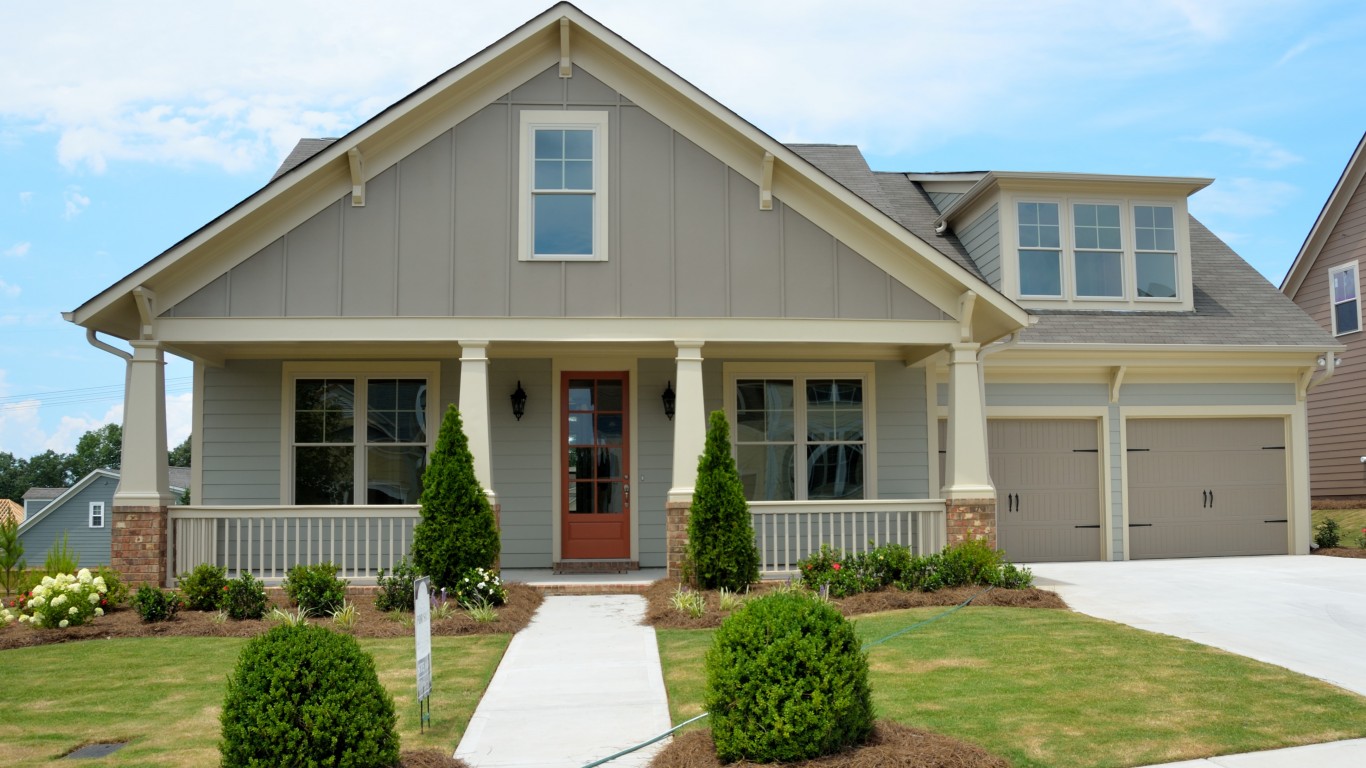
23. Georgia
> Avg. equity gain, 12 months through Q2 2021: +$37,000
> Median household income: $61,980 (22nd lowest)
> Median home listing price: $364,950 (21st highest)
> Pct. of homeowners who owe more than their home is worth: 2.1% (23rd most)
[in-text-ad-2]

Source: ivanastar / Getty Images
22. New Mexico
> Avg. equity gain, 12 months through Q2 2021: +$37,000
> Median household income: $51,945 (6th lowest)
> Median home listing price: $305,000 (20th lowest)
> Pct. of homeowners who owe more than their home is worth: 2.0% (25th most)

Source: OlegAlbinsky / Getty Images
21. Maine
> Avg. equity gain, 12 months through Q2 2021: +$37,000
> Median household income: $58,924 (16th lowest)
> Median home listing price: $336,500 (24th lowest)
> Pct. of homeowners who owe more than their home is worth: 1.6% (20th least)
[in-text-ad]

Source: Robert Kirk / Getty Images
20. Delaware
> Avg. equity gain, 12 months through Q2 2021: +$44,000
> Median household income: $70,176 (16th highest)
> Median home listing price: $387,000 (18th highest)
> Pct. of homeowners who owe more than their home is worth: 3.3% (9th most)

Source: Rhpotter / Wikimedia Commons
19. North Carolina
> Avg. equity gain, 12 months through Q2 2021: +$44,000
> Median household income: $57,341 (12th lowest)
> Median home listing price: $359,000 (23rd highest)
> Pct. of homeowners who owe more than their home is worth: 2.0% (25th most)

Source: qingwa / Getty Images
18. Maryland
> Avg. equity gain, 12 months through Q2 2021: +$46,000
> Median household income: $86,738 (the highest)
> Median home listing price: $374,995 (20th highest)
> Pct. of homeowners who owe more than their home is worth: 2.6% (15th most)
[in-text-ad-2]

Source: Public Domain / Wikimedia Commons
17. Florida
> Avg. equity gain, 12 months through Q2 2021: +$46,000
> Median household income: $59,227 (17th lowest)
> Median home listing price: $399,000 (17th highest)
> Pct. of homeowners who owe more than their home is worth: 2.3% (21st most)

Source: Greg Bethmann / Getty Images
16. Virginia
> Avg. equity gain, 12 months through Q2 2021: +$50,000
> Median household income: $76,456 (10th highest)
> Median home listing price: $375,916 (19th highest)
> Pct. of homeowners who owe more than their home is worth: 1.9% (24th least)
[in-text-ad]
Source: GCShutter / Getty Images
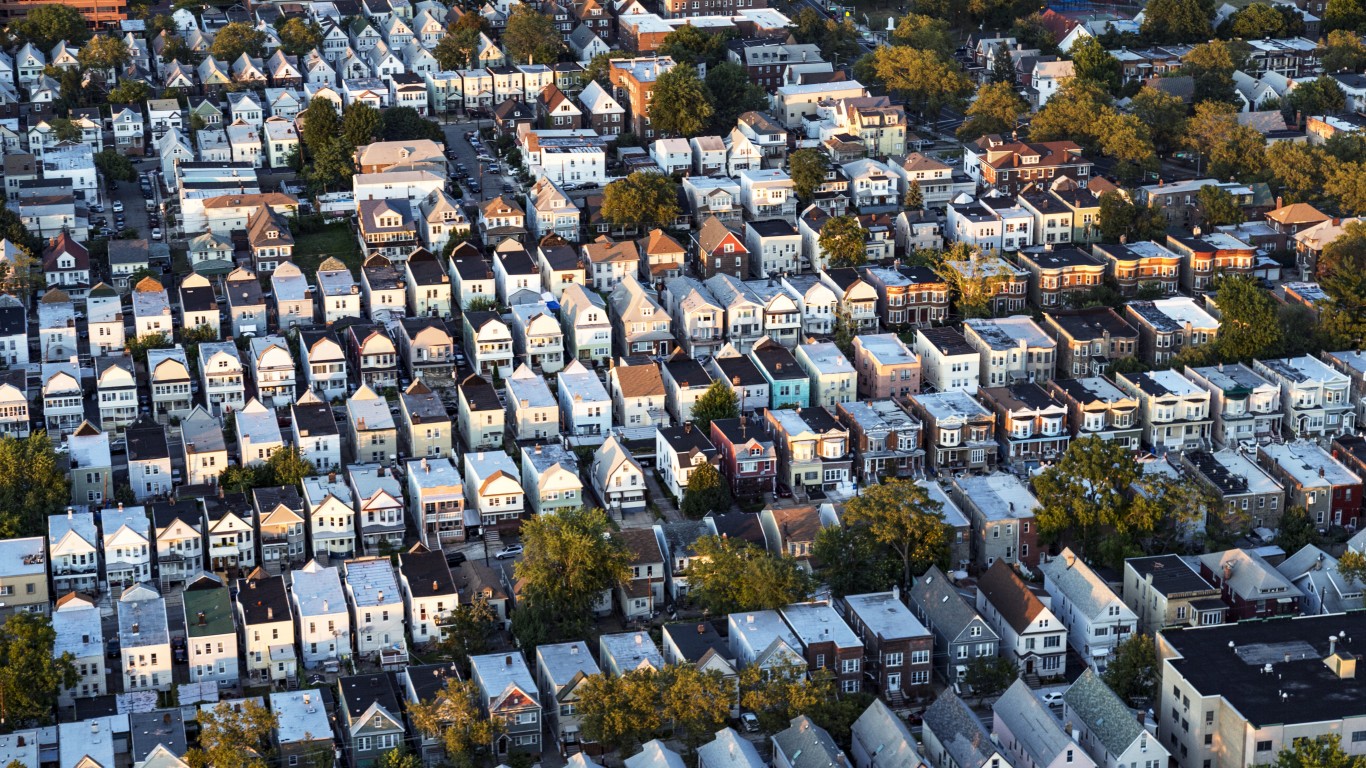
15. New Jersey
> Avg. equity gain, 12 months through Q2 2021: +$55,000
> Median household income: $85,751 (3rd highest)
> Median home listing price: $439,950 (14th highest)
> Pct. of homeowners who owe more than their home is worth: 2.7% (13th most)

Source: DenisTangneyJr / iStock via Getty Images
14. New Hampshire
> Avg. equity gain, 12 months through Q2 2021: +$55,000
> Median household income: $77,933 (8th highest)
> Median home listing price: $425,000 (15th highest)
> Pct. of homeowners who owe more than their home is worth: 1.9% (24th least)

Source: Joe Mabel / Wikimedia Commons
13. Connecticut
> Avg. equity gain, 12 months through Q2 2021: +$64,000
> Median household income: $78,833 (6th highest)
> Median home listing price: $459,250 (11th highest)
> Pct. of homeowners who owe more than their home is worth: 3.1% (11th most)
[in-text-ad-2]
Source: trekandshoot / Getty Images
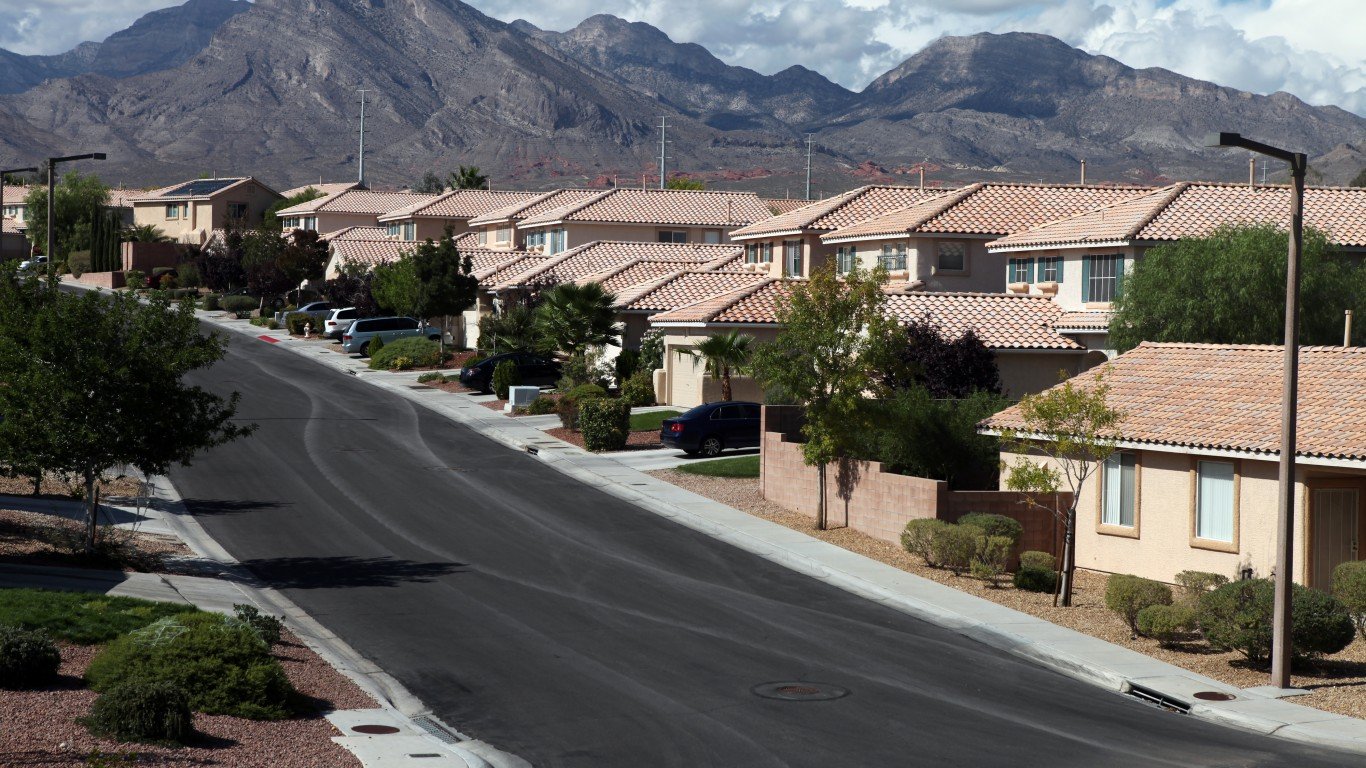
12. Nevada
> Avg. equity gain, 12 months through Q2 2021: +$64,000
> Median household income: $63,276 (24th highest)
> Median home listing price: $449,450 (13th highest)
> Pct. of homeowners who owe more than their home is worth: 1.3% (9th least)
Source: Swampyank. / Wikimedia Commons
11. Rhode Island
> Avg. equity gain, 12 months through Q2 2021: +$68,000
> Median household income: $71,169 (15th highest)
> Median home listing price: $420,950 (16th highest)
> Pct. of homeowners who owe more than their home is worth: 1.9% (24th least)
[in-text-ad]

Source: Orygun / Wikimedia Commons
10. Oregon
> Avg. equity gain, 12 months through Q2 2021: +$68,000
> Median household income: $67,058 (18th highest)
> Median home listing price: $520,000 (10th highest)
> Pct. of homeowners who owe more than their home is worth: 1.1% (6th least)
 24/7 Wall St.
Source: Robstutz / Wikimedia Commons
9. Montana
> Avg. equity gain, 12 months through Q2 2021: +$73,000
> Median household income: $57,153 (11th lowest)
> Median home listing price: $529,950 (9th highest)
> Pct. of homeowners who owe more than their home is worth: 1.5% (18th least)

Source: benedek / Getty Images
8. Massachusetts
> Avg. equity gain, 12 months through Q2 2021: +$74,000
> Median household income: $85,843 (2nd highest)
> Median home listing price: $632,000 (3rd highest)
> Pct. of homeowners who owe more than their home is worth: 1.7% (21st least)
[in-text-ad-2]

Source: krblokhin / iStock via Getty Images
7. Colorado
> Avg. equity gain, 12 months through Q2 2021: +$77,000
> Median household income: $77,127 (9th highest)
> Median home listing price: $575,000 (4th highest)
> Pct. of homeowners who owe more than their home is worth: 1.4% (14th least)

Source: Mcmillin24 / Wikimedia Commons
6. Arizona
> Avg. equity gain, 12 months through Q2 2021: +$79,000
> Median household income: $62,055 (23rd lowest)
> Median home listing price: $449,950 (12th highest)
> Pct. of homeowners who owe more than their home is worth: 1.2% (7th least)
[in-text-ad]

Source: Tricia Simpson / Wikimedia Commons
5. Utah
> Avg. equity gain, 12 months through Q2 2021: +$81,000
> Median household income: $75,780 (11th highest)
> Median home listing price: $572,450 (7th highest)
> Pct. of homeowners who owe more than their home is worth: 1.3% (9th least)
 24/7 Wall St.
Source: Daderot. / Wikimedia Commons
4. Hawaii
> Avg. equity gain, 12 months through Q2 2021: +$86,000
> Median household income: $83,102 (4th highest)
> Median home listing price: $725,000 (2nd highest)
> Pct. of homeowners who owe more than their home is worth: 1.4% (14th least)
Source: JERRYE AND ROY KLOTZ MD / Wikimedia Commons
3. Idaho
> Avg. equity gain, 12 months through Q2 2021: +$97,000
> Median household income: $60,999 (20th lowest)
> Median home listing price: $532,500 (8th highest)
> Pct. of homeowners who owe more than their home is worth: 1.5% (18th least)
[in-text-ad-2]
Source: irina88w / Getty Images
2. Washington
> Avg. equity gain, 12 months through Q2 2021: +$102,900
> Median household income: $78,687 (7th highest)
> Median home listing price: $575,000 (4th highest)
> Pct. of homeowners who owe more than their home is worth: 1.4% (14th least)
Source: pbk-pg / Getty Images
1. California
> Avg. equity gain, 12 months through Q2 2021: +$116,300
> Median household income: $80,440 (5th highest)
> Median home listing price: $726,500 (the highest)
> Pct. of homeowners who owe more than their home is worth: 0.8% (5th least)
Essential Tips for Investing: Sponsored
A financial advisor can help you understand the advantages and disadvantages of investment properties. Finding a qualified financial advisor doesn’t have to be hard. SmartAsset’s free tool matches you with up to three financial advisors who serve your area, and you can interview your advisor matches at no cost to decide which one is right for you. If you’re ready to find an advisor who can help you achieve your financial goals, get started now.
Investing in real estate can diversify your portfolio. But expanding your horizons may add additional costs. If you’re an investor looking to minimize expenses, consider checking out online brokerages. They often offer low investment fees, helping you maximize your profit.
Thank you for reading! Have some feedback for us?
Contact the 24/7 Wall St. editorial team.