The United States has some of the highest levels of income and wealth inequality in the world. U.S. Federal Reserve data shows that the wealthiest 10% of Americans control $93.8 trillion, more than double the $40.3 trillion in the hands of the remaining 90% of Americans.
The income and wealth divide only appears to be growing wider. A January 2020 report published by the Pew Research Center found that over the last four decades, income growth for the top 5% of families by earnings has far outpaced income growth for families in lower income strata.
While in a nation as large as the U.S. high levels of income inequality may be expected, there are small pockets of the country in which extreme wealth and extreme poverty exist side by side. Even at the city level, income inequality can be far more pronounced than it is on average nationwide.
Using data from the U.S. Census Bureau’s 2019 American Community Survey, 24/7 Wall St. identified the 50 U.S. cities with the widest income gaps. Cities are ranked by their Gini coefficient, a measure of income inequality based on the distribution of income across a population on a 0 to 1 scale — 0 representing perfect equality and 1 representing the highest possible level of inequality. For the purposes of this story, cities are defined as any place covered by the census with populations over 25,000.
Among the places on this list, Gini scores are as high as 0.606 — well above the national Gini coefficient of 0.482. These cities are largely concentrated in Southern states, including nine in Florida alone.
Causes behind rising inequality are complex and varied. A report published by the National Bureau of Economic Research ties the rising disparity to a range of economic factors, including globalization, technological advancement, a stagnant minimum wage, and the decline of labor unions.
Click here to see America’s cities with the widest income gaps
Click here to read our detailed methodology

Source: By Spencer - Own work, CC BY-SA 2.5, https://commons.wikimedia.org/w/index.php?curid=4434434
50. Shaker Heights, Ohio
> Gini index: 0.54
> Avg. household income, top 20%: $413,816 — 66th highest of 1,775 cities
> Avg. household income, bottom 20%: $17,963 — 720th highest of 1,775 cities
> Share of all income in Shaker Heights that went to top 20%: 57.6% — 34th highest of 1,775 cities (tied)
> Share of all income in Shaker Heights that went to bottom 20%: 2.5% — 124th lowest of 1,775 cities (tied)
> Median household income: $87,235 — 410th highest of 1,775 cities
[in-text-ad]

Source: DenisTangneyJr / Getty Images
49. Cincinnati, Ohio
> Gini index: 0.541
> Avg. household income, top 20%: $185,279 — 771st lowest of 1,775 cities
> Avg. household income, bottom 20%: $7,255 — 82nd lowest of 1,775 cities
> Share of all income in Cincinnati that went to top 20%: 56.8% — 49th highest of 1,775 cities (tied)
> Share of all income in Cincinnati that went to bottom 20%: 2.2% — 76th lowest of 1,775 cities (tied)
> Median household income: $40,640 — 151st lowest of 1,775 cities
Source: Dee / iStock Editorial via Getty Images
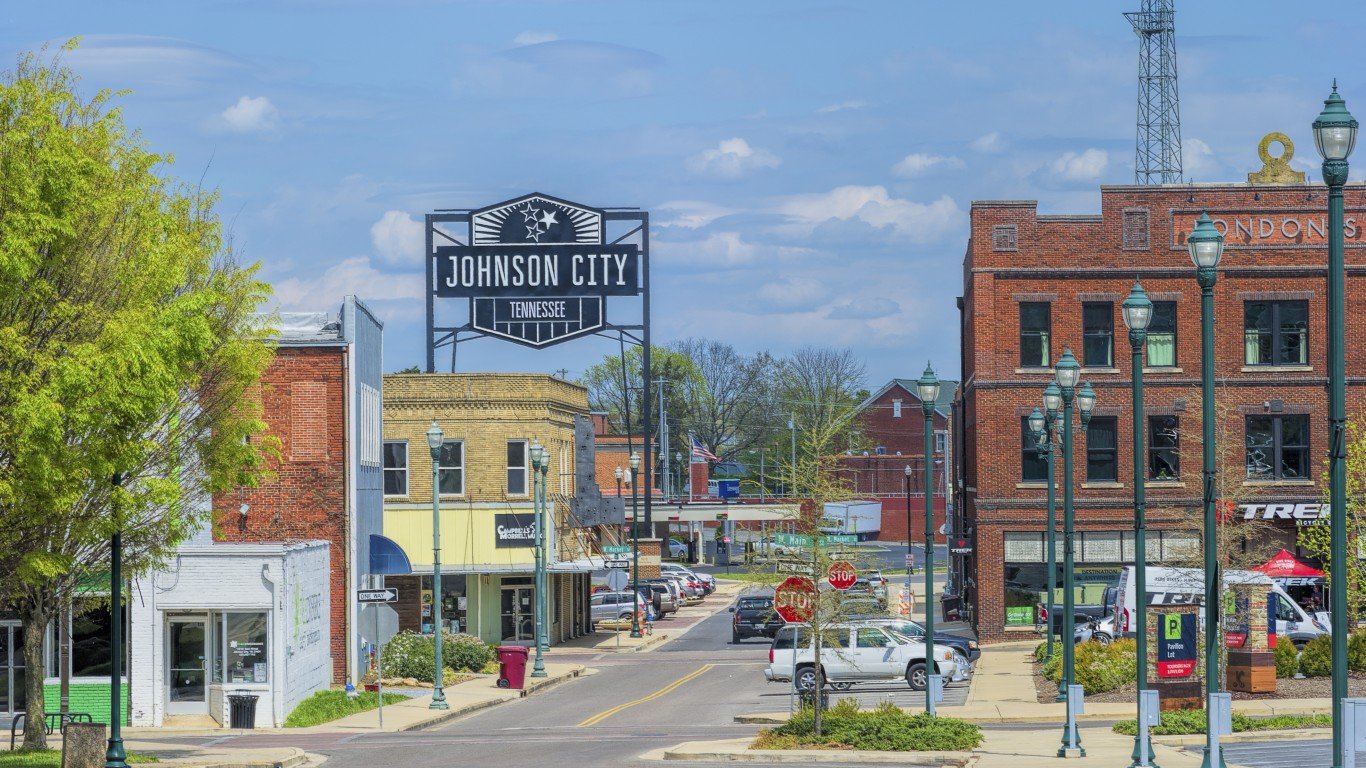
48. Johnson City, Tennessee
> Gini index: 0.541
> Avg. household income, top 20%: $199,035 — 822nd highest of 1,775 cities
> Avg. household income, bottom 20%: $8,378 — 155th lowest of 1,775 cities
> Share of all income in Johnson City that went to top 20%: 57.2% — 43rd highest of 1,775 cities
> Share of all income in Johnson City that went to bottom 20%: 2.4% — 103rd lowest of 1,775 cities (tied)
> Median household income: $41,682 — 173rd lowest of 1,775 cities

Source: DenisTangneyJr / Getty Images
47. Providence, Rhode Island
> Gini index: 0.541
> Avg. household income, top 20%: $200,972 — 801st highest of 1,775 cities
> Avg. household income, bottom 20%: $7,807 — 118th lowest of 1,775 cities
> Share of all income in Providence that went to top 20%: 56.5% — 60th highest of 1,775 cities
> Share of all income in Providence that went to bottom 20%: 2.2% — 71st lowest of 1,775 cities (tied)
> Median household income: $45,610 — 296th lowest of 1,775 cities
[in-text-ad-2]

Source: Sean Pavone / Getty Images
46. Tampa, Florida
> Gini index: 0.542
> Avg. household income, top 20%: $251,864 — 429th highest of 1,775 cities
> Avg. household income, bottom 20%: $10,249 — 310th lowest of 1,775 cities (tied)
> Share of all income in Tampa that went to top 20%: 57.4% — 41st highest of 1,775 cities
> Share of all income in Tampa that went to bottom 20%: 2.3% — 93rd lowest of 1,775 cities (tied)
> Median household income: $53,833 — 587th lowest of 1,775 cities

Source: VisionsbyAtlee / iStock via Getty Images
45. Bonita Springs, Florida
> Gini index: 0.542
> Avg. household income, top 20%: $346,692 — 145th highest of 1,775 cities
> Avg. household income, bottom 20%: $19,133 — 629th highest of 1,775 cities
> Share of all income in Bonita Springs that went to top 20%: 58.8% — 18th highest of 1,775 cities
> Share of all income in Bonita Springs that went to bottom 20%: 3.2% — 467th lowest of 1,775 cities (tied)
> Median household income: $70,249 — 741st highest of 1,775 cities
[in-text-ad]

Source: ChrisBoswell / iStock via Getty Images
44. Atlantic City, New Jersey
> Gini index: 0.543
> Avg. household income, top 20%: $138,200 — 179th lowest of 1,775 cities
> Avg. household income, bottom 20%: $6,036 — 35th lowest of 1,775 cities (tied)
> Share of all income in Atlantic City that went to top 20%: 57.7% — 31st highest of 1,775 cities (tied)
> Share of all income in Atlantic City that went to bottom 20%: 2.5% — 131st lowest of 1,775 cities (tied)
> Median household income: $29,232 — 11th lowest of 1,775 cities
 24/7 Wall St.
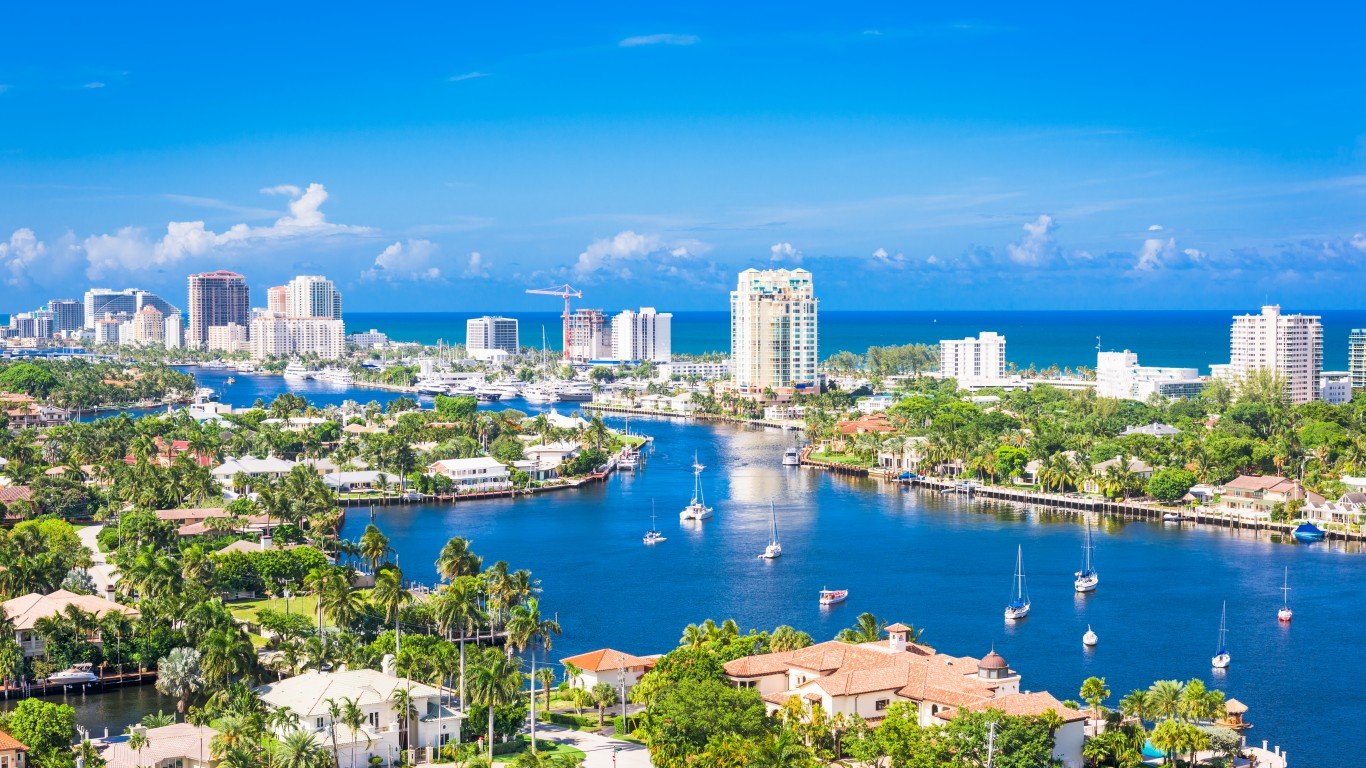
Source: Sean Pavone / iStock via Getty Images
43. Fort Lauderdale, Florida
> Gini index: 0.544
> Avg. household income, top 20%: $287,571 — 262nd highest of 1,775 cities
> Avg. household income, bottom 20%: $12,795 — 589th lowest of 1,775 cities
> Share of all income in Fort Lauderdale that went to top 20%: 57.9% — 23rd highest of 1,775 cities (tied)
> Share of all income in Fort Lauderdale that went to bottom 20%: 2.6% — 145th lowest of 1,775 cities (tied)
> Median household income: $59,450 — 749th lowest of 1,775 cities

Source: DenisTangneyJr / iStock via Getty Images
42. Wilmington, Delaware
> Gini index: 0.544
> Avg. household income, top 20%: $197,044 — 844th highest of 1,775 cities
> Avg. household income, bottom 20%: $6,610 — 49th lowest of 1,775 cities
> Share of all income in Wilmington that went to top 20%: 56.7% — 53rd highest of 1,775 cities
> Share of all income in Wilmington that went to bottom 20%: 1.9% — 39th lowest of 1,775 cities
> Median household income: $45,032 — 277th lowest of 1,775 cities
[in-text-ad-2]

Source: DenisTangneyJr / E+ via Getty Images
41. Newport Beach, California
> Gini index: 0.545
> Avg. household income, top 20%: $622,393 — 17th highest of 1,775 cities
> Avg. household income, bottom 20%: $24,105 — 330th highest of 1,775 cities
> Share of all income in Newport Beach that went to top 20%: 58.2% — 21st highest of 1,775 cities
> Share of all income in Newport Beach that went to bottom 20%: 2.3% — 85th lowest of 1,775 cities (tied)
> Median household income: $127,223 — 75th highest of 1,775 cities

Source: Sean Pavone / iStock via Getty Images
40. Richmond, Virginia
> Gini index: 0.545
> Avg. household income, top 20%: $218,676 — 633rd highest of 1,775 cities
> Avg. household income, bottom 20%: $8,497 — 164th lowest of 1,775 cities
> Share of all income in Richmond that went to top 20%: 57.4% — 40th highest of 1,775 cities
> Share of all income in Richmond that went to bottom 20%: 2.2% — 76th lowest of 1,775 cities (tied)
> Median household income: $47,250 — 353rd lowest of 1,775 cities
[in-text-ad]
Source: ChrisBoswell / iStock via Getty Images
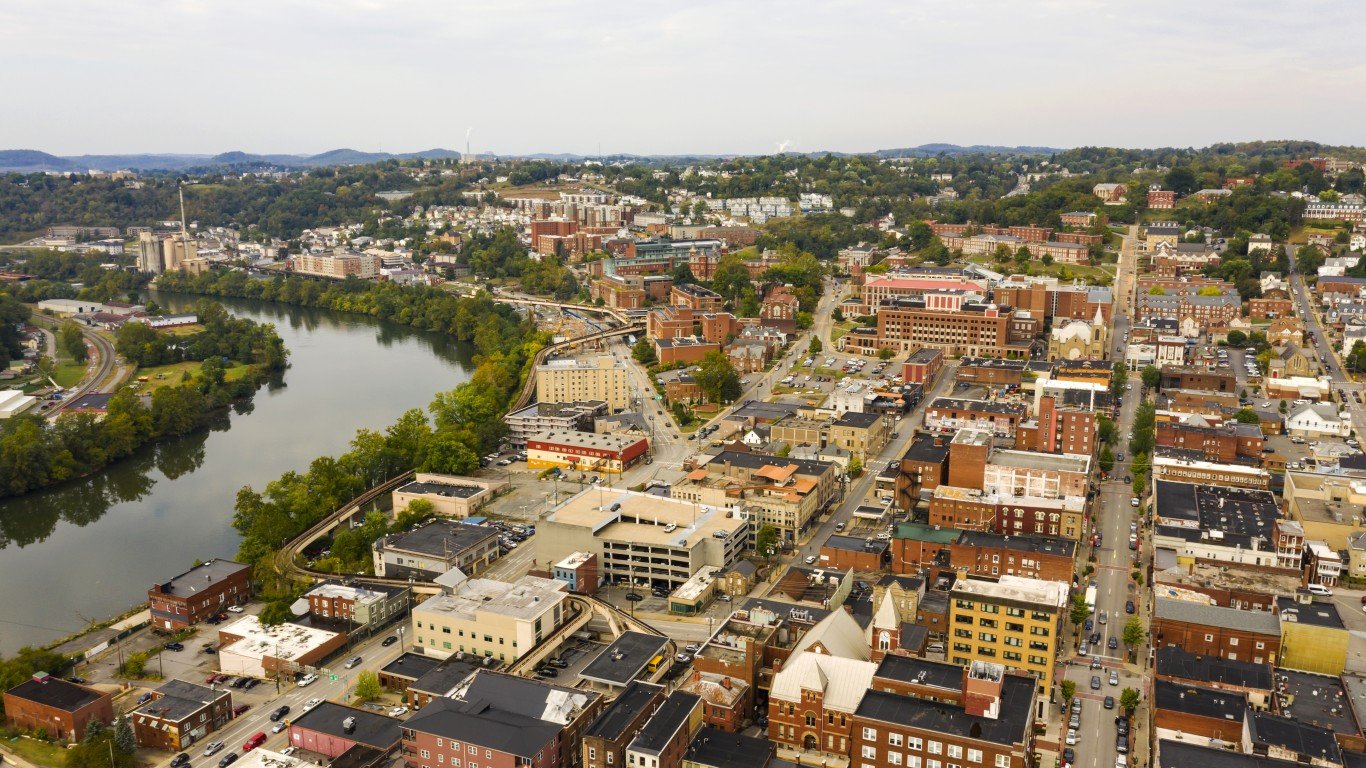
39. Morgantown, West Virginia
> Gini index: 0.545
> Avg. household income, top 20%: $182,656 — 747th lowest of 1,775 cities
> Avg. household income, bottom 20%: $3,998 — 13th lowest of 1,775 cities
> Share of all income in Morgantown that went to top 20%: 55.4% — 92nd highest of 1,775 cities (tied)
> Share of all income in Morgantown that went to bottom 20%: 1.2% — 10th lowest of 1,775 cities
> Median household income: $42,966 — 209th lowest of 1,775 cities

38. Houma, Louisiana
> Gini index: 0.546
> Avg. household income, top 20%: $202,324 — 790th highest of 1,775 cities
> Avg. household income, bottom 20%: $8,033 — 129th lowest of 1,775 cities
> Share of all income in Houma that went to top 20%: 56.6% — 58th highest of 1,775 cities
> Share of all income in Houma that went to bottom 20%: 2.3% — 82nd lowest of 1,775 cities (tied)
> Median household income: $42,949 — 208th lowest of 1,775 cities

Source: Trevor Parker / iStock via Getty Images
37. College Station, Texas
> Gini index: 0.546
> Avg. household income, top 20%: $207,826 — 724th highest of 1,775 cities
> Avg. household income, bottom 20%: $5,711 — 30th lowest of 1,775 cities
> Share of all income in College Station that went to top 20%: 56.3% — 64th highest of 1,775 cities (tied)
> Share of all income in College Station that went to bottom 20%: 1.5% — 20th lowest of 1,775 cities
> Median household income: $45,820 — 308th lowest of 1,775 cities
[in-text-ad-2]
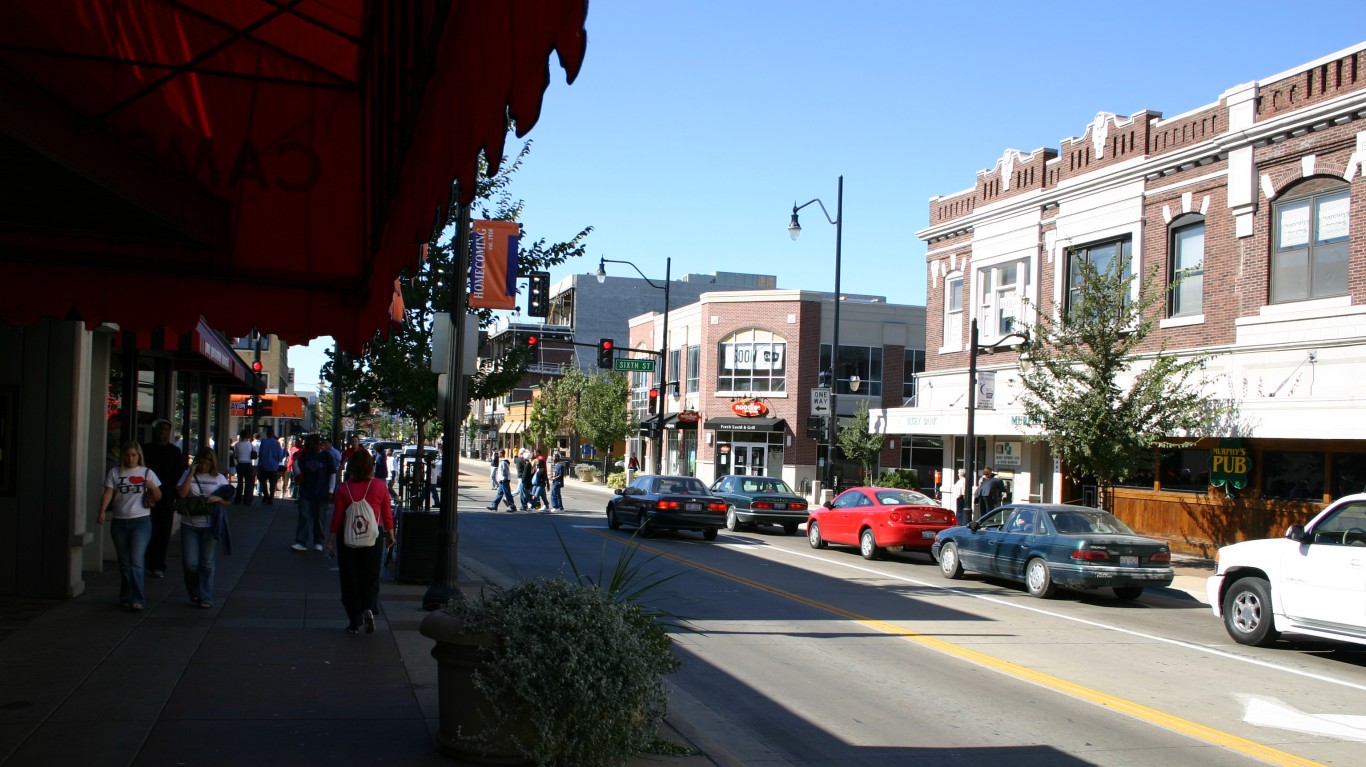
Source: Illinifan2003 / Wikimedia Commons
36. Champaign, Illinois
> Gini index: 0.547
> Avg. household income, top 20%: $207,921 — 723rd highest of 1,775 cities
> Avg. household income, bottom 20%: $4,911 — 19th lowest of 1,775 cities
> Share of all income in Champaign that went to top 20%: 56.8% — 51st highest of 1,775 cities
> Share of all income in Champaign that went to bottom 20%: 1.3% — 12th lowest of 1,775 cities
> Median household income: $48,415 — 400th lowest of 1,775 cities

Source: C5Media / iStock Editorial via Getty Images
35. Starkville, Mississippi
> Gini index: 0.547
> Avg. household income, top 20%: $154,941 — 375th lowest of 1,775 cities
> Avg. household income, bottom 20%: $3,890 — 12th lowest of 1,775 cities
> Share of all income in Starkville that went to top 20%: 55.8% — 77th highest of 1,775 cities
> Share of all income in Starkville that went to bottom 20%: 1.4% — 13th lowest of 1,775 cities
> Median household income: $35,048 — 52nd lowest of 1,775 cities
[in-text-ad]

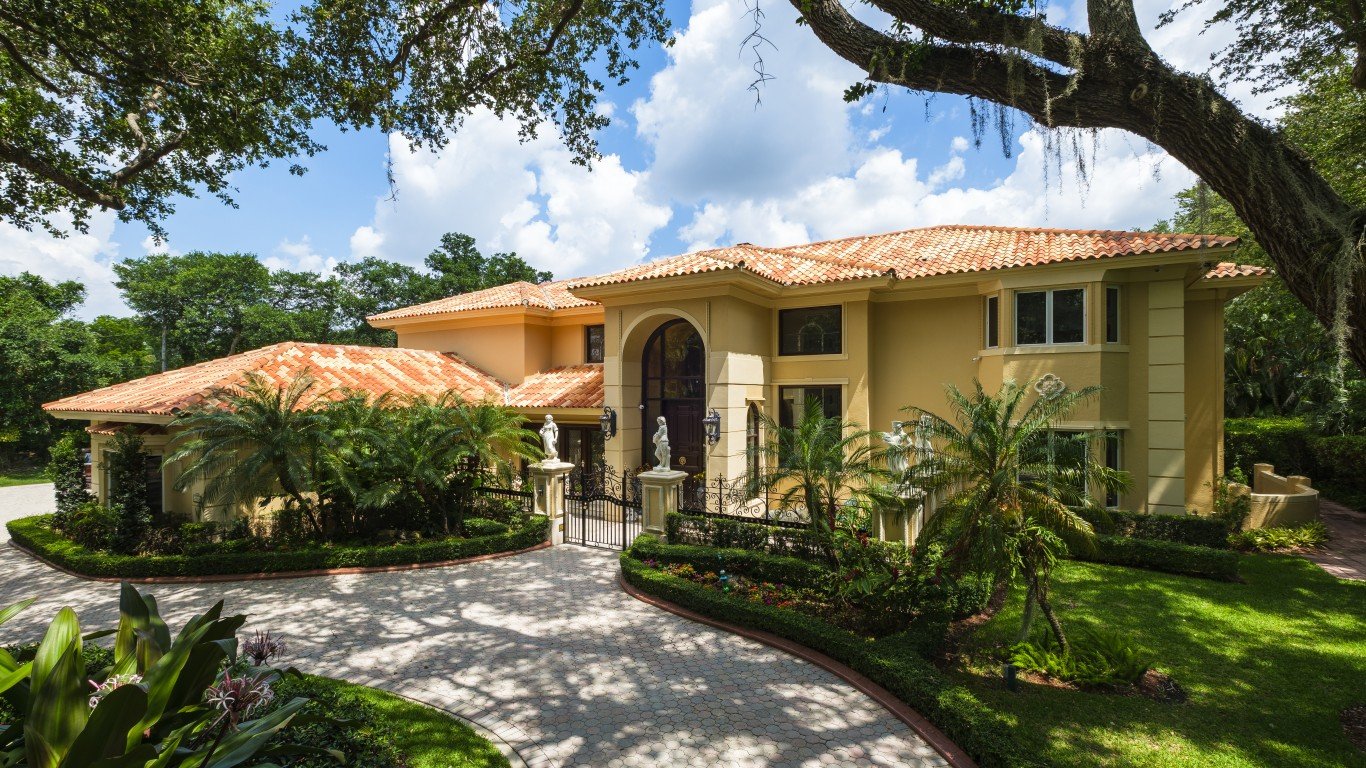
Source: anouchka / Getty Images
34. Boca Raton, Florida
> Gini index: 0.548
> Avg. household income, top 20%: $400,828 — 79th highest of 1,775 cities
> Avg. household income, bottom 20%: $15,144 — 825th lowest of 1,775 cities
> Share of all income in Boca Raton that went to top 20%: 58.0% — 22nd highest of 1,775 cities
> Share of all income in Boca Raton that went to bottom 20%: 2.2% — 71st lowest of 1,775 cities (tied)
> Median household income: $83,114 — 475th highest of 1,775 cities
 24/7 Wall St.
Source: Geoff Eccles / Getty Images
33. Greenville, Mississippi
> Gini index: 0.548
> Avg. household income, top 20%: $138,191 — 178th lowest of 1,775 cities
> Avg. household income, bottom 20%: $6,195 — 40th lowest of 1,775 cities (tied)
> Share of all income in Greenville that went to top 20%: 57.9% — 23rd highest of 1,775 cities (tied)
> Share of all income in Greenville that went to bottom 20%: 2.6% — 152nd lowest of 1,775 cities (tied)
> Median household income: $27,025 — 5th lowest of 1,775 cities
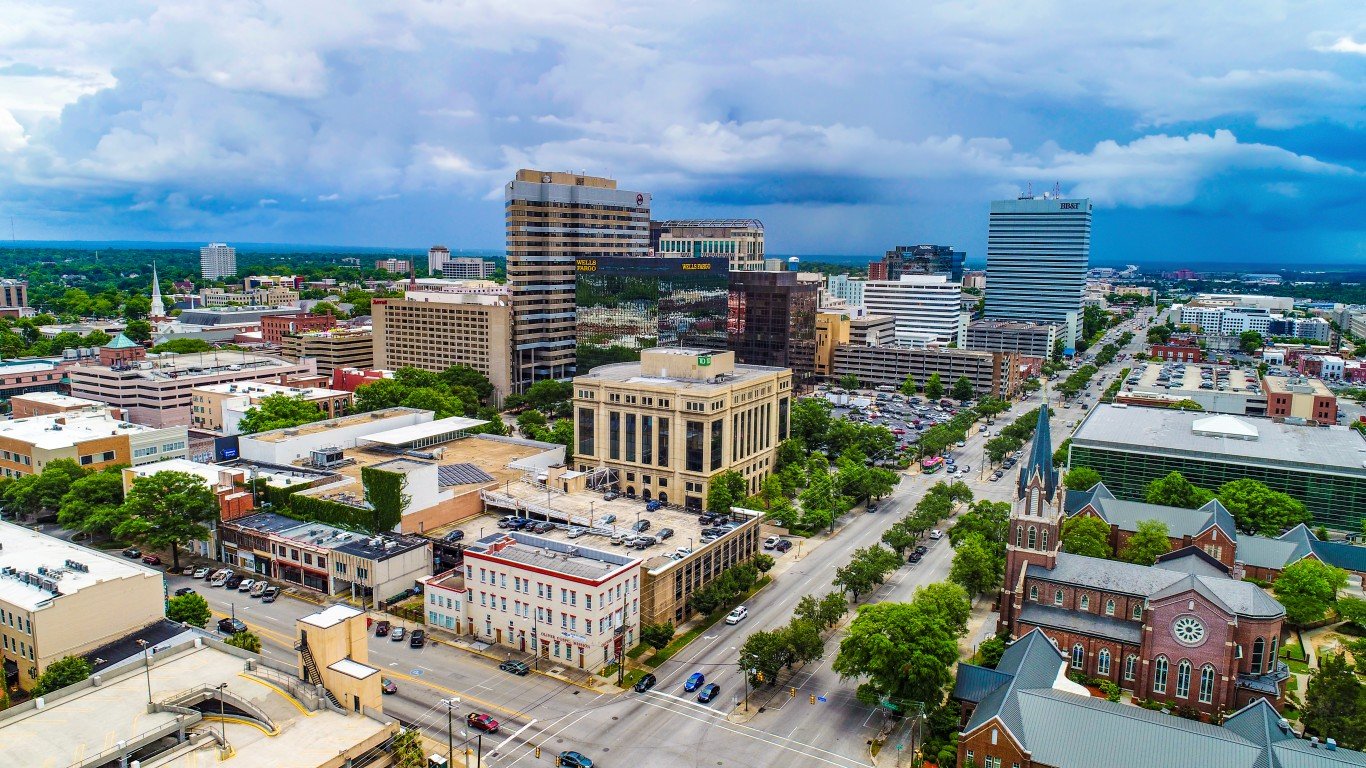
Source: Kruck20 / iStock via Getty Images
32. Columbia, South Carolina
> Gini index: 0.548
> Avg. household income, top 20%: $219,240 — 628th highest of 1,775 cities
> Avg. household income, bottom 20%: $7,675 — 108th lowest of 1,775 cities
> Share of all income in Columbia that went to top 20%: 57.6% — 34th highest of 1,775 cities (tied)
> Share of all income in Columbia that went to bottom 20%: 2.0% — 50th lowest of 1,775 cities (tied)
> Median household income: $47,286 — 354th lowest of 1,775 cities
[in-text-ad-2]

Source: Ryan Herron / E+ via Getty Images
31. Chapel Hill, North Carolina
> Gini index: 0.549
> Avg. household income, top 20%: $349,298 — 142nd highest of 1,775 cities
> Avg. household income, bottom 20%: $11,245 — 415th lowest of 1,775 cities
> Share of all income in Chapel Hill that went to top 20%: 56.7% — 52nd highest of 1,775 cities
> Share of all income in Chapel Hill that went to bottom 20%: 1.8% — 36th lowest of 1,775 cities
> Median household income: $73,614 — 660th highest of 1,775 cities

Source: TomasSereda / Getty Images
30. New York, New York
> Gini index: 0.549
> Avg. household income, top 20%: $295,662 — 244th highest of 1,775 cities
> Avg. household income, bottom 20%: $10,545 — 349th lowest of 1,775 cities
> Share of all income in New York that went to top 20%: 57.4% — 38th highest of 1,775 cities (tied)
> Share of all income in New York that went to bottom 20%: 2.0% — 57th lowest of 1,775 cities
> Median household income: $63,998 — 882nd highest of 1,775 cities
[in-text-ad]

Source: DenisTangneyJr / Getty Images
29. East St. Louis, Illinois
> Gini index: 0.55
> Avg. household income, top 20%: $107,886 — 13th lowest of 1,775 cities
> Avg. household income, bottom 20%: $3,299 — 8th lowest of 1,775 cities
> Share of all income in East St. Louis that went to top 20%: 57.1% — 44th highest of 1,775 cities
> Share of all income in East St. Louis that went to bottom 20%: 1.8% — 27th lowest of 1,775 cities
> Median household income: $24,343 — 2nd lowest of 1,775 cities
 24/7 Wall St.
Source: DenisTangneyJr / Getty Images
28. Texarkana, Texas
> Gini index: 0.55
> Avg. household income, top 20%: $205,398 — 752nd highest of 1,775 cities
> Avg. household income, bottom 20%: $7,427 — 89th lowest of 1,775 cities
> Share of all income in Texarkana that went to top 20%: 57.7% — 31st highest of 1,775 cities (tied)
> Share of all income in Texarkana that went to bottom 20%: 2.1% — 59th lowest of 1,775 cities
> Median household income: $45,080 — 280th lowest of 1,775 cities

Source: ViewApart / Getty Images
27. Santa Monica, California
> Gini index: 0.55
> Avg. household income, top 20%: $429,356 — 57th highest of 1,775 cities
> Avg. household income, bottom 20%: $13,492 — 683rd lowest of 1,775 cities
> Share of all income in Santa Monica that went to top 20%: 57.5% — 37th highest of 1,775 cities
> Share of all income in Santa Monica that went to bottom 20%: 1.8% — 33rd lowest of 1,775 cities (tied)
> Median household income: $96,570 — 291st highest of 1,775 cities
[in-text-ad-2]
Source: Public Domain / Wikimedia Commons
26. Charleston, West Virginia
> Gini index: 0.551
> Avg. household income, top 20%: $219,063 — 630th highest of 1,775 cities
> Avg. household income, bottom 20%: $8,779 — 184th lowest of 1,775 cities
> Share of all income in Charleston that went to top 20%: 58.3% — 19th highest of 1,775 cities
> Share of all income in Charleston that went to bottom 20%: 2.3% — 95th lowest of 1,775 cities
> Median household income: $43,344 — 220th lowest of 1,775 cities

Source: RobHainer / Getty Images
25. Auburn, Alabama
> Gini index: 0.553
> Avg. household income, top 20%: $209,137 — 710th highest of 1,775 cities
> Avg. household income, bottom 20%: $3,856 — 11th lowest of 1,775 cities
> Share of all income in Auburn that went to top 20%: 56.1% — 73rd highest of 1,775 cities
> Share of all income in Auburn that went to bottom 20%: 1.0% — 5th lowest of 1,775 cities
> Median household income: $47,318 — 355th lowest of 1,775 cities
[in-text-ad]

Source: BOB WESTON / iStock via Getty Images
24. Oxford, Mississippi
> Gini index: 0.554
> Avg. household income, top 20%: $202,773 — 787th highest of 1,775 cities
> Avg. household income, bottom 20%: $5,260 — 25th lowest of 1,775 cities
> Share of all income in Oxford that went to top 20%: 57.7% — 29th highest of 1,775 cities (tied)
> Share of all income in Oxford that went to bottom 20%: 1.5% — 19th lowest of 1,775 cities
> Median household income: $44,283 — 256th lowest of 1,775 cities
 24/7 Wall St.
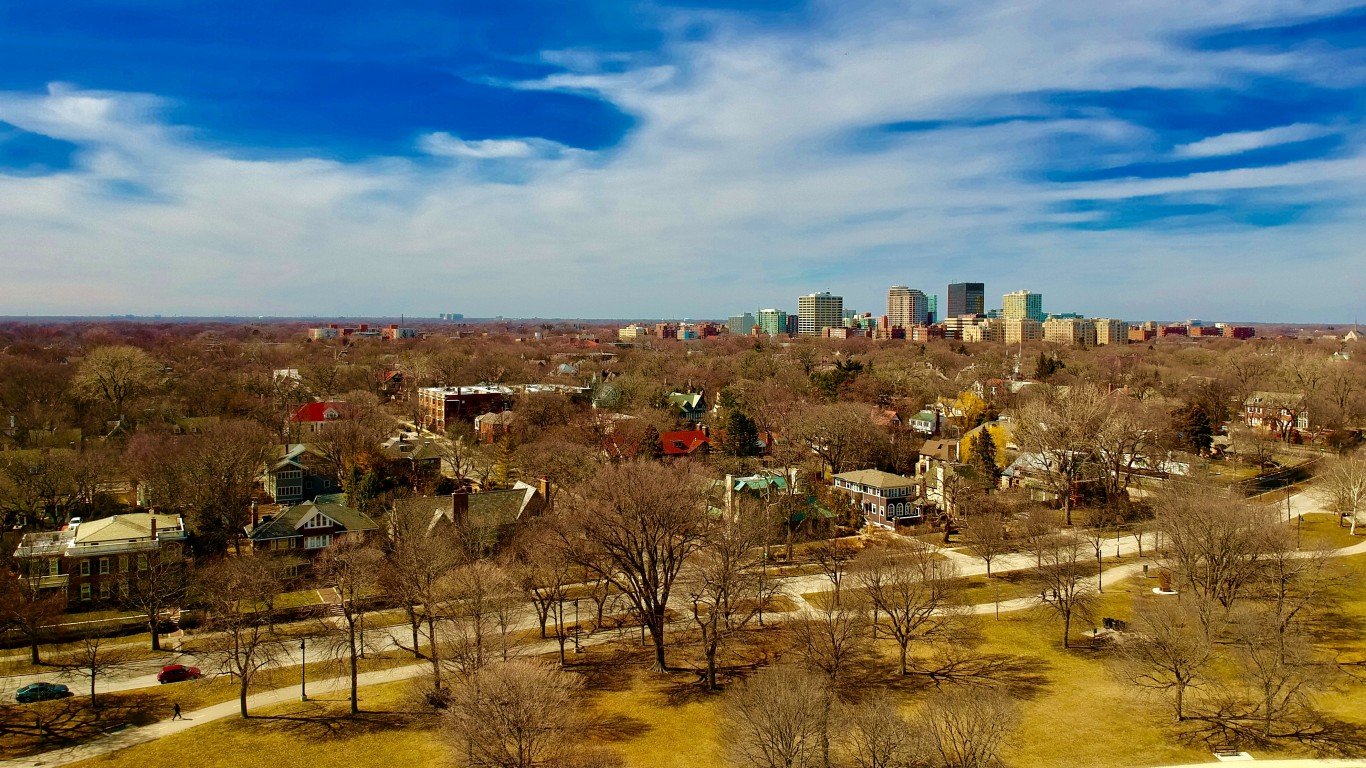
Source: Peter Klatt / iStock via Getty Images
23. Evanston, Illinois
> Gini index: 0.554
> Avg. household income, top 20%: $385,435 — 91st highest of 1,775 cities
> Avg. household income, bottom 20%: $13,033 — 626th lowest of 1,775 cities
> Share of all income in Evanston that went to top 20%: 58.3% — 20th highest of 1,775 cities
> Share of all income in Evanston that went to bottom 20%: 2.0% — 43rd lowest of 1,775 cities (tied)
> Median household income: $78,904 — 558th highest of 1,775 cities

22. Pullman, Washington
> Gini index: 0.555
> Avg. household income, top 20%: $158,178 — 417th lowest of 1,775 cities
> Avg. household income, bottom 20%: $4,079 — 14th lowest of 1,775 cities
> Share of all income in Pullman that went to top 20%: 57.8% — 26th highest of 1,775 cities
> Share of all income in Pullman that went to bottom 20%: 1.5% — 18th lowest of 1,775 cities
> Median household income: $31,487 — 20th lowest of 1,775 cities
[in-text-ad-2]
Source: RAUL RODRIGUEZ / iStock via Getty Images
21. Coral Gables, Florida
> Gini index: 0.558
> Avg. household income, top 20%: $518,551 — 34th highest of 1,775 cities
> Avg. household income, bottom 20%: $17,689 — 737th highest of 1,775 cities
> Share of all income in Coral Gables that went to top 20%: 59.2% — 15th highest of 1,775 cities
> Share of all income in Coral Gables that went to bottom 20%: 2.0% — 50th lowest of 1,775 cities (tied)
> Median household income: $100,843 — 250th highest of 1,775 cities

Source: gnagel / iStock Editorial via Getty Images
20. Urbana, Illinois
> Gini index: 0.558
> Avg. household income, top 20%: $169,216 — 549th lowest of 1,775 cities
> Avg. household income, bottom 20%: $2,489 — 2nd lowest of 1,775 cities
> Share of all income in Urbana that went to top 20%: 57.5% — 36th highest of 1,775 cities
> Share of all income in Urbana that went to bottom 20%: 0.9% — 2nd lowest of 1,775 cities
> Median household income: $37,102 — 80th lowest of 1,775 cities
[in-text-ad]
Source: Alex Potemkin / iStock via Getty Images
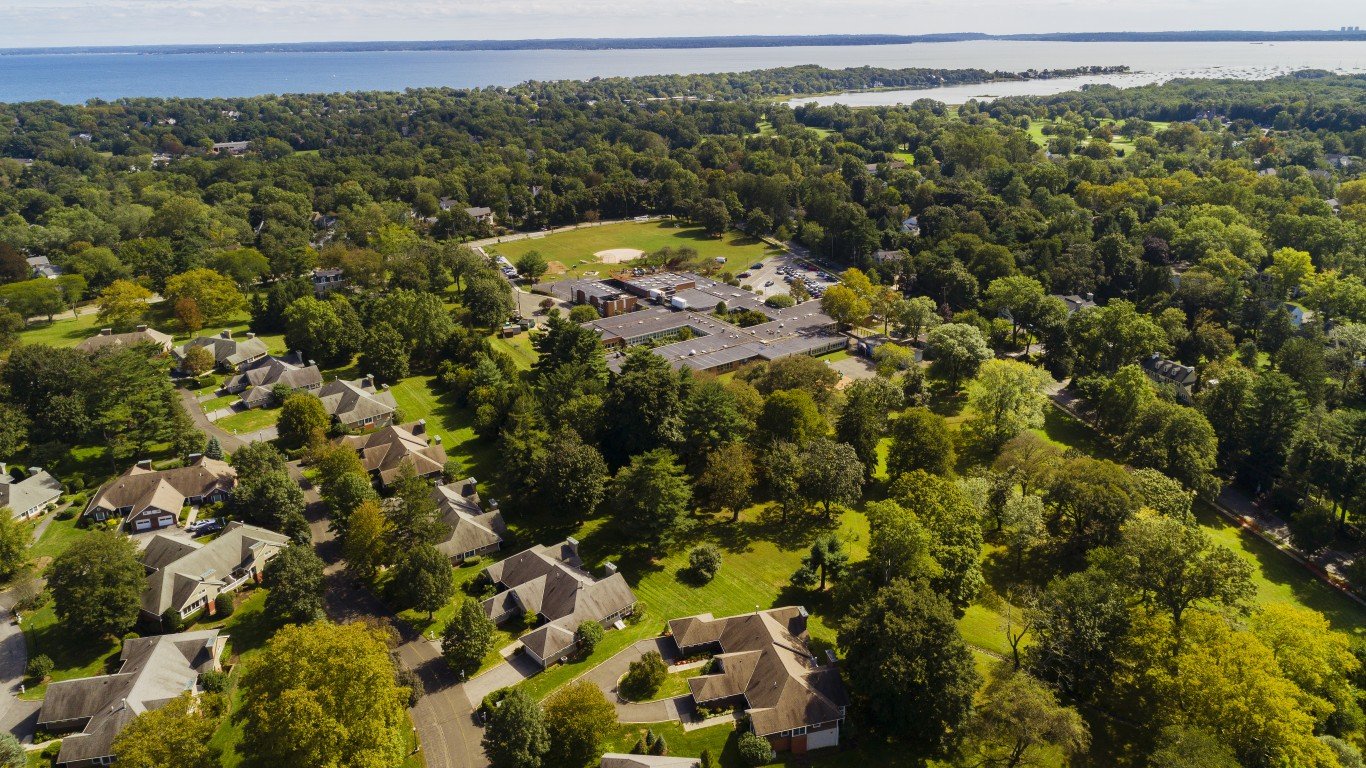
19. Harrison, New York
> Gini index: 0.559
> Avg. household income, top 20%: $696,046 — 8th highest of 1,775 cities
> Avg. household income, bottom 20%: $28,586 — 172nd highest of 1,775 cities
> Share of all income in Harrison that went to top 20%: 60.6% — 8th highest of 1,775 cities
> Share of all income in Harrison that went to bottom 20%: 2.5% — 121st lowest of 1,775 cities (tied)
> Median household income: $123,030 — 92nd highest of 1,775 cities
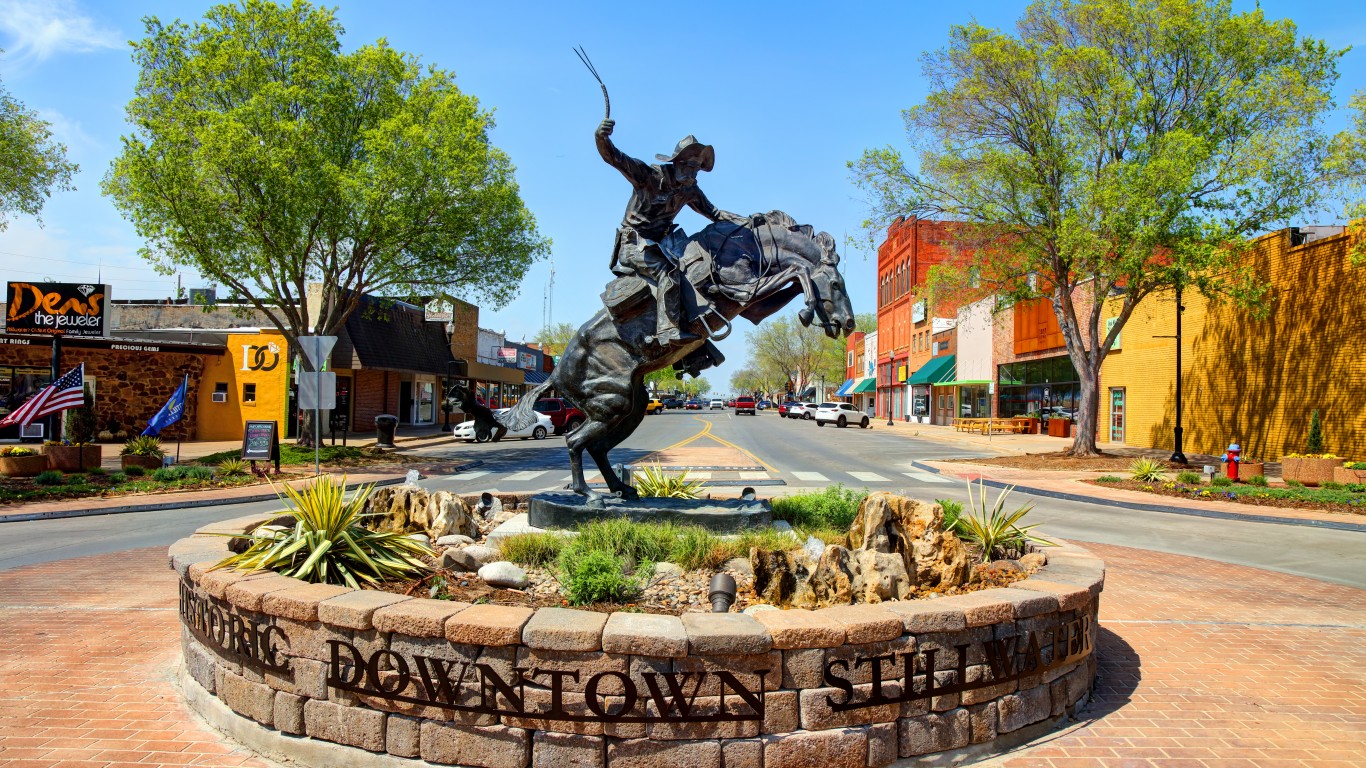
Source: DenisTangneyJr / iStock Unreleased via Getty Images
18. Stillwater, Oklahoma
> Gini index: 0.561
> Avg. household income, top 20%: $166,775 — 514th lowest of 1,775 cities
> Avg. household income, bottom 20%: $4,192 — 15th lowest of 1,775 cities
> Share of all income in Stillwater that went to top 20%: 57.7% — 28th highest of 1,775 cities
> Share of all income in Stillwater that went to bottom 20%: 1.5% — 15th lowest of 1,775 cities (tied)
> Median household income: $34,309 — 44th lowest of 1,775 cities

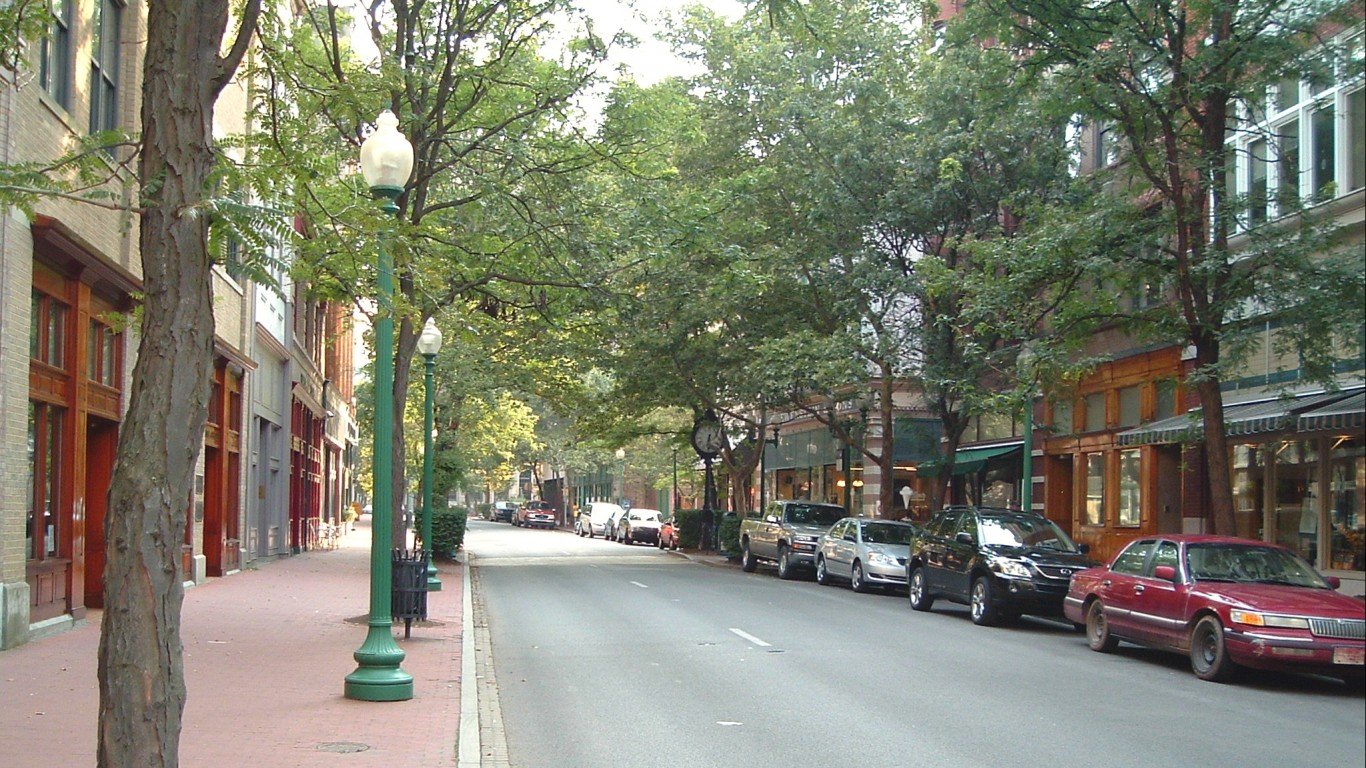
Source: Jeffness. / Wikimedia Commons
17. East Lansing, Michigan
> Gini index: 0.561
> Avg. household income, top 20%: $192,908 — 878th lowest of 1,775 cities
> Avg. household income, bottom 20%: $4,266 — 16th lowest of 1,775 cities
> Share of all income in East Lansing that went to top 20%: 57.3% — 42nd highest of 1,775 cities
> Share of all income in East Lansing that went to bottom 20%: 1.3% — 11th lowest of 1,775 cities
> Median household income: $39,867 — 129th lowest of 1,775 cities
[in-text-ad-2]
Source: Janabi / Getty Images
16. Valdosta, Georgia
> Gini index: 0.561
> Avg. household income, top 20%: $151,756 — 332nd lowest of 1,775 cities
> Avg. household income, bottom 20%: $2,899 — 6th lowest of 1,775 cities
> Share of all income in Valdosta that went to top 20%: 57.8% — 25th highest of 1,775 cities
> Share of all income in Valdosta that went to bottom 20%: 1.1% — 6th lowest of 1,775 cities
> Median household income: $32,595 — 30th lowest of 1,775 cities

Source: aimintang / E+ via Getty Images
15. Princeton, New Jersey
> Gini index: 0.563
> Avg. household income, top 20%: $688,791 — 9th highest of 1,775 cities
> Avg. household income, bottom 20%: $20,968 — 504th highest of 1,775 cities
> Share of all income in Princeton that went to top 20%: 58.8% — 17th highest of 1,775 cities
> Share of all income in Princeton that went to bottom 20%: 1.8% — 30th lowest of 1,775 cities (tied)
> Median household income: $137,672 — 53rd highest of 1,775 cities
[in-text-ad]
Source: ULora / Getty Images
14. Miami, Florida
> Gini index: 0.566
> Avg. household income, top 20%: $203,173 — 783rd highest of 1,775 cities
> Avg. household income, bottom 20%: $7,612 — 104th lowest of 1,775 cities
> Share of all income in Miami that went to top 20%: 59.7% — 11th highest of 1,775 cities
> Share of all income in Miami that went to bottom 20%: 2.2% — 80th lowest of 1,775 cities (tied)
> Median household income: $39,049 — 115th lowest of 1,775 cities
 24/7 Wall St.
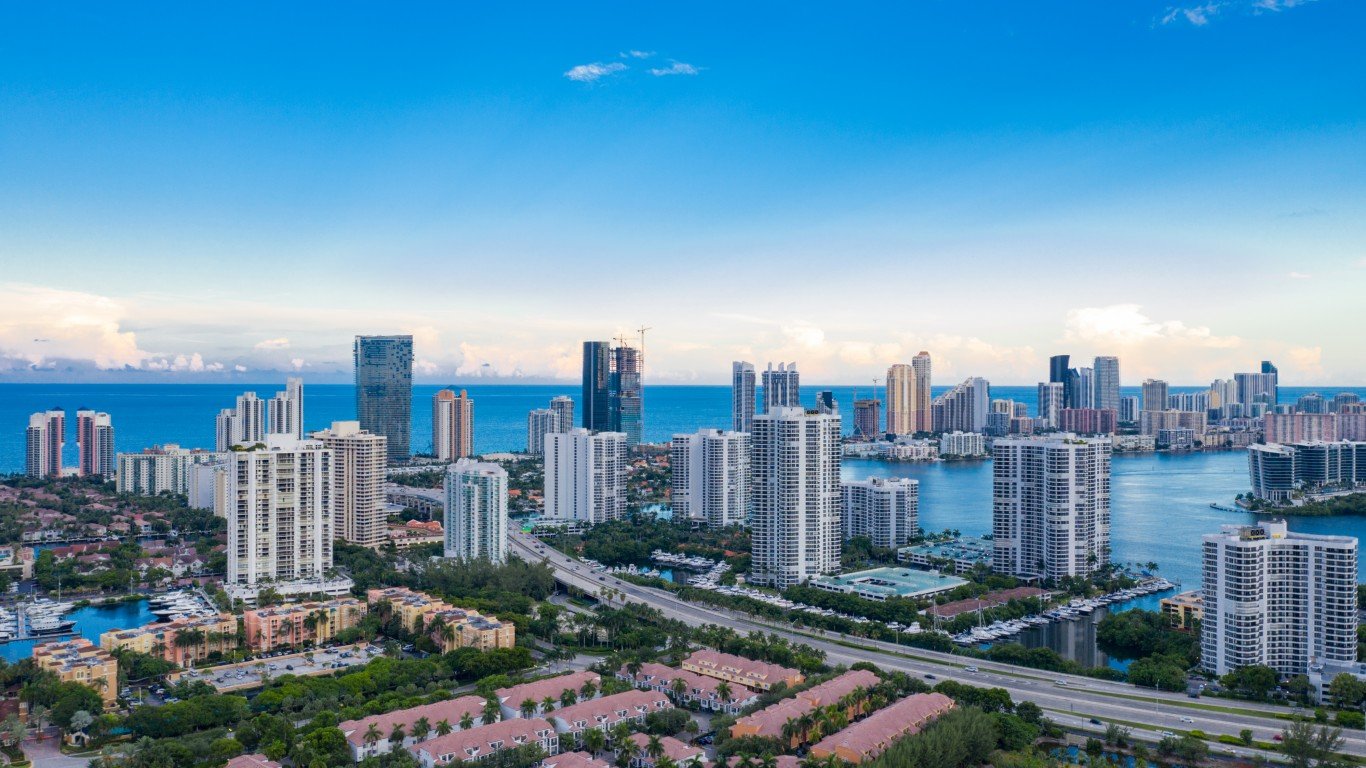
Source: felixmizioznikov / iStock via Getty Images
13. Aventura, Florida
> Gini index: 0.569
> Avg. household income, top 20%: $333,755 — 171st highest of 1,775 cities
> Avg. household income, bottom 20%: $10,968 — 387th lowest of 1,775 cities
> Share of all income in Aventura that went to top 20%: 59.6% — 12th highest of 1,775 cities
> Share of all income in Aventura that went to bottom 20%: 2.0% — 42nd lowest of 1,775 cities
> Median household income: $63,892 — 884th highest of 1,775 cities

Source: benedek / iStock via Getty Images
12. State College, Pennsylvania
> Gini index: 0.569
> Avg. household income, top 20%: $171,136 — 579th lowest of 1,775 cities
> Avg. household income, bottom 20%: $2,771 — 5th lowest of 1,775 cities
> Share of all income in State College that went to top 20%: 59.0% — 16th highest of 1,775 cities
> Share of all income in State College that went to bottom 20%: 0.9% — 3rd lowest of 1,775 cities
> Median household income: $34,005 — 41st lowest of 1,775 cities
[in-text-ad-2]

Source: SeanPavonePhoto / Getty Images
11. New Orleans, Louisiana
> Gini index: 0.57
> Avg. household income, top 20%: $214,081 — 667th highest of 1,775 cities
> Avg. household income, bottom 20%: $6,684 — 53rd lowest of 1,775 cities
> Share of all income in New Orleans that went to top 20%: 59.5% — 14th highest of 1,775 cities
> Share of all income in New Orleans that went to bottom 20%: 1.9% — 37th lowest of 1,775 cities
> Median household income: $41,604 — 170th lowest of 1,775 cities

Source: akrassel / iStock via Getty Images
10. West Lafayette, Indiana
> Gini index: 0.578
> Avg. household income, top 20%: $194,561 — 872nd highest of 1,775 cities
> Avg. household income, bottom 20%: $3,574 — 10th lowest of 1,775 cities
> Share of all income in West Lafayette that went to top 20%: 59.7% — 10th highest of 1,775 cities
> Share of all income in West Lafayette that went to bottom 20%: 1.1% — 7th lowest of 1,775 cities
> Median household income: $34,650 — 47th lowest of 1,775 cities
[in-text-ad]

9. University City, Missouri
> Gini index: 0.578
> Avg. household income, top 20%: $351,188 — 137th highest of 1,775 cities
> Avg. household income, bottom 20%: $10,283 — 316th lowest of 1,775 cities
> Share of all income in University City that went to top 20%: 61.2% — 6th highest of 1,775 cities
> Share of all income in University City that went to bottom 20%: 1.8% — 30th lowest of 1,775 cities (tied)
> Median household income: $61,274 — 802nd lowest of 1,775 cities
Source: Boogich / iStock Unreleased via Getty Images
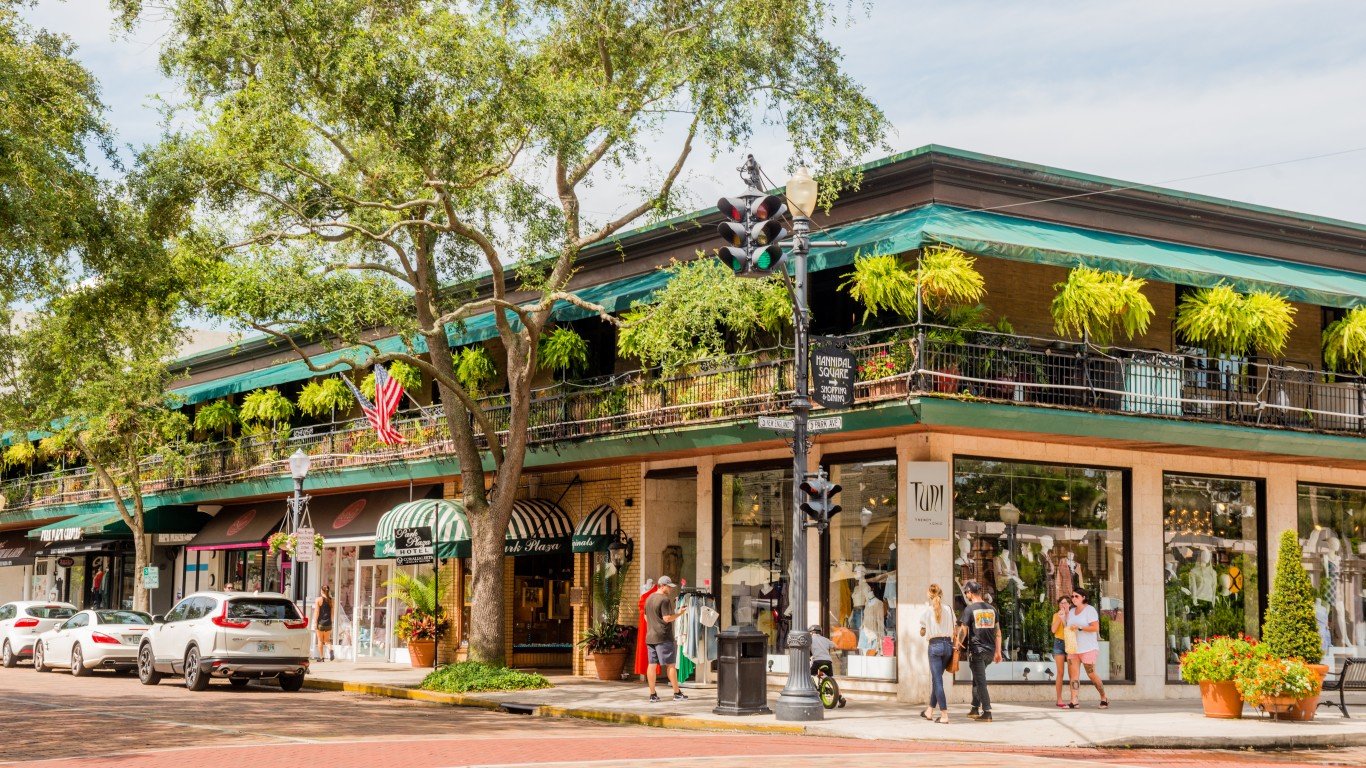
8. Winter Park, Florida
> Gini index: 0.581
> Avg. household income, top 20%: $458,994 — 47th highest of 1,775 cities
> Avg. household income, bottom 20%: $15,398 — 846th lowest of 1,775 cities
> Share of all income in Winter Park that went to top 20%: 61.7% — 5th highest of 1,775 cities
> Share of all income in Winter Park that went to bottom 20%: 2.1% — 58th lowest of 1,775 cities
> Median household income: $77,899 — 579th highest of 1,775 cities

Source: rodclementphotography / iStock via Getty Images
7. Atlanta, Georgia
> Gini index: 0.581
> Avg. household income, top 20%: $324,646 — 183rd highest of 1,775 cities
> Avg. household income, bottom 20%: $9,684 — 264th lowest of 1,775 cities
> Share of all income in Atlanta that went to top 20%: 61.1% — 7th highest of 1,775 cities
> Share of all income in Atlanta that went to bottom 20%: 1.8% — 33rd lowest of 1,775 cities (tied)
> Median household income: $59,948 — 770th lowest of 1,775 cities
[in-text-ad-2]

Source: benedek / Getty Images
6. Ithaca, New York
> Gini index: 0.583
> Avg. household income, top 20%: $185,171 — 769th lowest of 1,775 cities
> Avg. household income, bottom 20%: $3,177 — 7th lowest of 1,775 cities
> Share of all income in Ithaca that went to top 20%: 60.1% — 9th highest of 1,775 cities
> Share of all income in Ithaca that went to bottom 20%: 1.0% — 4th lowest of 1,775 cities
> Median household income: $34,424 — 45th lowest of 1,775 cities

5. Beverly Hills, California
> Gini index: 0.586
> Avg. household income, top 20%: $611,101 — 21st highest of 1,775 cities
> Avg. household income, bottom 20%: $15,251 — 838th lowest of 1,775 cities
> Share of all income in Beverly Hills that went to top 20%: 62.5% — 3rd highest of 1,775 cities
> Share of all income in Beverly Hills that went to bottom 20%: 1.6% — 21st lowest of 1,775 cities
> Median household income: $106,936 — 194th highest of 1,775 cities
[in-text-ad]
Source: Smash the Iron Cage / Wikimedia Commons
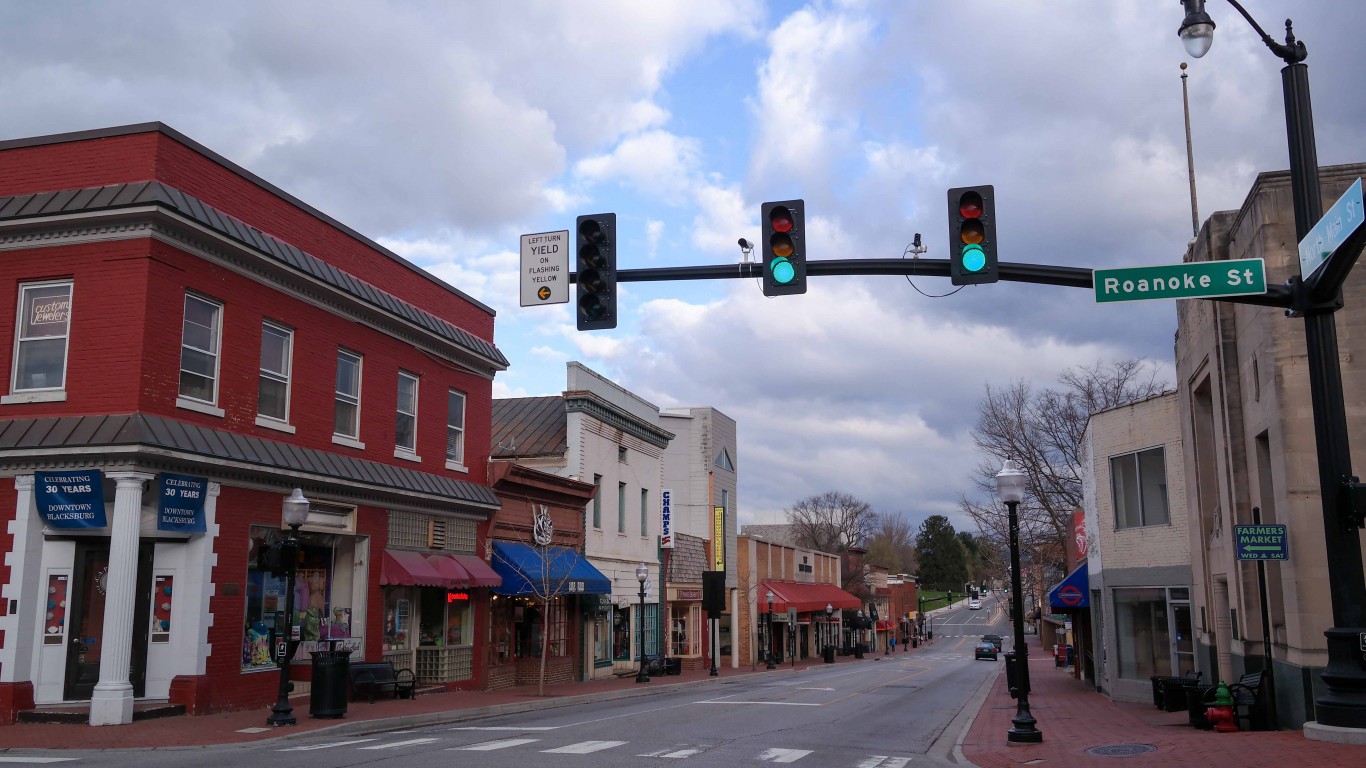
4. Blacksburg, Virginia
> Gini index: 0.588
> Avg. household income, top 20%: $210,738 — 694th highest of 1,775 cities
> Avg. household income, bottom 20%: $1,776 — the lowest of 1,775 cities
> Share of all income in Blacksburg that went to top 20%: 59.5% — 13th highest of 1,775 cities
> Share of all income in Blacksburg that went to bottom 20%: 0.5% — the lowest of 1,775 cities
> Median household income: $43,173 — 213th lowest of 1,775 cities

Source: DenisTangneyJr / iStock via Getty Images
3. Monroe, Louisiana
> Gini index: 0.591
> Avg. household income, top 20%: $172,713 — 606th lowest of 1,775 cities
> Avg. household income, bottom 20%: $4,817 — 18th lowest of 1,775 cities
> Share of all income in Monroe that went to top 20%: 62.2% — 4th highest of 1,775 cities
> Share of all income in Monroe that went to bottom 20%: 1.7% — 26th lowest of 1,775 cities
> Median household income: $30,438 — 14th lowest of 1,775 cities
Source: Xjbri / Wikimedia Commons
2. Carbondale, Illinois
> Gini index: 0.599
> Avg. household income, top 20%: $141,616 — 228th lowest of 1,775 cities
> Avg. household income, bottom 20%: $2,600 — 3rd lowest of 1,775 cities
> Share of all income in Carbondale that went to top 20%: 62.5% — 2nd highest of 1,775 cities
> Share of all income in Carbondale that went to bottom 20%: 1.1% — 8th lowest of 1,775 cities
> Median household income: $22,152 — the lowest of 1,775 cities
[in-text-ad-2]
Source: James Willamor / Wikimedia Commons
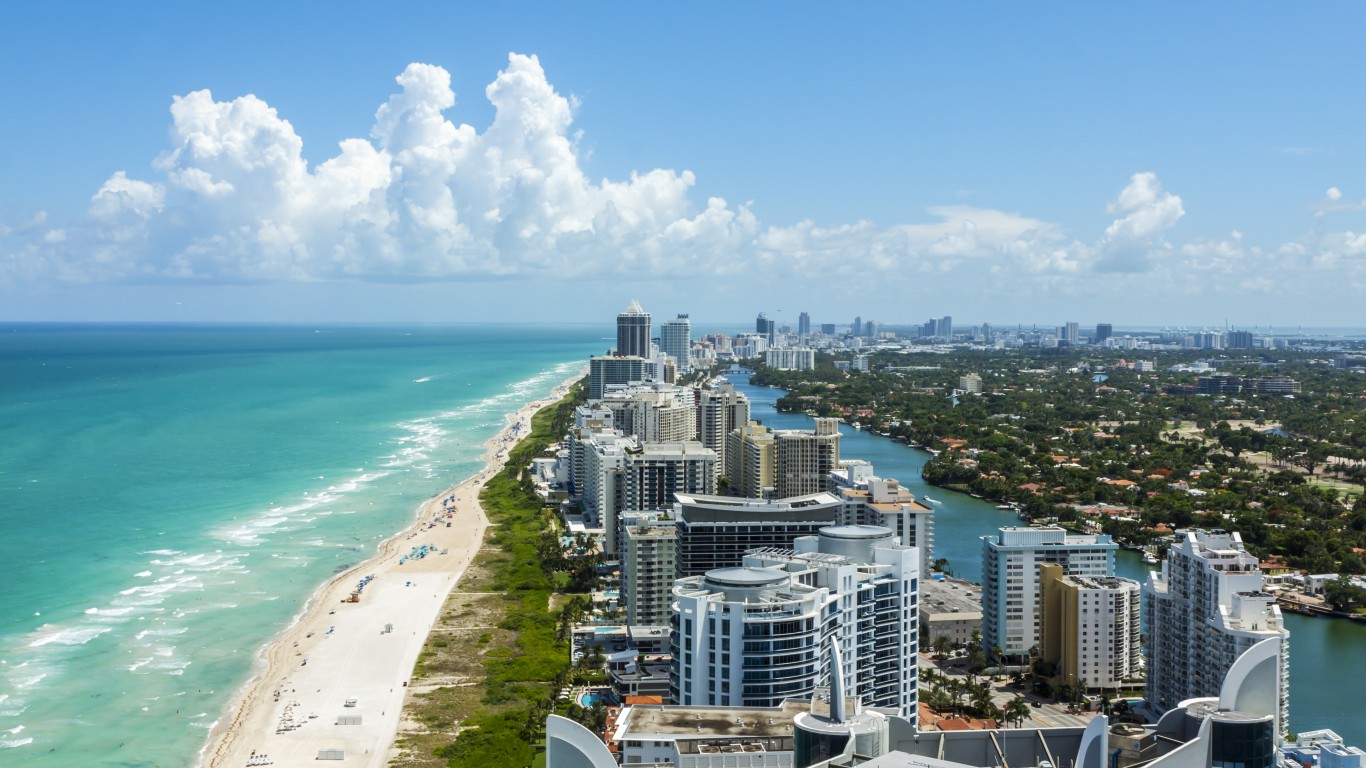
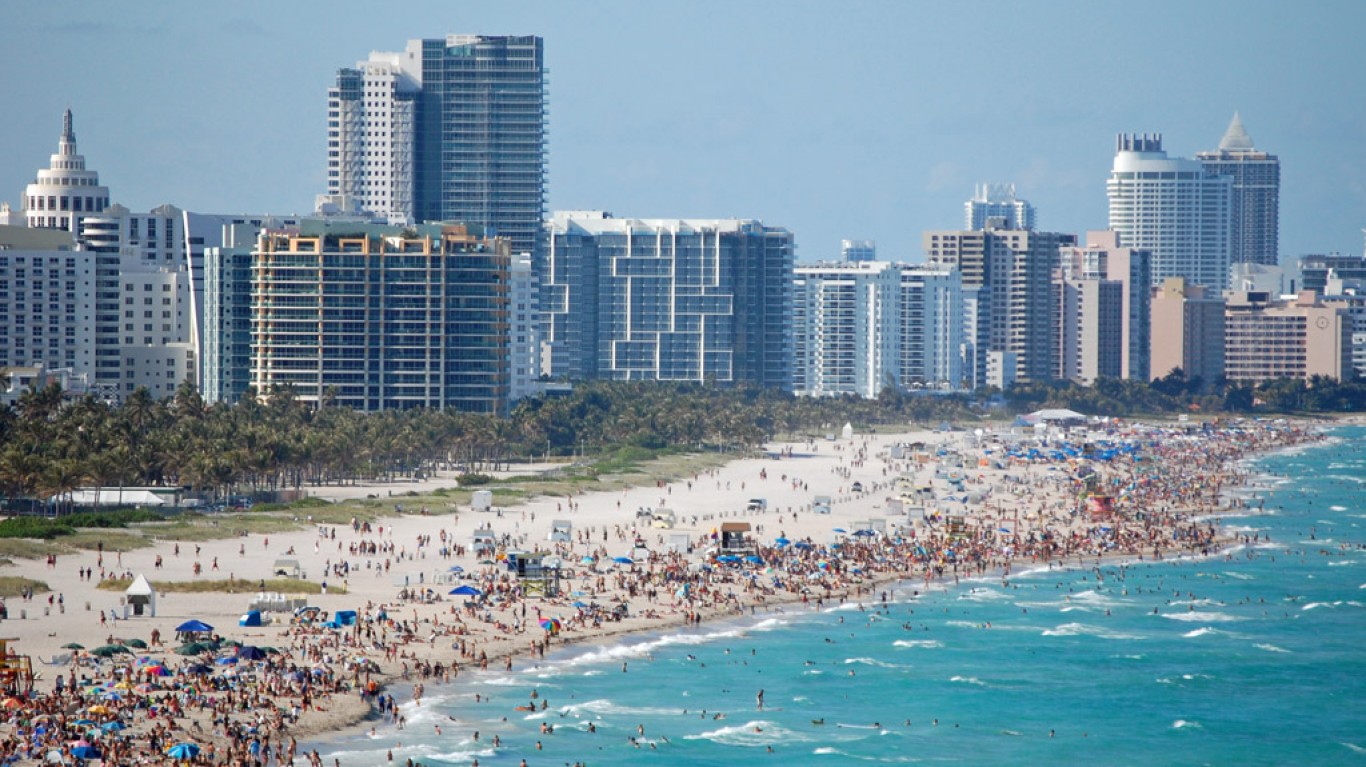
1. Miami Beach, Florida
> Gini index: 0.606
> Avg. household income, top 20%: $343,868 — 150th highest of 1,775 cities
> Avg. household income, bottom 20%: $10,886 — 382nd lowest of 1,775 cities
> Share of all income in Miami Beach that went to top 20%: 64.4% — the highest of 1,775 cities
> Share of all income in Miami Beach that went to bottom 20%: 2.0% — 55th lowest of 1,775 cities (tied)
> Median household income: $53,971 — 591st lowest of 1,775 cities
To determine the cities with the widest income gaps in the nation, 24/7 Wall St. reviewed five-year estimates of the Gini Index of income inequality from the U.S. Census Bureau’s 2019 American Community Survey.
The Gini Index of income inequality summarizes income dispersion in an area on a scale from 0 to 1. A value of 0 indicates perfect equality — everyone in the area receives an equal share of income. A value of 1 indicates perfect inequality — only one recipient receives all the income.
We used census “place” geographies — a category that includes 29,573 incorporated legal entities and census-designated statistical entities. Of those, 29,320 had boundaries that fell within one of the 50 states or the District of Columbia.
We defined cities based on a population threshold — having more than 25,000 people — and 1,775 of the places fell within this threshold.
Cities were ranked based on their Gini Index. To break ties, we used the share of aggregate household income earned by the top 20% of households.
Additional information on average household income by quintile, share of aggregate household income by quintile, and median household income are also five-year estimates from the 2019 ACS.
Take This Retirement Quiz To Get Matched With A Financial Advisor (Sponsored)
Take the quiz below to get matched with a financial advisor today.
Each advisor has been vetted by SmartAsset and is held to a fiduciary standard to act in your best interests.
Here’s how it works:
1. Answer SmartAsset advisor match quiz
2. Review your pre-screened matches at your leisure. Check out the
advisors’ profiles.
3. Speak with advisors at no cost to you. Have an introductory call on the phone or introduction in person and choose whom to work with in the future
Take the retirement quiz right here.
Thank you for reading! Have some feedback for us?
Contact the 24/7 Wall St. editorial team.
Editors' Picks