
The United States has some of the highest levels of income and wealth inequality in the world. U.S. Federal Reserve data shows that the wealthiest 10% of Americans control $93.8 trillion, more than double the $40.3 trillion in the hands of the remaining 90% of Americans.
The income and wealth divide only appears to be growing wider. A January 2020 report published by the Pew Research Center found that over the last four decades, income growth for the top 5% of families by earnings has far outpaced income growth for families in lower income strata.
In a nation as large as the U.S., varied levels of income inequality may be expected. While some parts have wide income gaps, other parts of the country are defined, at least in part, by their relative income equality.
Using data from the U.S. Census Bureau’s 2019 American Community Survey, 24/7 Wall St. identified the 50 U.S. cities with the smallest income gaps. Cities are ranked by their Gini coefficient, a measure of income inequality based on the distribution of income across a population on a 0 to 1 scale — 0 representing perfect equality and 1 representing the highest possible level of inequality. For the purposes of this story, cities are defined as any place covered by the census with populations over 25,000.
Among the cities on this list, Gini scores range from 0.357 down to 0.282 — well below the national Gini coefficient of 0.482. The places on this list span the country but tend to be concentrated in Western states. Utah alone is home to 11 cities on this list.
Incomes are generally high in the places on this list. All but two of the 50 cities with the lowest income inequality have a higher median household income than the national median of $62,843.
Causes behind rising inequality are complex and varied. A report published by the National Bureau of Economic Research ties the rising disparity to a range of economic factors, including globalization, technological advancement, a stagnant minimum wage, and the decline of labor unions.
Click here to see America’s cities with the smallest income gaps
Click here to read our detailed methodology

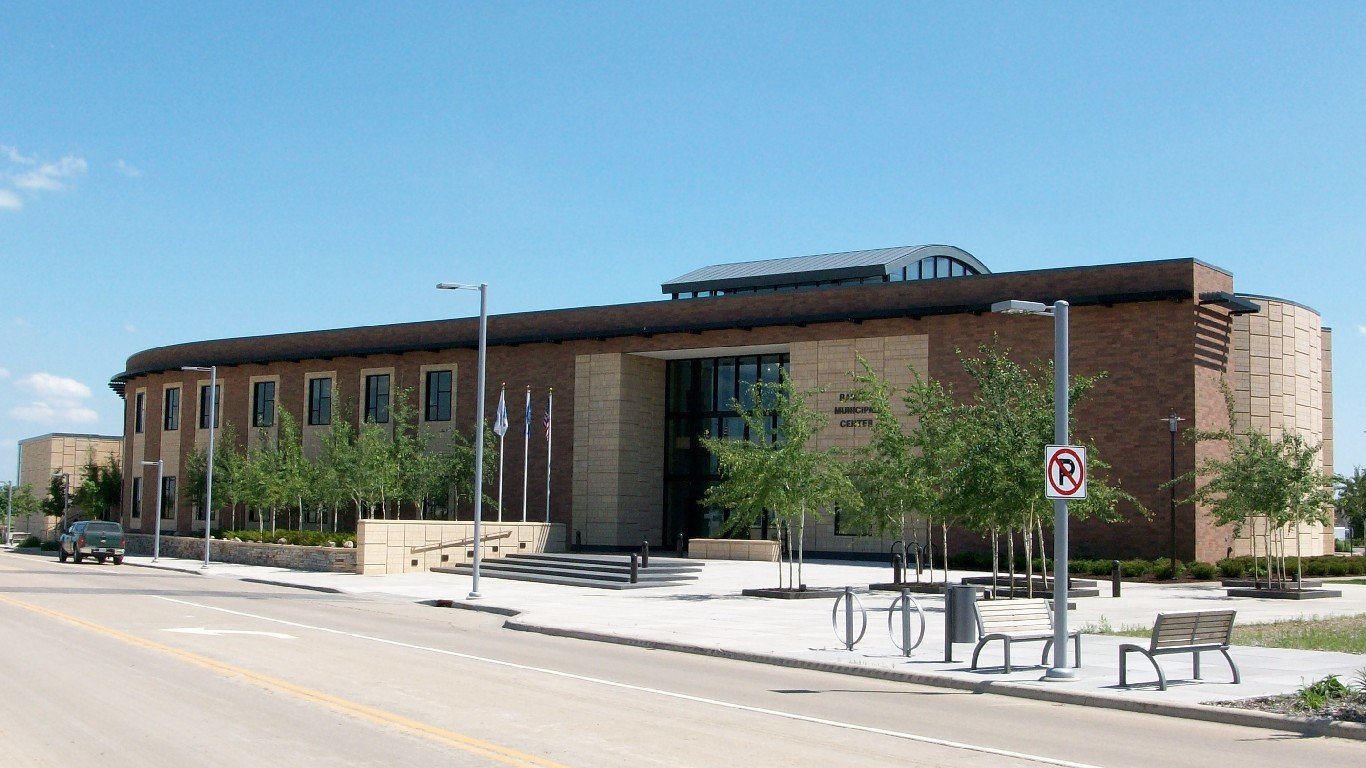
50. Antelope, California
> Gini index: 0.357
> Avg. household income, top 20%: $185,112 — 768th lowest of 1,775 cities
> Avg. household income, bottom 20%: $23,520 — 355th highest of 1,775 cities
> Share of all income in Antelope that went to top 20%: 41.0% — 59th lowest of 1,775 cities
> Share of all income in Antelope that went to bottom 20%: 5.2% — 81st highest of 1,775 cities (tied)
> Median household income: $80,998 — 513th highest of 1,775 cities
[in-text-ad]
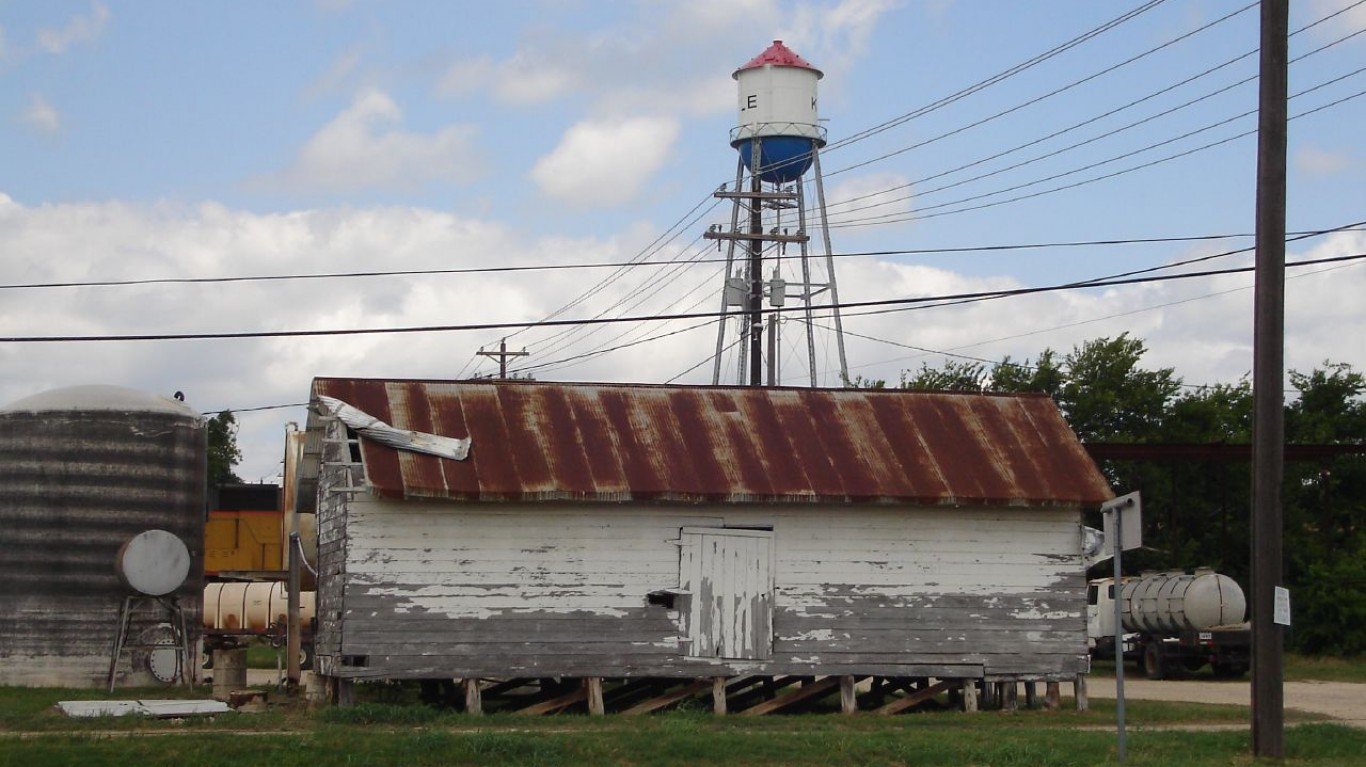
49. Midlothian, Texas
> Gini index: 0.357
> Avg. household income, top 20%: $212,587 — 676th highest of 1,775 cities
> Avg. household income, bottom 20%: $25,539 — 262nd highest of 1,775 cities
> Share of all income in Midlothian that went to top 20%: 40.4% — 40th lowest of 1,775 cities
> Share of all income in Midlothian that went to bottom 20%: 4.9% — 164th highest of 1,775 cities (tied)
> Median household income: $95,306 — 312th highest of 1,775 cities
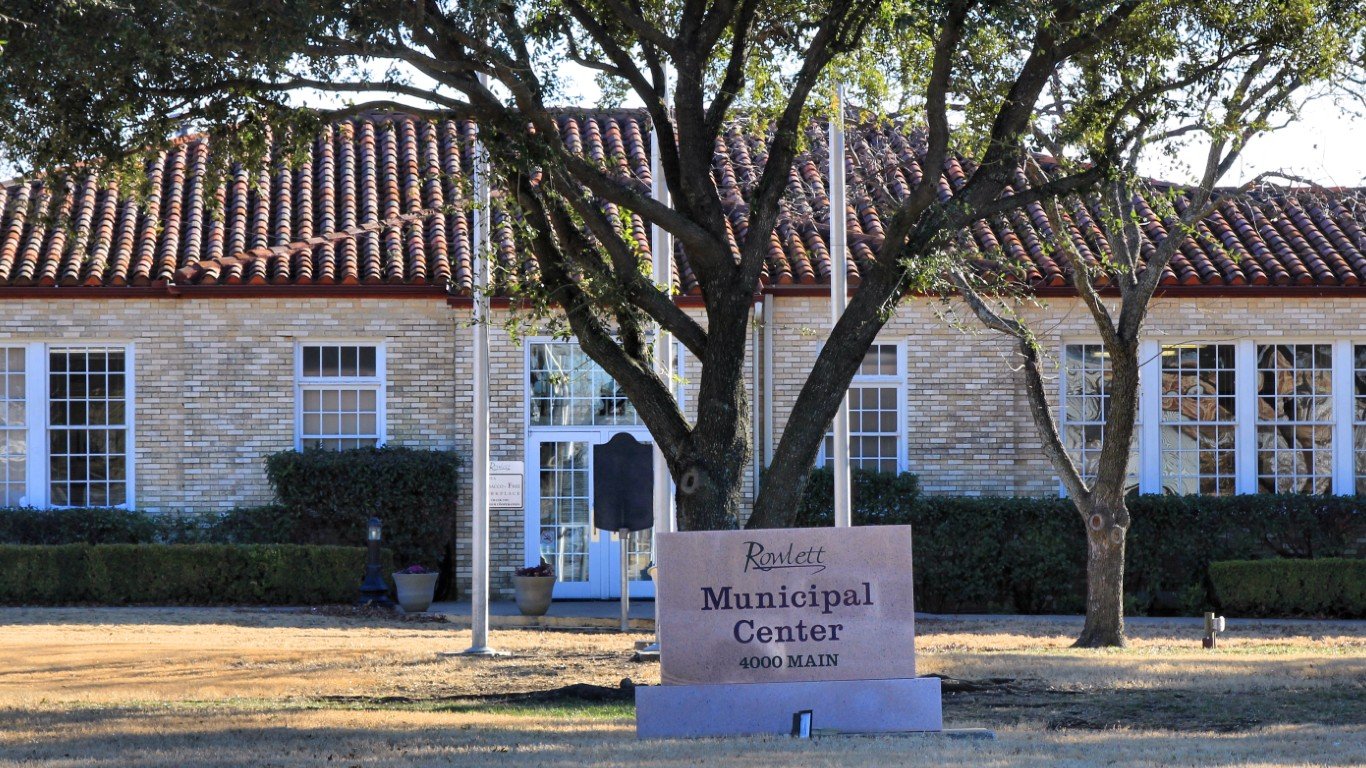
48. Rowlett, Texas
> Gini index: 0.356
> Avg. household income, top 20%: $233,618 — 536th highest of 1,775 cities
> Avg. household income, bottom 20%: $30,656 — 119th highest of 1,775 cities
> Share of all income in Rowlett that went to top 20%: 41.0% — 60th lowest of 1,775 cities
> Share of all income in Rowlett that went to bottom 20%: 5.4% — 54th highest of 1,775 cities (tied)
> Median household income: $101,085 — 247th highest of 1,775 cities
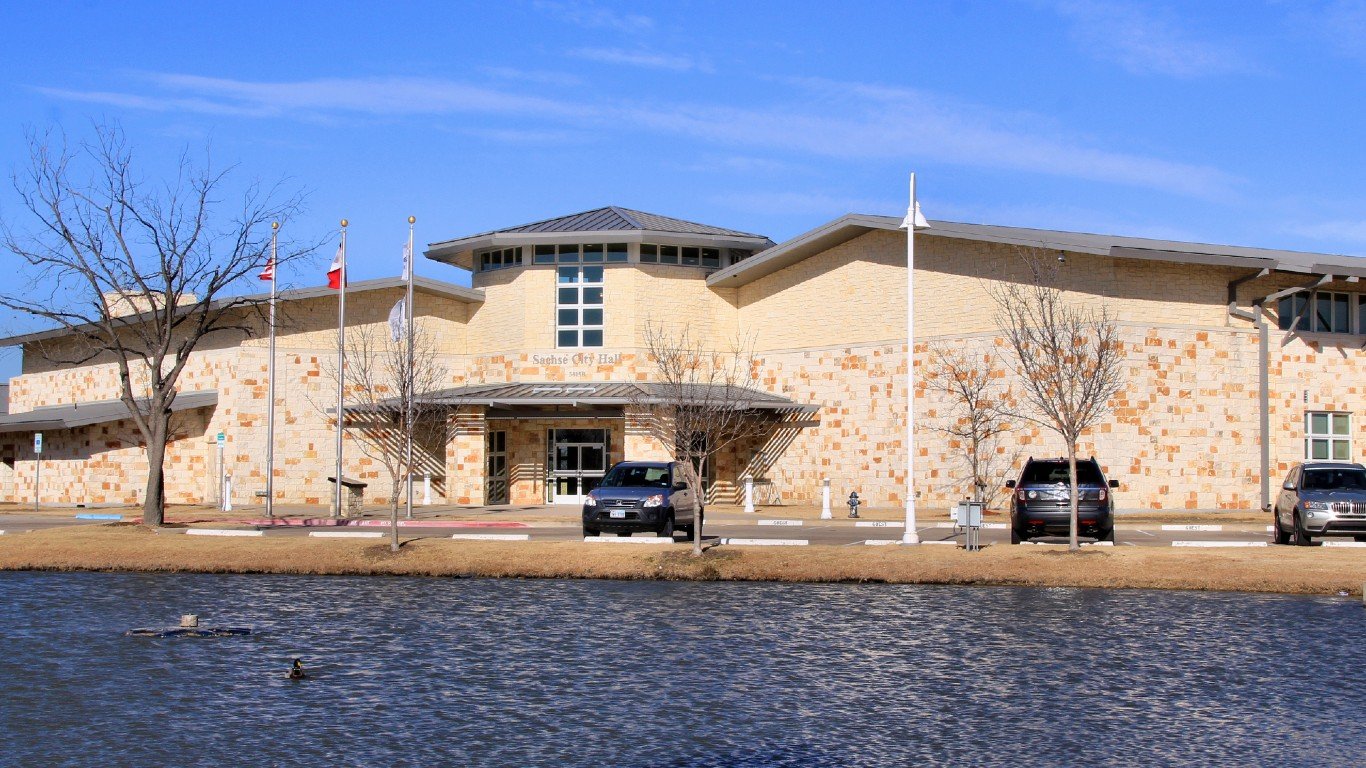
47. Sachse, Texas
> Gini index: 0.355
> Avg. household income, top 20%: $244,217 — 474th highest of 1,775 cities
> Avg. household income, bottom 20%: $35,872 — 49th highest of 1,775 cities
> Share of all income in Sachse that went to top 20%: 41.6% — 85th lowest of 1,775 cities (tied)
> Share of all income in Sachse that went to bottom 20%: 6.1% — 19th highest of 1,775 cities (tied)
> Median household income: $102,175 — 230th highest of 1,775 cities
[in-text-ad-2]
46. Jeffersontown, Kentucky
> Gini index: 0.354
> Avg. household income, top 20%: $166,616 — 510th lowest of 1,775 cities
> Avg. household income, bottom 20%: $23,850 — 340th highest of 1,775 cities
> Share of all income in Jeffersontown that went to top 20%: 41.0% — 61st lowest of 1,775 cities
> Share of all income in Jeffersontown that went to bottom 20%: 5.9% — 25th highest of 1,775 cities
> Median household income: $68,803 — 775th highest of 1,775 cities
45. Fountain, Colorado
> Gini index: 0.353
> Avg. household income, top 20%: $152,923 — 345th lowest of 1,775 cities
> Avg. household income, bottom 20%: $20,711 — 527th highest of 1,775 cities
> Share of all income in Fountain that went to top 20%: 40.8% — 52nd lowest of 1,775 cities
> Share of all income in Fountain that went to bottom 20%: 5.5% — 42nd highest of 1,775 cities
> Median household income: $64,582 — 870th highest of 1,775 cities
[in-text-ad]

44. Parker, Colorado
> Gini index: 0.352
> Avg. household income, top 20%: $256,732 — 394th highest of 1,775 cities
> Avg. household income, bottom 20%: $34,507 — 63rd highest of 1,775 cities
> Share of all income in Parker that went to top 20%: 40.4% — 36th lowest of 1,775 cities (tied)
> Share of all income in Parker that went to bottom 20%: 5.4% — 50th highest of 1,775 cities
> Median household income: $110,934 — 148th highest of 1,775 cities
43. Dakota Ridge, Colorado
> Gini index: 0.352
> Avg. household income, top 20%: $233,911 — 534th highest of 1,775 cities
> Avg. household income, bottom 20%: $31,901 — 96th highest of 1,775 cities
> Share of all income in Dakota Ridge that went to top 20%: 40.8% — 50th lowest of 1,775 cities
> Share of all income in Dakota Ridge that went to bottom 20%: 5.6% — 39th highest of 1,775 cities
> Median household income: $100,438 — 254th highest of 1,775 cities
42. Clearfield, Utah
> Gini index: 0.352
> Avg. household income, top 20%: $135,791 — 152nd lowest of 1,775 cities
> Avg. household income, bottom 20%: $16,364 — 833rd highest of 1,775 cities (tied)
> Share of all income in Clearfield that went to top 20%: 40.0% — 29th lowest of 1,775 cities
> Share of all income in Clearfield that went to bottom 20%: 4.8% — 178th highest of 1,775 cities (tied)
> Median household income: $60,260 — 777th lowest of 1,775 cities
[in-text-ad-2]
41. Levittown, New York
> Gini index: 0.352
> Avg. household income, top 20%: $266,934 — 340th highest of 1,775 cities
> Avg. household income, bottom 20%: $33,309 — 78th highest of 1,775 cities
> Share of all income in Levittown that went to top 20%: 40.0% — 28th lowest of 1,775 cities
> Share of all income in Levittown that went to bottom 20%: 5.0% — 127th highest of 1,775 cities (tied)
> Median household income: $124,995 — 83rd highest of 1,775 cities
40. Alabaster, Alabama
> Gini index: 0.351
> Avg. household income, top 20%: $175,155 — 641st lowest of 1,775 cities
> Avg. household income, bottom 20%: $23,147 — 372nd highest of 1,775 cities
> Share of all income in Alabaster that went to top 20%: 39.6% — 21st lowest of 1,775 cities (tied)
> Share of all income in Alabaster that went to bottom 20%: 5.3% — 73rd highest of 1,775 cities (tied)
> Median household income: $80,072 — 533rd highest of 1,775 cities
[in-text-ad]
39. Lake in the Hills, Illinois
> Gini index: 0.351
> Avg. household income, top 20%: $218,797 — 631st highest of 1,775 cities
> Avg. household income, bottom 20%: $29,382 — 146th highest of 1,775 cities
> Share of all income in Lake in the Hills that went to top 20%: 40.7% — 49th lowest of 1,775 cities
> Share of all income in Lake in the Hills that went to bottom 20%: 5.5% — 47th highest of 1,775 cities (tied)
> Median household income: $92,872 — 346th highest of 1,775 cities
38. Wentzville, Missouri
> Gini index: 0.351
> Avg. household income, top 20%: $203,715 — 777th highest of 1,775 cities
> Avg. household income, bottom 20%: $25,442 — 269th highest of 1,775 cities
> Share of all income in Wentzville that went to top 20%: 40.4% — 36th lowest of 1,775 cities (tied)
> Share of all income in Wentzville that went to bottom 20%: 5.1% — 110th highest of 1,775 cities (tied)
> Median household income: $90,403 — 378th highest of 1,775 cities
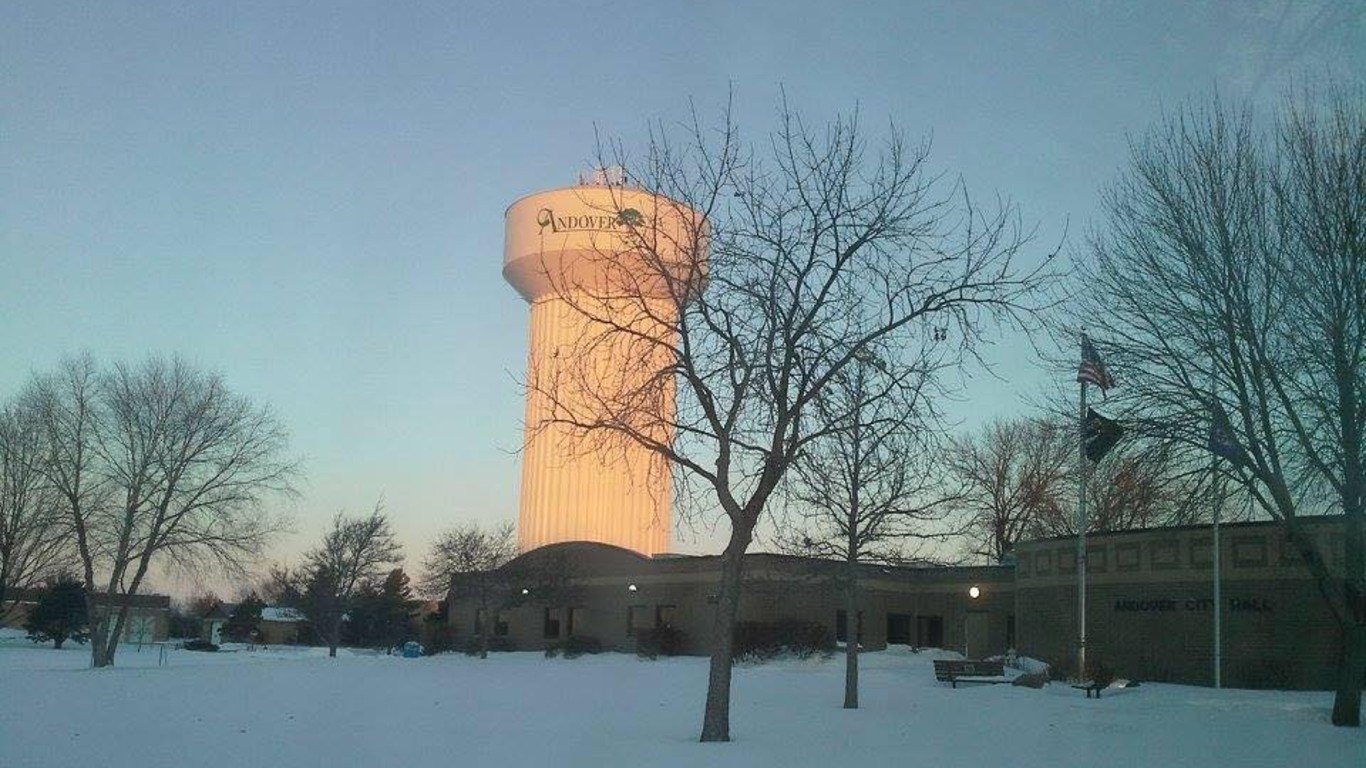
37. Andover, Minnesota
> Gini index: 0.351
> Avg. household income, top 20%: $259,051 — 381st highest of 1,775 cities
> Avg. household income, bottom 20%: $37,468 — 38th highest of 1,775 cities
> Share of all income in Andover that went to top 20%: 40.9% — 56th lowest of 1,775 cities
> Share of all income in Andover that went to bottom 20%: 5.9% — 21st highest of 1,775 cities
> Median household income: $109,930 — 156th highest of 1,775 cities
[in-text-ad-2]
36. West Jordan, Utah
> Gini index: 0.35
> Avg. household income, top 20%: $188,096 — 814th lowest of 1,775 cities
> Avg. household income, bottom 20%: $26,514 — 228th highest of 1,775 cities
> Share of all income in West Jordan that went to top 20%: 40.6% — 45th lowest of 1,775 cities
> Share of all income in West Jordan that went to bottom 20%: 5.7% — 30th highest of 1,775 cities (tied)
> Median household income: $80,955 — 514th highest of 1,775 cities
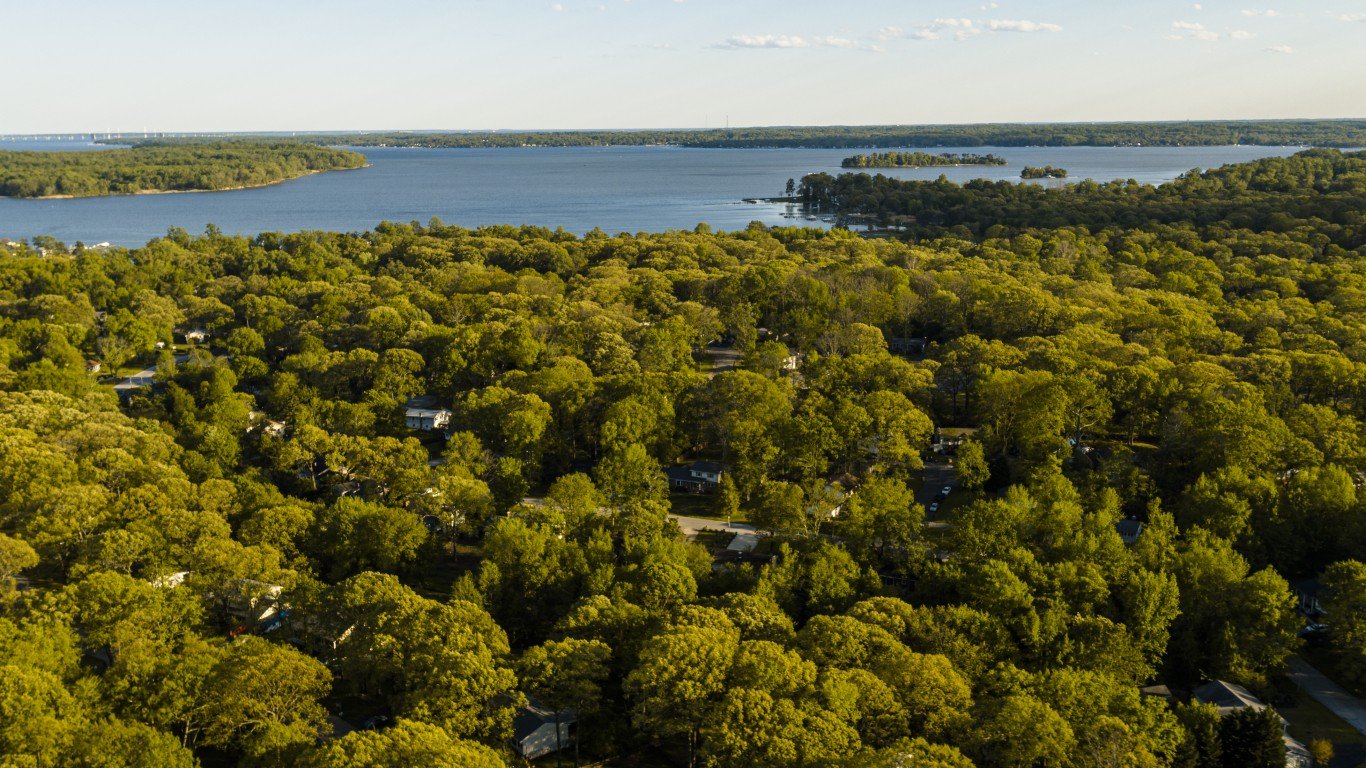
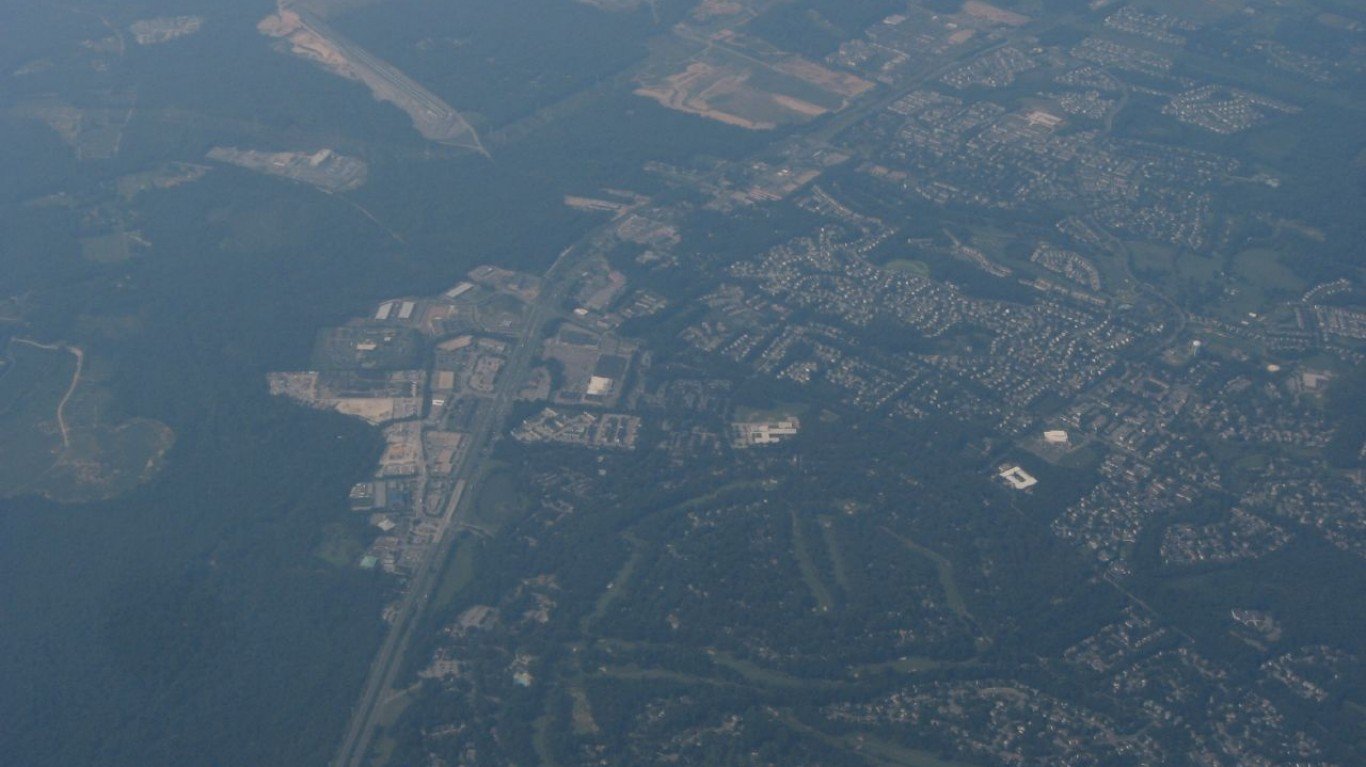
35. Pasadena, Maryland
> Gini index: 0.35
> Avg. household income, top 20%: $233,343 — 538th highest of 1,775 cities
> Avg. household income, bottom 20%: $34,591 — 60th highest of 1,775 cities
> Share of all income in Pasadena that went to top 20%: 41.2% — 72nd lowest of 1,775 cities
> Share of all income in Pasadena that went to bottom 20%: 6.1% — 19th highest of 1,775 cities (tied)
> Median household income: $96,575 — 290th highest of 1,775 cities
[in-text-ad]
34. El Mirage, Arizona
> Gini index: 0.349
> Avg. household income, top 20%: $134,858 — 143rd lowest of 1,775 cities
> Avg. household income, bottom 20%: $18,800 — 656th highest of 1,775 cities
> Share of all income in El Mirage that went to top 20%: 40.3% — 35th lowest of 1,775 cities
> Share of all income in El Mirage that went to bottom 20%: 5.6% — 35th highest of 1,775 cities
> Median household income: $58,216 — 721st lowest of 1,775 cities
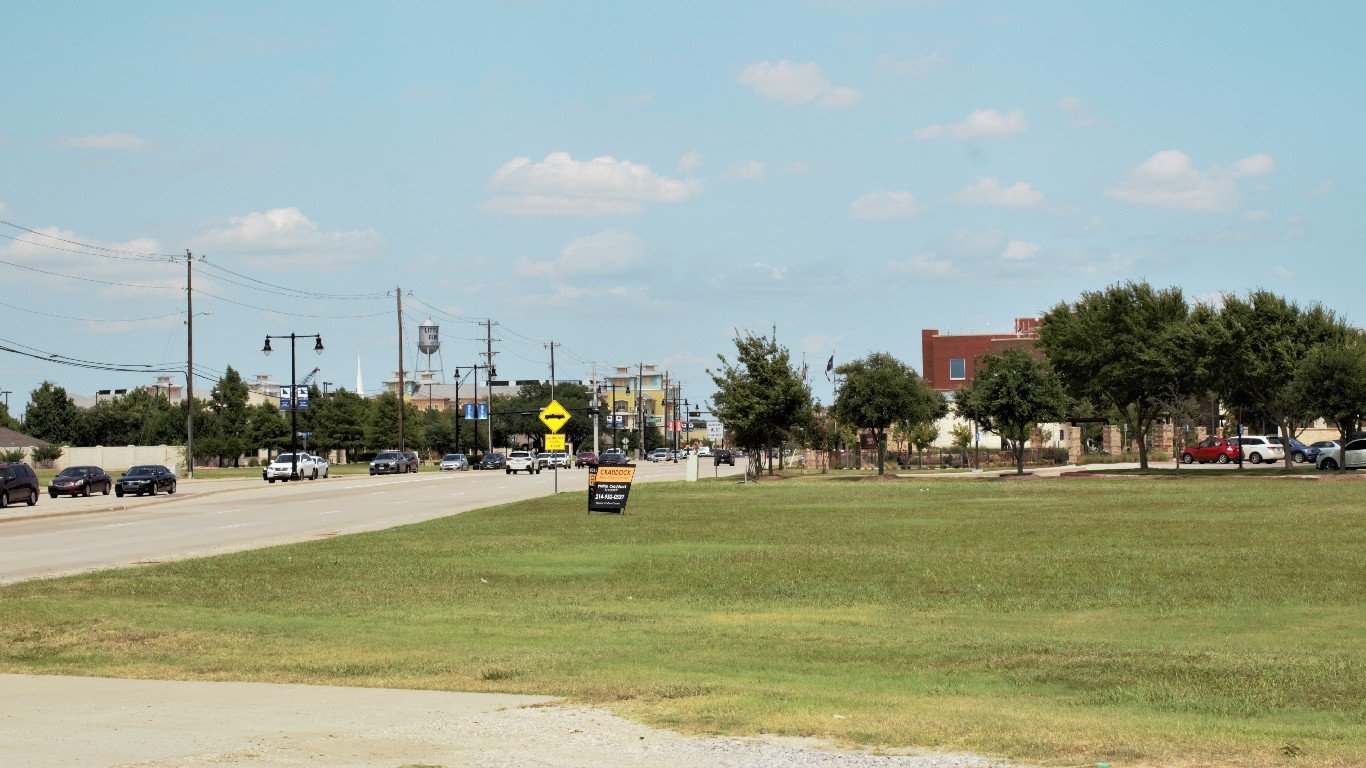
33. Little Elm, Texas
> Gini index: 0.349
> Avg. household income, top 20%: $218,258 — 638th highest of 1,775 cities
> Avg. household income, bottom 20%: $29,159 — 149th highest of 1,775 cities
> Share of all income in Little Elm that went to top 20%: 39.6% — 21st lowest of 1,775 cities (tied)
> Share of all income in Little Elm that went to bottom 20%: 5.3% — 66th highest of 1,775 cities (tied)
> Median household income: $98,803 — 272nd highest of 1,775 cities
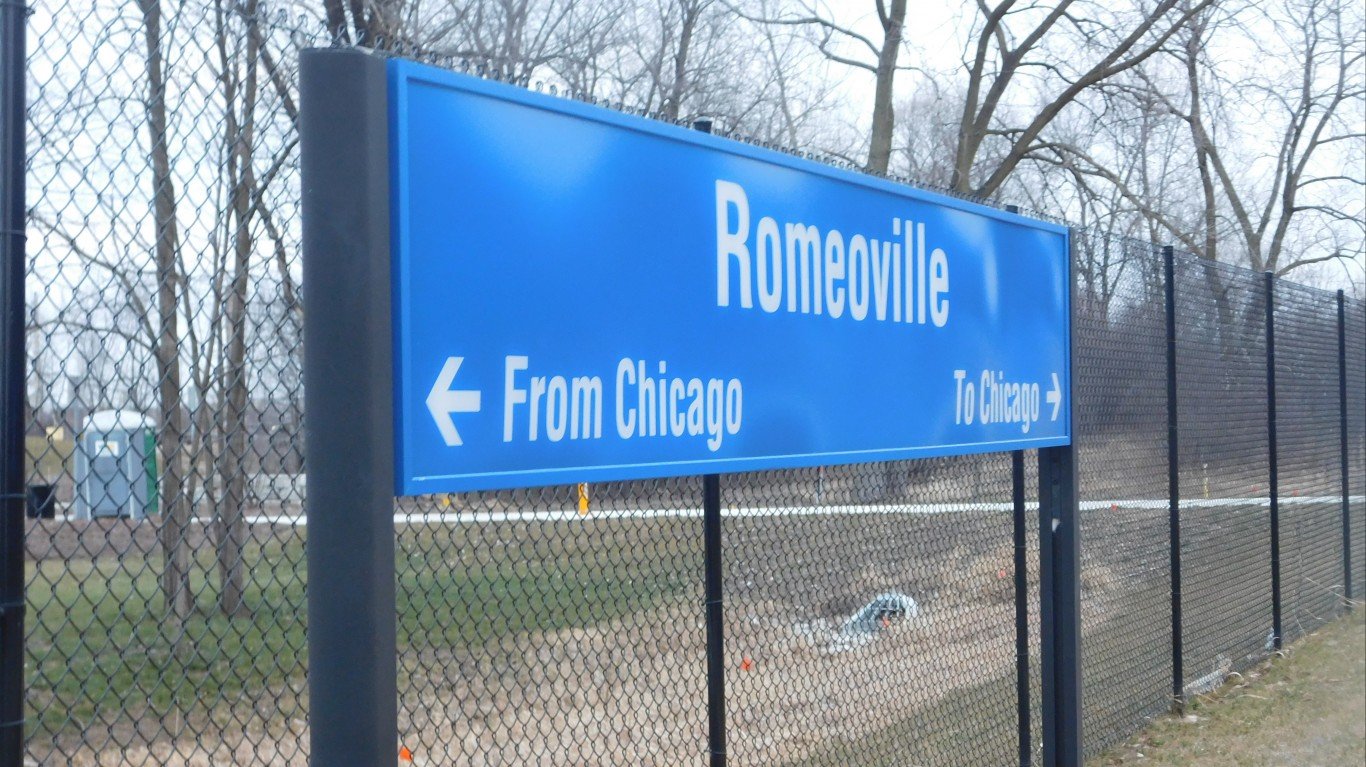
32. Romeoville, Illinois
> Gini index: 0.345
> Avg. household income, top 20%: $176,582 — 659th lowest of 1,775 cities
> Avg. household income, bottom 20%: $24,541 — 304th highest of 1,775 cities
> Share of all income in Romeoville that went to top 20%: 39.9% — 26th lowest of 1,775 cities (tied)
> Share of all income in Romeoville that went to bottom 20%: 5.5% — 41st highest of 1,775 cities
> Median household income: $79,183 — 552nd highest of 1,775 cities
[in-text-ad-2]
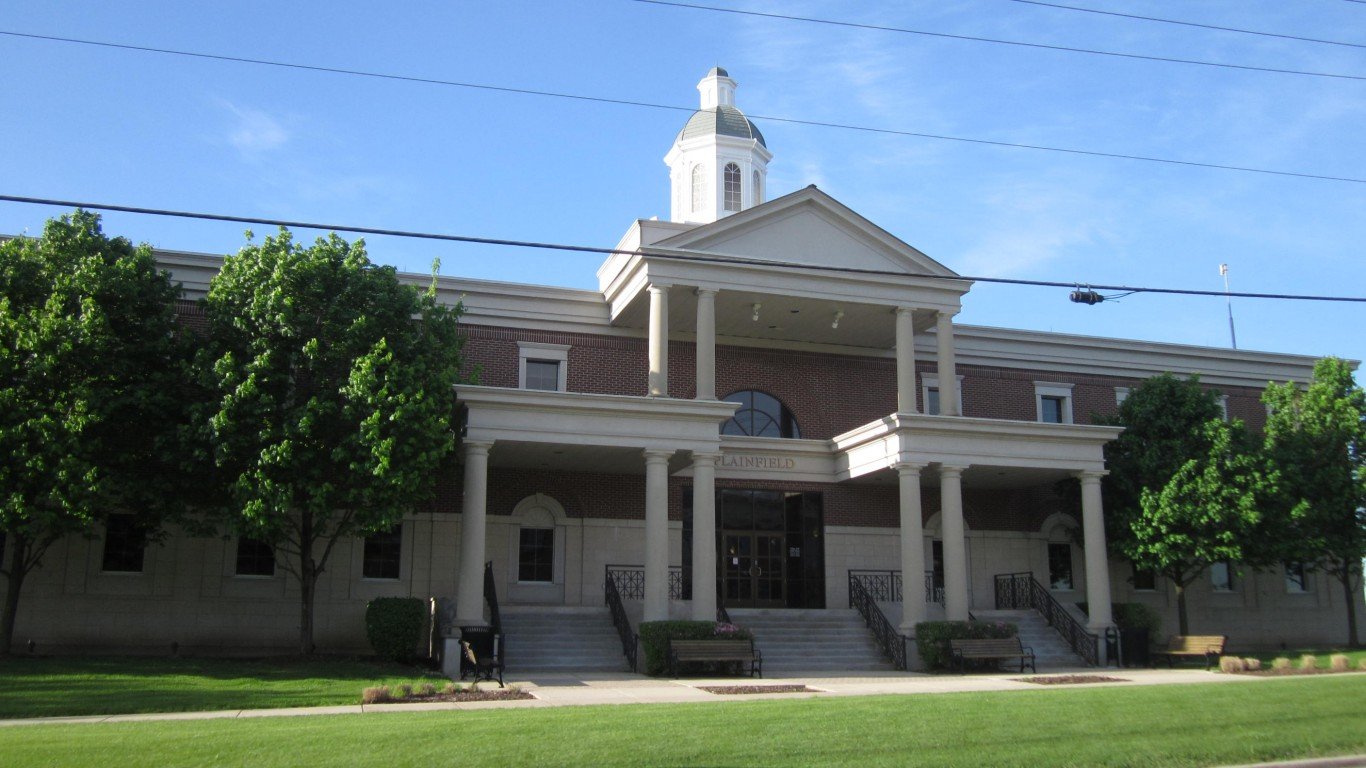
31. Plainfield, Illinois
> Gini index: 0.344
> Avg. household income, top 20%: $291,368 — 254th highest of 1,775 cities
> Avg. household income, bottom 20%: $40,662 — 17th highest of 1,775 cities
> Share of all income in Plainfield that went to top 20%: 39.9% — 26th lowest of 1,775 cities (tied)
> Share of all income in Plainfield that went to bottom 20%: 5.6% — 38th highest of 1,775 cities
> Median household income: $130,614 — 68th highest of 1,775 cities
30. Hutto, Texas
> Gini index: 0.344
> Avg. household income, top 20%: $182,790 — 749th lowest of 1,775 cities
> Avg. household income, bottom 20%: $27,898 — 190th highest of 1,775 cities
> Share of all income in Hutto that went to top 20%: 40.5% — 44th lowest of 1,775 cities
> Share of all income in Hutto that went to bottom 20%: 6.2% — 16th highest of 1,775 cities
> Median household income: $78,942 — 556th highest of 1,775 cities
[in-text-ad]

29. Tooele, Utah
> Gini index: 0.343
> Avg. household income, top 20%: $144,021 — 253rd lowest of 1,775 cities
> Avg. household income, bottom 20%: $20,791 — 518th highest of 1,775 cities
> Share of all income in Tooele that went to top 20%: 39.6% — 24th lowest of 1,775 cities
> Share of all income in Tooele that went to bottom 20%: 5.7% — 30th highest of 1,775 cities (tied)
> Median household income: $63,851 — 885th highest of 1,775 cities
28. Ramsey, Minnesota
> Gini index: 0.342
> Avg. household income, top 20%: $223,328 — 600th highest of 1,775 cities
> Avg. household income, bottom 20%: $33,891 — 68th highest of 1,775 cities
> Share of all income in Ramsey that went to top 20%: 40.6% — 48th lowest of 1,775 cities
> Share of all income in Ramsey that went to bottom 20%: 6.2% — 17th highest of 1,775 cities
> Median household income: $95,014 — 316th highest of 1,775 cities

27. Graham, Washington
> Gini index: 0.342
> Avg. household income, top 20%: $192,531 — 870th lowest of 1,775 cities
> Avg. household income, bottom 20%: $27,564 — 194th highest of 1,775 cities
> Share of all income in Graham that went to top 20%: 39.4% — 18th lowest of 1,775 cities
> Share of all income in Graham that went to bottom 20%: 5.6% — 34th highest of 1,775 cities
> Median household income: $86,943 — 417th highest of 1,775 cities
[in-text-ad-2]
26. Kyle, Texas
> Gini index: 0.342
> Avg. household income, top 20%: $181,360 — 731st lowest of 1,775 cities
> Avg. household income, bottom 20%: $27,538 — 196th highest of 1,775 cities (tied)
> Share of all income in Kyle that went to top 20%: 40.4% — 39th lowest of 1,775 cities
> Share of all income in Kyle that went to bottom 20%: 6.1% — 18th highest of 1,775 cities
> Median household income: $79,348 — 548th highest of 1,775 cities
25. Cottage Grove, Minnesota
> Gini index: 0.341
> Avg. household income, top 20%: $232,513 — 542nd highest of 1,775 cities
> Avg. household income, bottom 20%: $36,040 — 47th highest of 1,775 cities
> Share of all income in Cottage Grove that went to top 20%: 40.3% — 33rd lowest of 1,775 cities
> Share of all income in Cottage Grove that went to bottom 20%: 6.2% — 15th highest of 1,775 cities
> Median household income: $102,039 — 232nd highest of 1,775 cities
[in-text-ad]

24. Burke, Virginia
> Gini index: 0.341
> Avg. household income, top 20%: $318,611 — 193rd highest of 1,775 cities
> Avg. household income, bottom 20%: $45,710 — 8th highest of 1,775 cities
> Share of all income in Burke that went to top 20%: 39.7% — 25th lowest of 1,775 cities
> Share of all income in Burke that went to bottom 20%: 5.7% — 32nd highest of 1,775 cities
> Median household income: $145,234 — 42nd highest of 1,775 cities
23. South Riding, Virginia
> Gini index: 0.341
> Avg. household income, top 20%: $363,105 — 117th highest of 1,775 cities
> Avg. household income, bottom 20%: $53,174 — 3rd highest of 1,775 cities
> Share of all income in South Riding that went to top 20%: 40.2% — 30th lowest of 1,775 cities
> Share of all income in South Riding that went to bottom 20%: 5.9% — 24th highest of 1,775 cities
> Median household income: $158,996 — 26th highest of 1,775 cities
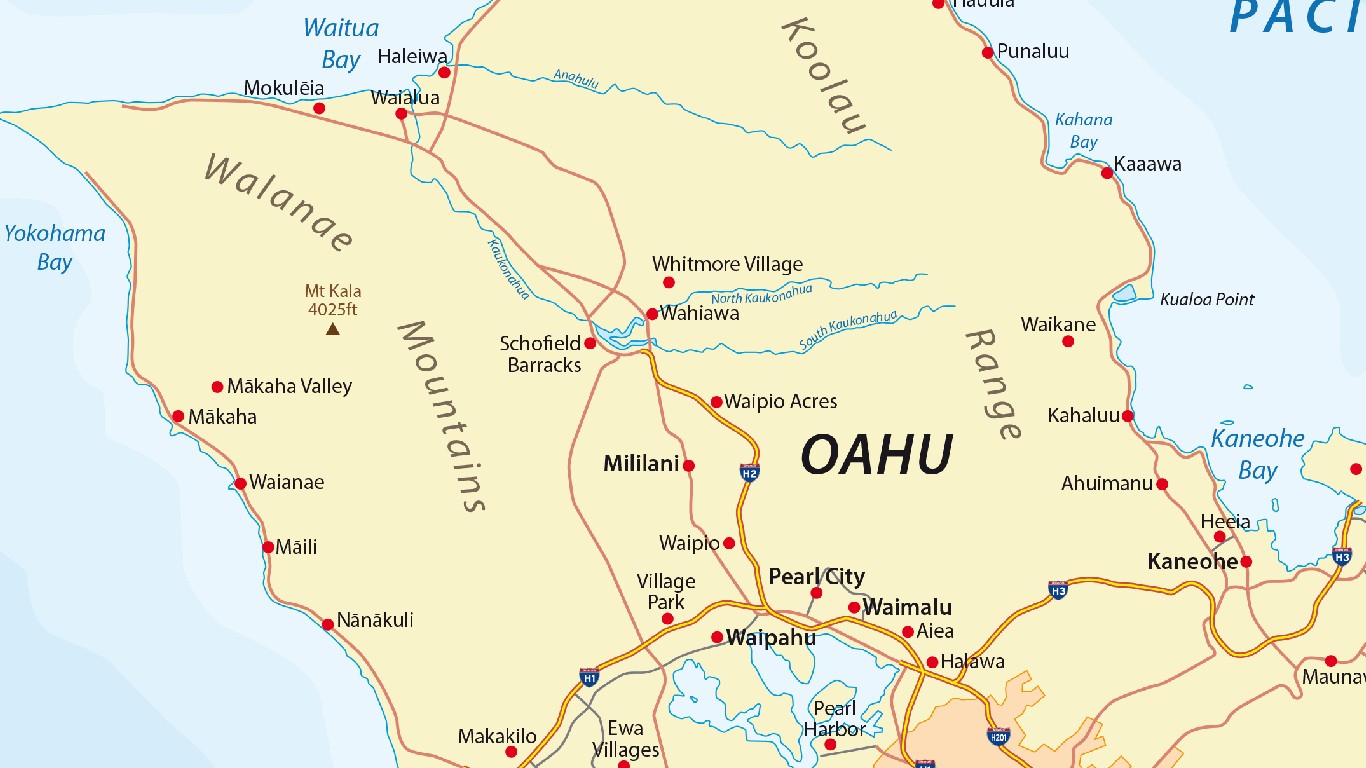
22. Mililani Town, Hawaii
> Gini index: 0.338
> Avg. household income, top 20%: $224,351 — 595th highest of 1,775 cities
> Avg. household income, bottom 20%: $33,589 — 73rd highest of 1,775 cities
> Share of all income in Mililani Town that went to top 20%: 39.3% — 17th lowest of 1,775 cities
> Share of all income in Mililani Town that went to bottom 20%: 5.9% — 22nd highest of 1,775 cities (tied)
> Median household income: $99,460 — 267th highest of 1,775 cities
[in-text-ad-2]
21. Fresno, Texas
> Gini index: 0.337
> Avg. household income, top 20%: $163,429 — 479th lowest of 1,775 cities
> Avg. household income, bottom 20%: $22,659 — 397th highest of 1,775 cities
> Share of all income in Fresno that went to top 20%: 38.9% — 11th lowest of 1,775 cities
> Share of all income in Fresno that went to bottom 20%: 5.4% — 53rd highest of 1,775 cities
> Median household income: $79,115 — 553rd highest of 1,775 cities
20. Spring Hill, Tennessee
> Gini index: 0.335
> Avg. household income, top 20%: $195,074 — 865th highest of 1,775 cities
> Avg. household income, bottom 20%: $28,782 — 161st highest of 1,775 cities
> Share of all income in Spring Hill that went to top 20%: 39.1% — 14th lowest of 1,775 cities
> Share of all income in Spring Hill that went to bottom 20%: 5.8% — 28th highest of 1,775 cities
> Median household income: $90,778 — 370th highest of 1,775 cities
[in-text-ad]
19. Lake Stevens, Washington
> Gini index: 0.334
> Avg. household income, top 20%: $204,820 — 760th highest of 1,775 cities
> Avg. household income, bottom 20%: $29,948 — 135th highest of 1,775 cities
> Share of all income in Lake Stevens that went to top 20%: 39.6% — 23rd lowest of 1,775 cities
> Share of all income in Lake Stevens that went to bottom 20%: 5.8% — 27th highest of 1,775 cities
> Median household income: $93,381 — 339th highest of 1,775 cities
18. Riverton, Utah
> Gini index: 0.333
> Avg. household income, top 20%: $227,819 — 571st highest of 1,775 cities
> Avg. household income, bottom 20%: $36,138 — 46th highest of 1,775 cities
> Share of all income in Riverton that went to top 20%: 39.5% — 19th lowest of 1,775 cities
> Share of all income in Riverton that went to bottom 20%: 6.3% — 14th highest of 1,775 cities
> Median household income: $101,619 — 240th highest of 1,775 cities
17. Maple Valley, Washington
> Gini index: 0.333
> Avg. household income, top 20%: $247,113 — 457th highest of 1,775 cities (tied)
> Avg. household income, bottom 20%: $35,911 — 48th highest of 1,775 cities
> Share of all income in Maple Valley that went to top 20%: 39.2% — 16th lowest of 1,775 cities
> Share of all income in Maple Valley that went to bottom 20%: 5.7% — 33rd highest of 1,775 cities
> Median household income: $114,159 — 129th highest of 1,775 cities
[in-text-ad-2]
16. Crofton, Maryland
> Gini index: 0.332
> Avg. household income, top 20%: $292,971 — 250th highest of 1,775 cities
> Avg. household income, bottom 20%: $50,118 — 5th highest of 1,775 cities
> Share of all income in Crofton that went to top 20%: 40.4% — 36th lowest of 1,775 cities (tied)
> Share of all income in Crofton that went to bottom 20%: 6.9% — 5th highest of 1,775 cities
> Median household income: $123,858 — 89th highest of 1,775 cities
15. Oswego, Illinois
> Gini index: 0.331
> Avg. household income, top 20%: $232,623 — 540th highest of 1,775 cities
> Avg. household income, bottom 20%: $38,431 — 31st highest of 1,775 cities
> Share of all income in Oswego that went to top 20%: 39.5% — 20th lowest of 1,775 cities
> Share of all income in Oswego that went to bottom 20%: 6.5% — 9th highest of 1,775 cities
> Median household income: $102,110 — 231st highest of 1,775 cities
[in-text-ad]

14. Syracuse, Utah
> Gini index: 0.33
> Avg. household income, top 20%: $231,717 — 546th highest of 1,775 cities
> Avg. household income, bottom 20%: $38,637 — 28th highest of 1,775 cities
> Share of all income in Syracuse that went to top 20%: 40.5% — 41st lowest of 1,775 cities (tied)
> Share of all income in Syracuse that went to bottom 20%: 6.8% — 7th highest of 1,775 cities
> Median household income: $99,625 — 263rd highest of 1,775 cities
13. Magna, Utah
> Gini index: 0.33
> Avg. household income, top 20%: $135,813 — 153rd lowest of 1,775 cities
> Avg. household income, bottom 20%: $20,147 — 559th highest of 1,775 cities
> Share of all income in Magna that went to top 20%: 38.8% — 10th lowest of 1,775 cities
> Share of all income in Magna that went to bottom 20%: 5.8% — 29th highest of 1,775 cities
> Median household income: $63,075 — 863rd lowest of 1,775 cities
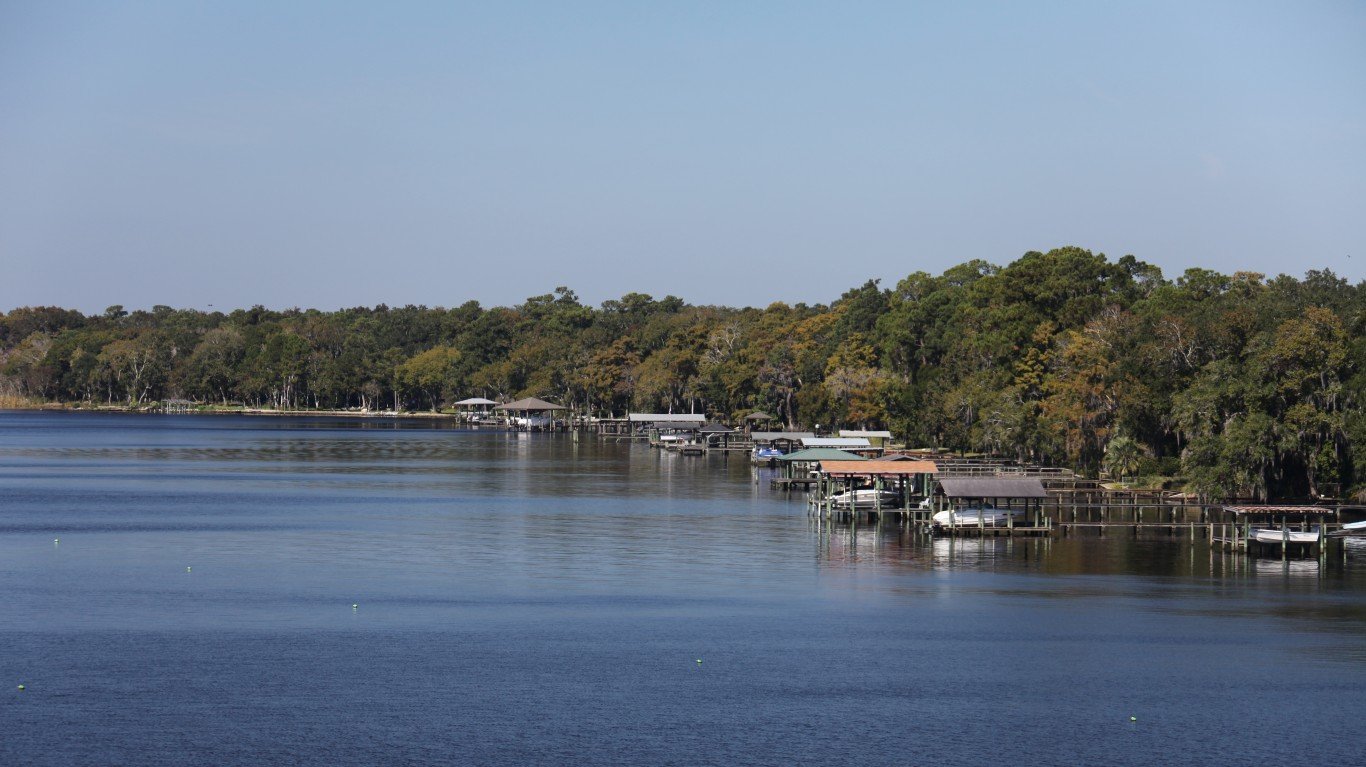
12. Oakleaf Plantation, Florida
> Gini index: 0.328
> Avg. household income, top 20%: $177,863 — 674th lowest of 1,775 cities
> Avg. household income, bottom 20%: $27,404 — 201st highest of 1,775 cities
> Share of all income in Oakleaf Plantation that went to top 20%: 37.9% — 6th lowest of 1,775 cities
> Share of all income in Oakleaf Plantation that went to bottom 20%: 5.8% — 26th highest of 1,775 cities
> Median household income: $87,485 — 408th highest of 1,775 cities
[in-text-ad-2]

11. French Valley, California
> Gini index: 0.327
> Avg. household income, top 20%: $241,019 — 488th highest of 1,775 cities
> Avg. household income, bottom 20%: $39,742 — 20th highest of 1,775 cities
> Share of all income in French Valley that went to top 20%: 39.0% — 12th lowest of 1,775 cities
> Share of all income in French Valley that went to bottom 20%: 6.4% — 11th highest of 1,775 cities
> Median household income: $111,052 — 146th highest of 1,775 cities
10. Kearns, Utah
> Gini index: 0.324
> Avg. household income, top 20%: $142,888 — 247th lowest of 1,775 cities
> Avg. household income, bottom 20%: $24,065 — 334th highest of 1,775 cities
> Share of all income in Kearns that went to top 20%: 39.0% — 13th lowest of 1,775 cities
> Share of all income in Kearns that went to bottom 20%: 6.6% — 8th highest of 1,775 cities
> Median household income: $64,337 — 878th highest of 1,775 cities
[in-text-ad]
9. Roy, Utah
> Gini index: 0.324
> Avg. household income, top 20%: $145,151 — 263rd lowest of 1,775 cities
> Avg. household income, bottom 20%: $22,317 — 424th highest of 1,775 cities
> Share of all income in Roy that went to top 20%: 38.3% — 9th lowest of 1,775 cities
> Share of all income in Roy that went to bottom 20%: 5.9% — 22nd highest of 1,775 cities (tied)
> Median household income: $70,032 — 746th highest of 1,775 cities
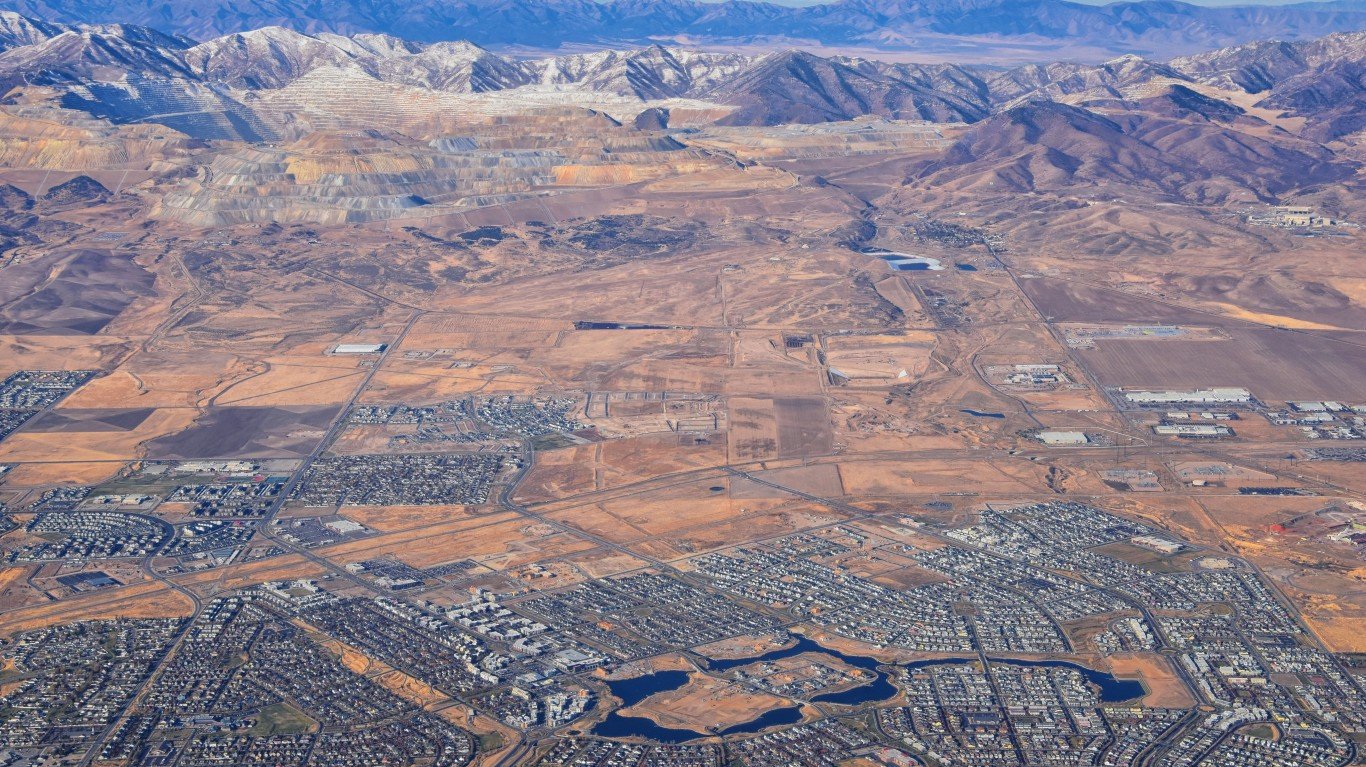
8. Herriman, Utah
> Gini index: 0.322
> Avg. household income, top 20%: $221,012 — 616th highest of 1,775 cities
> Avg. household income, bottom 20%: $38,667 — 26th highest of 1,775 cities
> Share of all income in Herriman that went to top 20%: 39.1% — 15th lowest of 1,775 cities
> Share of all income in Herriman that went to bottom 20%: 6.8% — 6th highest of 1,775 cities
> Median household income: $101,460 — 242nd highest of 1,775 cities

7. Wylie, Texas
> Gini index: 0.318
> Avg. household income, top 20%: $188,424 — 820th lowest of 1,775 cities
> Avg. household income, bottom 20%: $31,735 — 100th highest of 1,775 cities
> Share of all income in Wylie that went to top 20%: 37.6% — 5th lowest of 1,775 cities
> Share of all income in Wylie that went to bottom 20%: 6.3% — 12th highest of 1,775 cities (tied)
> Median household income: $92,395 — 351st highest of 1,775 cities
[in-text-ad-2]

6. Cibolo, Texas
> Gini index: 0.317
> Avg. household income, top 20%: $219,476 — 626th highest of 1,775 cities
> Avg. household income, bottom 20%: $37,593 — 37th highest of 1,775 cities
> Share of all income in Cibolo that went to top 20%: 38.0% — 7th lowest of 1,775 cities
> Share of all income in Cibolo that went to bottom 20%: 6.5% — 10th highest of 1,775 cities
> Median household income: $104,601 — 213th highest of 1,775 cities

5. Independence, Kentucky
> Gini index: 0.317
> Avg. household income, top 20%: $169,310 — 553rd lowest of 1,775 cities
> Avg. household income, bottom 20%: $28,155 — 181st highest of 1,775 cities
> Share of all income in Independence that went to top 20%: 38.0% — 8th lowest of 1,775 cities
> Share of all income in Independence that went to bottom 20%: 6.3% — 12th highest of 1,775 cities (tied)
> Median household income: $81,657 — 503rd highest of 1,775 cities
[in-text-ad]
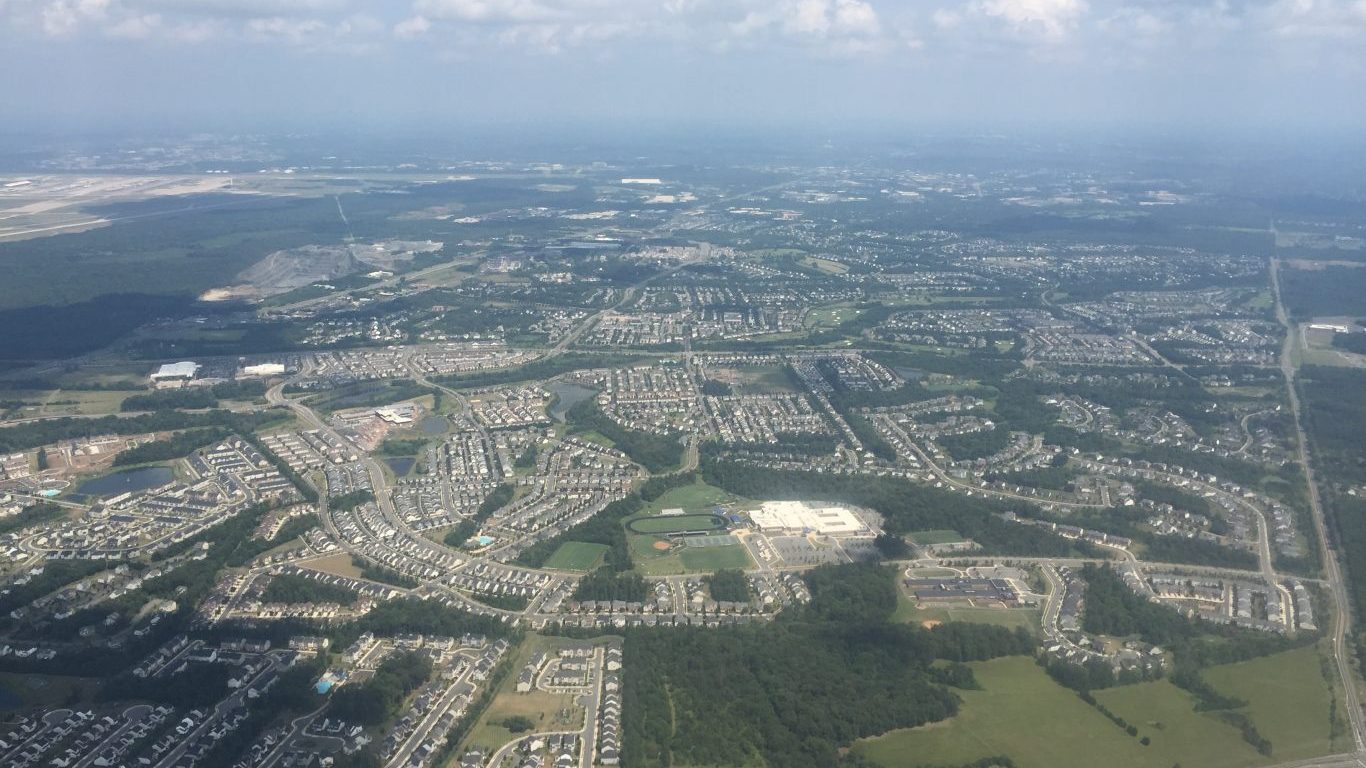
4. Linton Hall, Virginia
> Gini index: 0.306
> Avg. household income, top 20%: $296,634 — 242nd highest of 1,775 cities
> Avg. household income, bottom 20%: $55,108 — 2nd highest of 1,775 cities
> Share of all income in Linton Hall that went to top 20%: 37.3% — 3rd lowest of 1,775 cities
> Share of all income in Linton Hall that went to bottom 20%: 6.9% — 4th highest of 1,775 cities
> Median household income: $144,420 — 43rd highest of 1,775 cities
3. Ewa Gentry, Hawaii
> Gini index: 0.299
> Avg. household income, top 20%: $228,705 — 563rd highest of 1,775 cities
> Avg. household income, bottom 20%: $44,555 — 10th highest of 1,775 cities
> Share of all income in Ewa Gentry that went to top 20%: 37.3% — 2nd lowest of 1,775 cities
> Share of all income in Ewa Gentry that went to bottom 20%: 7.3% — 3rd highest of 1,775 cities
> Median household income: $111,272 — 145th highest of 1,775 cities

2. Saratoga Springs, Utah
> Gini index: 0.299
> Avg. household income, top 20%: $207,743 — 726th highest of 1,775 cities
> Avg. household income, bottom 20%: $41,396 — 16th highest of 1,775 cities
> Share of all income in Saratoga Springs that went to top 20%: 37.3% — 4th lowest of 1,775 cities
> Share of all income in Saratoga Springs that went to bottom 20%: 7.5% — 2nd highest of 1,775 cities
> Median household income: $102,531 — 228th highest of 1,775 cities
[in-text-ad-2]
1. Eagle Mountain, Utah
> Gini index: 0.282
> Avg. household income, top 20%: $166,886 — 515th lowest of 1,775 cities
> Avg. household income, bottom 20%: $36,567 — 42nd highest of 1,775 cities
> Share of all income in Eagle Mountain that went to top 20%: 36.5% — the lowest of 1,775 cities
> Share of all income in Eagle Mountain that went to bottom 20%: 8.0% — the highest of 1,775 cities
> Median household income: $83,290 — 472nd highest of 1,775 cities
Methodology
To determine the cities with the smallest income gaps in the nation, 24/7 Wall St. reviewed five-year estimates of the Gini Index of income inequality from the U.S. Census Bureau’s 2019 American Community Survey.
The Gini Index of income inequality summarizes income dispersion in an area on a scale from 0 to 1. A value of 0 indicates perfect equality — everyone in the area receives an equal share of income. A value of 1 indicates perfect inequality — only one recipient receives all the income.
We used census “place” geographies — a category that includes 29,573 incorporated legal entities and census-designated statistical entities. Of those, 29,320 had boundaries that fell within one of the 50 states or the District of Columbia.
We defined cities based on a population threshold — having more than 25,000 people — and 1,775 of the places fell within this threshold.
Cities were ranked based on their Gini Index. To break ties, we used the share of aggregate household income earned by the top 20% of households.
Additional information on average household income by quintile, share of aggregate household income by quintile, and median household income are also five-year estimates from the 2019 ACS.
Sponsored: Find a Qualified Financial Advisor
Finding a qualified financial advisor doesn’t have to be hard. SmartAsset’s free tool matches you with up to 3 fiduciary financial advisors in your area in 5 minutes. Each advisor has been vetted by SmartAsset and is held to a fiduciary standard to act in your best interests. If you’re ready to be matched with local advisors that can help you achieve your financial goals, get started now.
Thank you for reading! Have some feedback for us?
Contact the 24/7 Wall St. editorial team.

 24/7 Wall St.