
The United States has some of the highest levels of income and wealth inequality in the world. U.S. Federal Reserve data shows that the wealthiest 10% of Americans control $93.8 trillion, more than double the $40.3 trillion in the hands of the remaining 90% of Americans.
The income and wealth divide only appears to be growing wider. A January 2020 report published by the Pew Research Center found that over the last four decades, income growth for the top 5% of families by earnings has far outpaced income growth for families in the lower income strata.
In a nation as large as the U.S., varied levels of income inequality may be expected, and in a few areas in the country, extreme wealth and extreme poverty exist side by side. In nearly every state, there is at least one city where income inequality is far more pronounced than it is on average nationwide.
Using data from the U.S. Census Bureau’s 2019 American Community Survey, 24/7 Wall St. identified the city with the widest income gap in each state. Cities are ranked by their Gini coefficient, a measure of income inequality based on the distribution of income across a population on a 0 to 1 scale — 0 representing perfect equality and 1 representing the highest possible level of inequality. For the purposes of this story, cities are defined as any place covered by the census with populations over 25,000.
Though each city on this list has the highest degree of income inequality in its state, Gini scores vary considerably — from 0.430 up to 0.606. Nationwide, the Gini coefficient stands at 0.482.
Causes behind rising inequality in the United States are complex and varied. A report published by the National Bureau of Economic Research ties the rising disparity to a range of economic factors, including globalization, technological advancement, a stagnant minimum wage, and the decline of labor unions.
Click here to see the city with the widest income gap in every state
Click here to read our detailed methodology

Source: RobHainer / Getty Images
Alabama: Auburn
> Gini index: 0.553 (Alabama: 0.479)
> Avg. household income, top 20%: $209,137 (Alabama: $177,811)
> Avg. household income, bottom 20%: $3,856 (Alabama: $10,538)
> Share of all income in Auburn that went to top 20%: 56.1% (Alabama: 50.9%)
> Share of all income in Auburn that went to bottom 20%: 1.0% (Alabama: 3.0%)
> Median household income: $47,318 (Alabama: $50,536)
[in-text-ad]

Source: yenwen / Getty Images
Alaska: Anchorage
> Gini index: 0.43 (Alaska: 0.428)
> Avg. household income, top 20%: $259,484 (Alaska: $230,147)
> Avg. household income, bottom 20%: $22,705 (Alaska: $18,977)
> Share of all income in Anchorage that went to top 20%: 47.2% (Alaska: 46.7%)
> Share of all income in Anchorage that went to bottom 20%: 4.1% (Alaska: 3.8%)
> Median household income: $84,928 (Alaska: $77,640)

Source: benedek / iStock Unreleased via Getty Images
Arizona: Catalina Foothills
> Gini index: 0.507 (Arizona: 0.466)
> Avg. household income, top 20%: $389,855 (Arizona: $202,970)
> Avg. household income, bottom 20%: $20,601 (Arizona: $13,587)
> Share of all income in Catalina Foothills that went to top 20%: 54.1% (Arizona: 50.3%)
> Share of all income in Catalina Foothills that went to bottom 20%: 2.9% (Arizona: 3.4%)
> Median household income: $92,929 (Arizona: $58,945)

Source: Sean Pavone / Getty Images
Arkansas: Little Rock
> Gini index: 0.533 (Arkansas: 0.477)
> Avg. household income, top 20%: $238,178 (Arkansas: $170,176)
> Avg. household income, bottom 20%: $11,195 (Arkansas: $11,049)
> Share of all income in Little Rock that went to top 20%: 56.9% (Arkansas: 51.1%)
> Share of all income in Little Rock that went to bottom 20%: 2.7% (Arkansas: 3.3%)
> Median household income: $51,485 (Arkansas: $47,597)
[in-text-ad-2]

Source: dszc / Getty Images
California: Beverly Hills
> Gini index: 0.586 (California: 0.489)
> Avg. household income, top 20%: $611,101 (California: $278,638)
> Avg. household income, bottom 20%: $15,251 (California: $15,827)
> Share of all income in Beverly Hills that went to top 20%: 62.5% (California: 52.1%)
> Share of all income in Beverly Hills that went to bottom 20%: 1.6% (California: 3.0%)
> Median household income: $106,936 (California: $75,235)
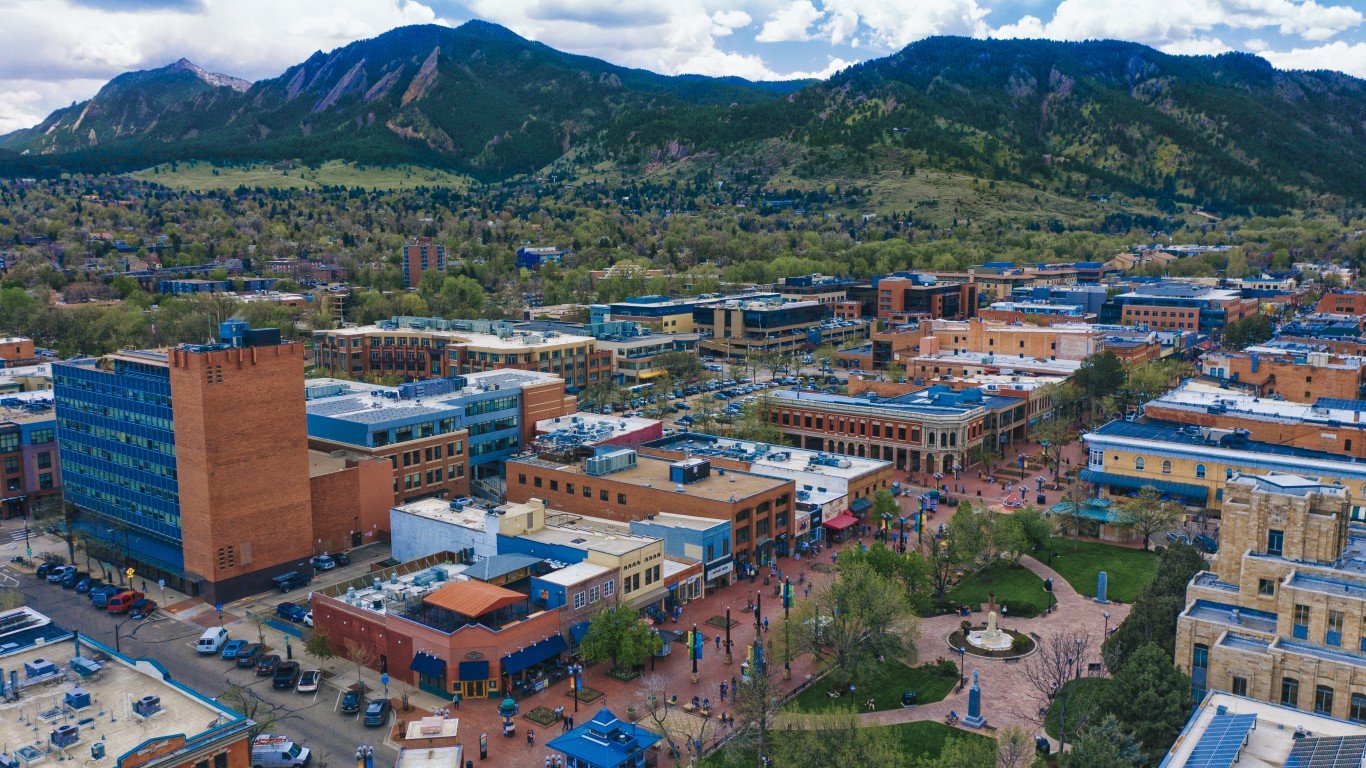
Source: pawel.gaul / iStock via Getty Images
Colorado: Boulder
> Gini index: 0.533 (Colorado: 0.457)
> Avg. household income, top 20%: $304,222 (Colorado: $239,479)
> Avg. household income, bottom 20%: $10,480 (Colorado: $17,187)
> Share of all income in Boulder that went to top 20%: 55.6% (Colorado: 49.4%)
> Share of all income in Boulder that went to bottom 20%: 1.9% (Colorado: 3.5%)
> Median household income: $69,520 (Colorado: $72,331)
[in-text-ad]

Source: DenisTangneyJr / Getty Images
Connecticut: New Haven
> Gini index: 0.52 (Connecticut: 0.496)
> Avg. household income, top 20%: $178,854 (Connecticut: $298,915)
> Avg. household income, bottom 20%: $7,889 (Connecticut: $16,569)
> Share of all income in New Haven that went to top 20%: 54.7% (Connecticut: 52.9%)
> Share of all income in New Haven that went to bottom 20%: 2.4% (Connecticut: 2.9%)
> Median household income: $42,222 (Connecticut: $78,444)
 24/7 Wall St.
Source: ChrisBoswell / iStock via Getty Images
Delaware: Wilmington
> Gini index: 0.544 (Delaware: 0.454)
> Avg. household income, top 20%: $197,044 (Delaware: $221,085)
> Avg. household income, bottom 20%: $6,610 (Delaware: $15,768)
> Share of all income in Wilmington that went to top 20%: 56.7% (Delaware: 49.1%)
> Share of all income in Wilmington that went to bottom 20%: 1.9% (Delaware: 3.5%)
> Median household income: $45,032 (Delaware: $68,287)

Source: ULora / iStock via Getty Images
Florida: Miami Beach
> Gini index: 0.606 (Florida: 0.486)
> Avg. household income, top 20%: $343,868 (Florida: $209,841)
> Avg. household income, bottom 20%: $10,886 (Florida: $13,086)
> Share of all income in Miami Beach that went to top 20%: 64.4% (Florida: 52.3%)
> Share of all income in Miami Beach that went to bottom 20%: 2.0% (Florida: 3.3%)
> Median household income: $53,971 (Florida: $55,660)
[in-text-ad-2]

Source: Sean Pavone / Getty Images
Georgia: Atlanta
> Gini index: 0.581 (Georgia: 0.482)
> Avg. household income, top 20%: $324,646 (Georgia: $212,411)
> Avg. household income, bottom 20%: $9,684 (Georgia: $12,798)
> Share of all income in Atlanta that went to top 20%: 61.1% (Georgia: 51.5%)
> Share of all income in Atlanta that went to bottom 20%: 1.8% (Georgia: 3.1%)
> Median household income: $59,948 (Georgia: $58,700)

Source: Art Wager / Getty Images
Hawaii: Urban Honolulu
> Gini index: 0.473 (Hawaii: 0.441)
> Avg. household income, top 20%: $246,814 (Hawaii: $247,294)
> Avg. household income, bottom 20%: $14,534 (Hawaii: $17,890)
> Share of all income in Urban Honolulu that went to top 20%: 50.7% (Hawaii: 47.7%)
> Share of all income in Urban Honolulu that went to bottom 20%: 3.0% (Hawaii: 3.5%)
> Median household income: $71,465 (Hawaii: $81,275)
[in-text-ad]

Idaho: Rexburg
> Gini index: 0.494 (Idaho: 0.446)
> Avg. household income, top 20%: $121,764 (Idaho: $178,921)
> Avg. household income, bottom 20%: $7,105 (Idaho: $13,921)
> Share of all income in Rexburg that went to top 20%: 52.7% (Idaho: 48.5%)
> Share of all income in Rexburg that went to bottom 20%: 3.1% (Idaho: 3.8%)
> Median household income: $31,128 (Idaho: $55,785)
 24/7 Wall St.
Source: sshepard / iStock Unreleased via Getty Images
Illinois: Carbondale
> Gini index: 0.599 (Illinois: 0.482)
> Avg. household income, top 20%: $141,616 (Illinois: $237,616)
> Avg. household income, bottom 20%: $2,600 (Illinois: $14,052)
> Share of all income in Carbondale that went to top 20%: 62.5% (Illinois: 51.4%)
> Share of all income in Carbondale that went to bottom 20%: 1.1% (Illinois: 3.0%)
> Median household income: $22,152 (Illinois: $65,886)
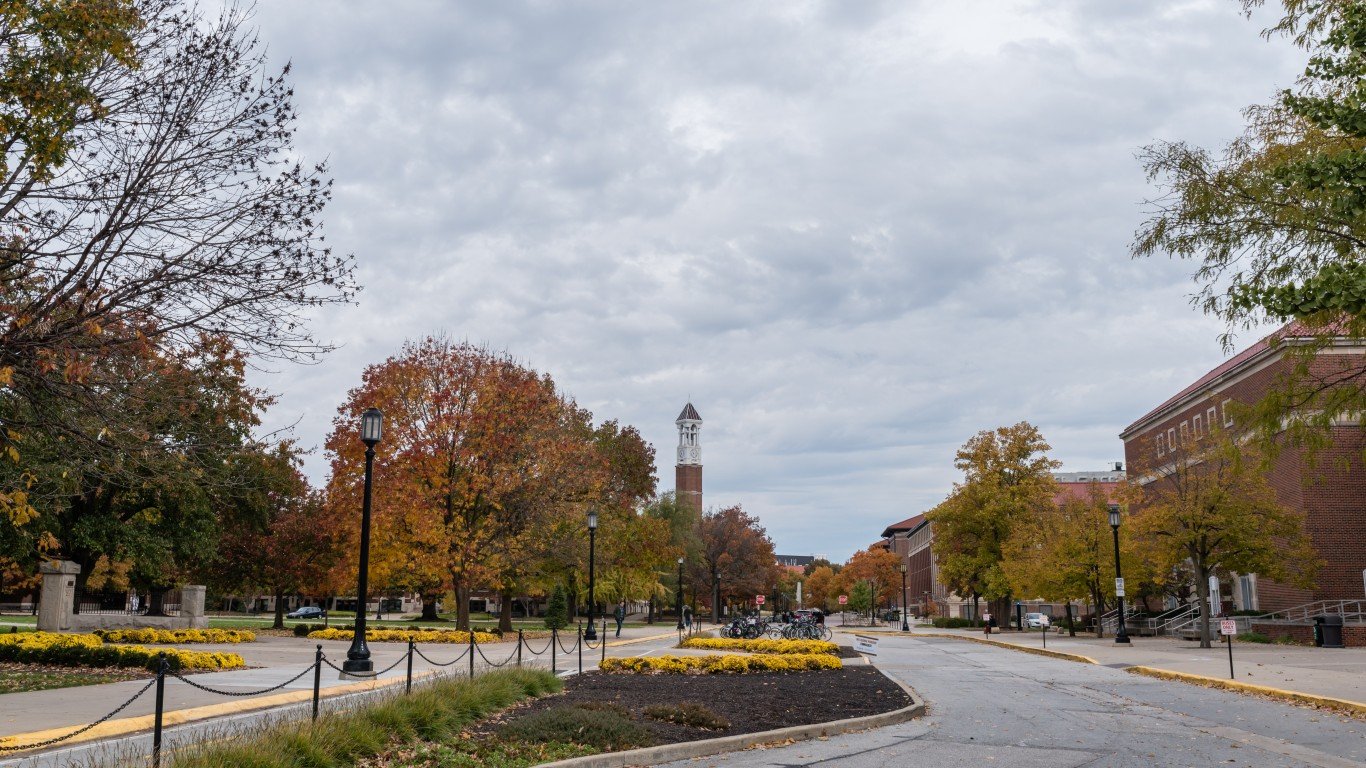
Source: akrassel / iStock via Getty Images
Indiana: West Lafayette
> Gini index: 0.578 (Indiana: 0.453)
> Avg. household income, top 20%: $194,561 (Indiana: $183,445)
> Avg. household income, bottom 20%: $3,574 (Indiana: $13,570)
> Share of all income in West Lafayette that went to top 20%: 59.7% (Indiana: 48.9%)
> Share of all income in West Lafayette that went to bottom 20%: 1.1% (Indiana: 3.6%)
> Median household income: $34,650 (Indiana: $56,303)
[in-text-ad-2]
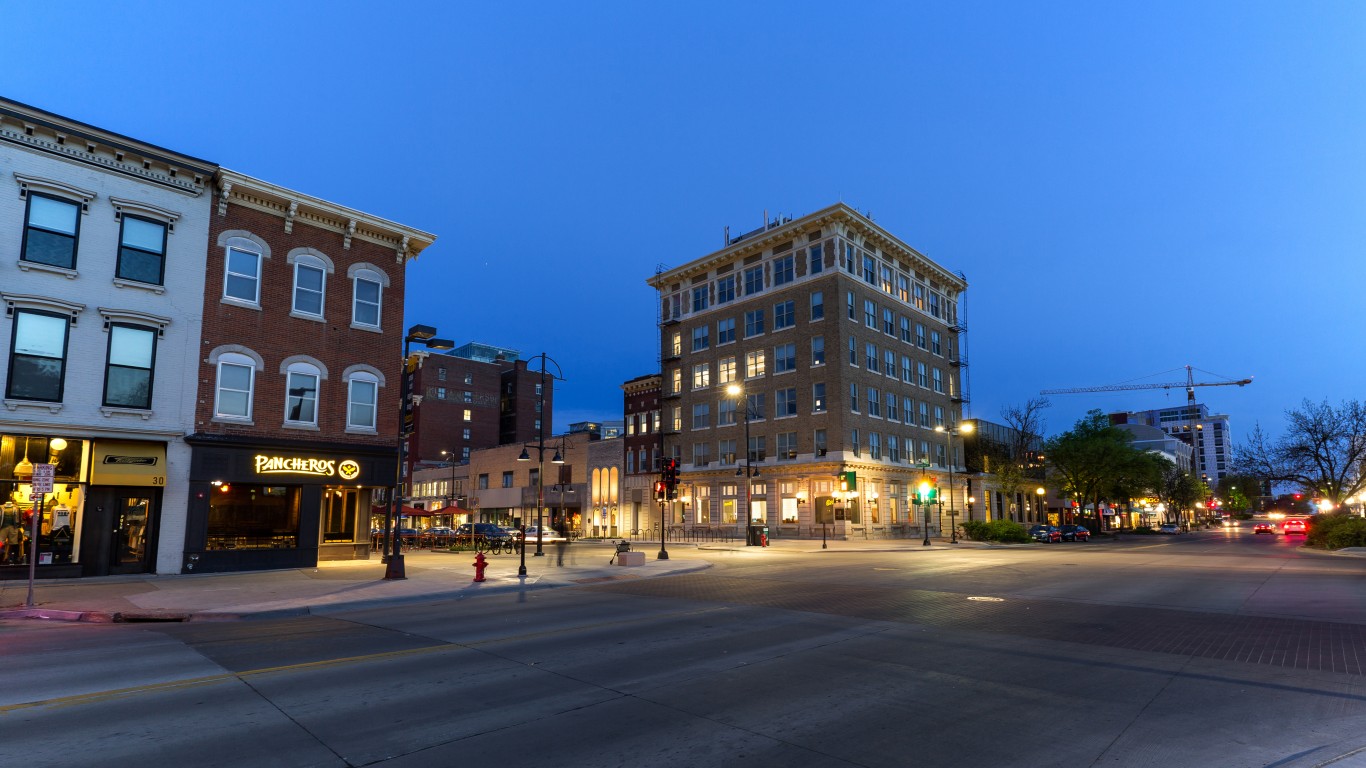
Source: harmantasdc / Getty Images
Iowa: Iowa City
> Gini index: 0.511 (Iowa: 0.442)
> Avg. household income, top 20%: $185,842 (Iowa: $187,874)
> Avg. household income, bottom 20%: $6,740 (Iowa: $14,836)
> Share of all income in Iowa City that went to top 20%: 53.0% (Iowa: 47.9%)
> Share of all income in Iowa City that went to bottom 20%: 1.9% (Iowa: 3.8%)
> Median household income: $49,075 (Iowa: $60,523)

Source: TriggerPhoto / iStock via Getty Images
Kansas: Leawood
> Gini index: 0.504 (Kansas: 0.456)
> Avg. household income, top 20%: $665,393 (Kansas: $197,458)
> Avg. household income, bottom 20%: $37,757 (Kansas: $14,449)
> Share of all income in Leawood that went to top 20%: 54.9% (Kansas: 49.4%)
> Share of all income in Leawood that went to bottom 20%: 3.1% (Kansas: 3.6%)
> Median household income: $157,515 (Kansas: $59,597)
[in-text-ad]

Source: EJ_Rodriquez / iStock via Getty Images
Kentucky: Richmond
> Gini index: 0.504 (Kentucky: 0.479)
> Avg. household income, top 20%: $140,527 (Kentucky: $178,883)
> Avg. household income, bottom 20%: $7,397 (Kentucky: $10,912)
> Share of all income in Richmond that went to top 20%: 53.0% (Kentucky: 51.0%)
> Share of all income in Richmond that went to bottom 20%: 2.8% (Kentucky: 3.1%)
> Median household income: $36,302 (Kentucky: $50,589)

Source: wellesenterprises / Getty Images
Louisiana: Monroe
> Gini index: 0.591 (Louisiana: 0.495)
> Avg. household income, top 20%: $172,713 (Louisiana: $185,481)
> Avg. household income, bottom 20%: $4,817 (Louisiana: $9,757)
> Share of all income in Monroe that went to top 20%: 62.2% (Louisiana: 52.3%)
> Share of all income in Monroe that went to bottom 20%: 1.7% (Louisiana: 2.8%)
> Median household income: $30,438 (Louisiana: $49,469)

Source: DenisTangneyJr / Getty Images
Maine: Bangor
> Gini index: 0.509 (Maine: 0.451)
> Avg. household income, top 20%: $189,038 (Maine: $185,447)
> Avg. household income, bottom 20%: $10,065 (Maine: $13,702)
> Share of all income in Bangor that went to top 20%: 54.1% (Maine: 48.7%)
> Share of all income in Bangor that went to bottom 20%: 2.9% (Maine: 3.6%)
> Median household income: $46,625 (Maine: $57,918)
[in-text-ad-2]

Source: Sean Pavone / Getty Images
Maryland: Baltimore
> Gini index: 0.515 (Maryland: 0.454)
> Avg. household income, top 20%: $200,552 (Maryland: $272,042)
> Avg. household income, bottom 20%: $8,583 (Maryland: $18,854)
> Share of all income in Baltimore that went to top 20%: 54.0% (Maryland: 48.8%)
> Share of all income in Baltimore that went to bottom 20%: 2.3% (Maryland: 3.4%)
> Median household income: $50,379 (Maryland: $84,805)

Source: Sean Pavone / Getty Images
Massachusetts: Boston
> Gini index: 0.539 (Massachusetts: 0.483)
> Avg. household income, top 20%: $299,047 (Massachusetts: $284,857)
> Avg. household income, bottom 20%: $9,250 (Massachusetts: $15,520)
> Share of all income in Boston that went to top 20%: 55.6% (Massachusetts: 51.1%)
> Share of all income in Boston that went to bottom 20%: 1.7% (Massachusetts: 2.8%)
> Median household income: $71,115 (Massachusetts: $81,215)
[in-text-ad]

Michigan: East Lansing
> Gini index: 0.561 (Michigan: 0.467)
> Avg. household income, top 20%: $192,908 (Michigan: $196,731)
> Avg. household income, bottom 20%: $4,266 (Michigan: $13,156)
> Share of all income in East Lansing that went to top 20%: 57.3% (Michigan: 50.2%)
> Share of all income in East Lansing that went to bottom 20%: 1.3% (Michigan: 3.4%)
> Median household income: $39,867 (Michigan: $57,144)

Source: Jacob Boomsma / iStock via Getty Images
Minnesota: Edina
> Gini index: 0.537 (Minnesota: 0.449)
> Avg. household income, top 20%: $475,538 (Minnesota: $228,793)
> Avg. household income, bottom 20%: $20,307 (Minnesota: $17,300)
> Share of all income in Edina that went to top 20%: 57.0% (Minnesota: 48.7%)
> Share of all income in Edina that went to bottom 20%: 2.4% (Minnesota: 3.7%)
> Median household income: $104,244 (Minnesota: $71,306)

Source: BOB WESTON / iStock via Getty Images
Mississippi: Oxford
> Gini index: 0.554 (Mississippi: 0.481)
> Avg. household income, top 20%: $202,773 (Mississippi: $160,084)
> Avg. household income, bottom 20%: $5,260 (Mississippi: $9,367)
> Share of all income in Oxford that went to top 20%: 57.7% (Mississippi: 51.0%)
> Share of all income in Oxford that went to bottom 20%: 1.5% (Mississippi: 3.0%)
> Median household income: $44,283 (Mississippi: $45,081)
[in-text-ad-2]

Missouri: University City
> Gini index: 0.578 (Missouri: 0.464)
> Avg. household income, top 20%: $351,188 (Missouri: $190,290)
> Avg. household income, bottom 20%: $10,283 (Missouri: $13,281)
> Share of all income in University City that went to top 20%: 61.2% (Missouri: 50.0%)
> Share of all income in University City that went to bottom 20%: 1.8% (Missouri: 3.5%)
> Median household income: $61,274 (Missouri: $55,461)

Source: akpakp / iStock via Getty Images
Montana: Missoula
> Gini index: 0.487 (Montana: 0.459)
> Avg. household income, top 20%: $177,654 (Montana: $184,017)
> Avg. household income, bottom 20%: $10,626 (Montana: $13,337)
> Share of all income in Missoula that went to top 20%: 51.9% (Montana: 49.6%)
> Share of all income in Missoula that went to bottom 20%: 3.1% (Montana: 3.6%)
> Median household income: $47,426 (Montana: $54,970)
[in-text-ad]

Source: Matt Bills / Getty Images
Nebraska: Omaha
> Gini index: 0.472 (Nebraska: 0.444)
> Avg. household income, top 20%: $210,534 (Nebraska: $193,357)
> Avg. household income, bottom 20%: $13,594 (Nebraska: $15,168)
> Share of all income in Omaha that went to top 20%: 50.8% (Nebraska: 48.2%)
> Share of all income in Omaha that went to bottom 20%: 3.3% (Nebraska: 3.8%)
> Median household income: $60,092 (Nebraska: $61,439)
 24/7 Wall St.
Nevada: Winchester
> Gini index: 0.533 (Nevada: 0.462)
> Avg. household income, top 20%: $181,299 (Nevada: $203,124)
> Avg. household income, bottom 20%: $9,160 (Nevada: $14,239)
> Share of all income in Winchester that went to top 20%: 56.7% (Nevada: 49.8%)
> Share of all income in Winchester that went to bottom 20%: 2.9% (Nevada: 3.5%)
> Median household income: $39,020 (Nevada: $60,365)

Source: DenisTangneyJr / E+ via Getty Images
New Hampshire: Concord
> Gini index: 0.449 (New Hampshire: 0.438)
> Avg. household income, top 20%: $210,106 (New Hampshire: $236,675)
> Avg. household income, bottom 20%: $14,956 (New Hampshire: $18,862)
> Share of all income in Concord that went to top 20%: 48.5% (New Hampshire: 47.7%)
> Share of all income in Concord that went to bottom 20%: 3.5% (New Hampshire: 3.8%)
> Median household income: $66,719 (New Hampshire: $76,768)
[in-text-ad-2]

Source: aimintang / Getty Images
New Jersey: Princeton
> Gini index: 0.563 (New Jersey: 0.481)
> Avg. household income, top 20%: $688,791 (New Jersey: $294,079)
> Avg. household income, bottom 20%: $20,968 (New Jersey: $16,981)
> Share of all income in Princeton that went to top 20%: 58.8% (New Jersey: 51.3%)
> Share of all income in Princeton that went to bottom 20%: 1.8% (New Jersey: 3.0%)
> Median household income: $137,672 (New Jersey: $82,545)
Source: renal / Getty Images
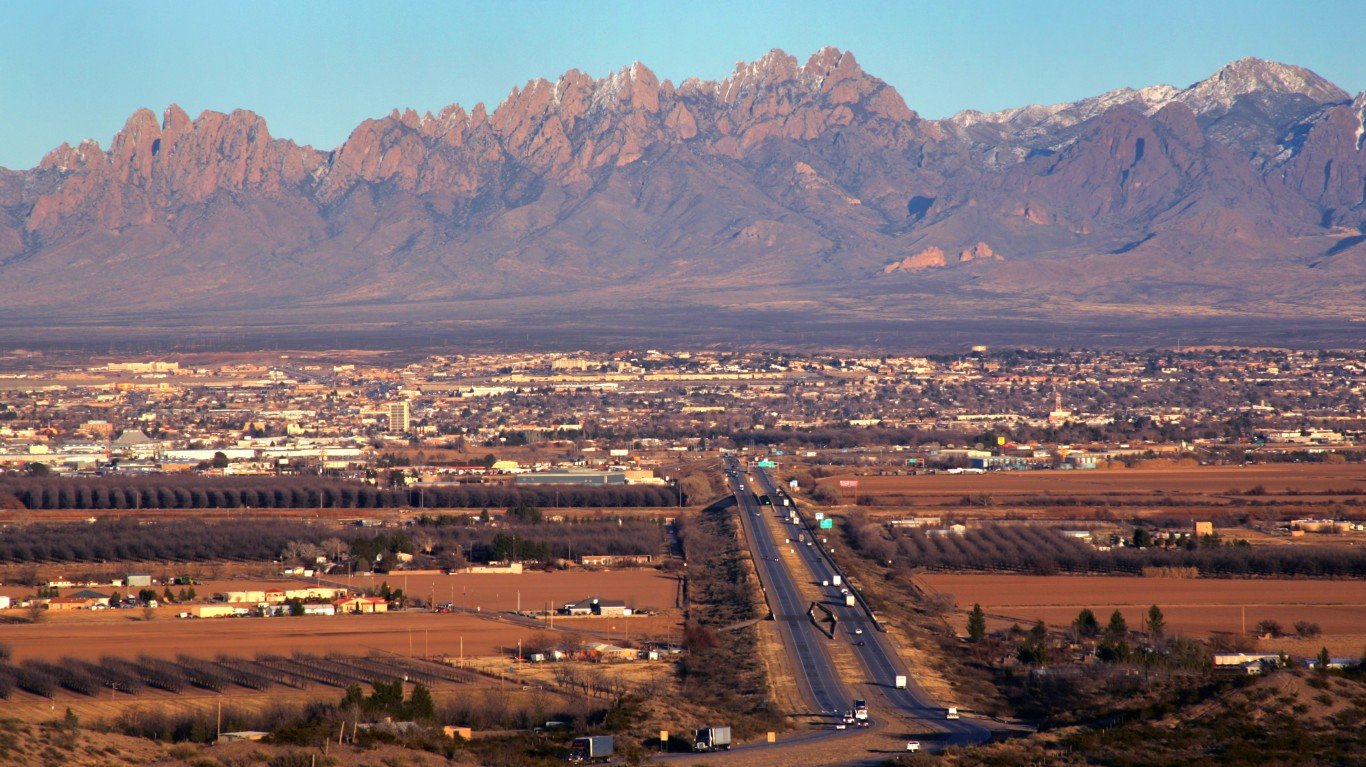
New Mexico: Las Cruces
> Gini index: 0.486 (New Mexico: 0.478)
> Avg. household income, top 20%: $154,145 (New Mexico: $175,925)
> Avg. household income, bottom 20%: $8,187 (New Mexico: $10,558)
> Share of all income in Las Cruces that went to top 20%: 51.3% (New Mexico: 50.9%)
> Share of all income in Las Cruces that went to bottom 20%: 2.7% (New Mexico: 3.1%)
> Median household income: $43,022 (New Mexico: $49,754)
[in-text-ad]
Source: benedek / Getty Images
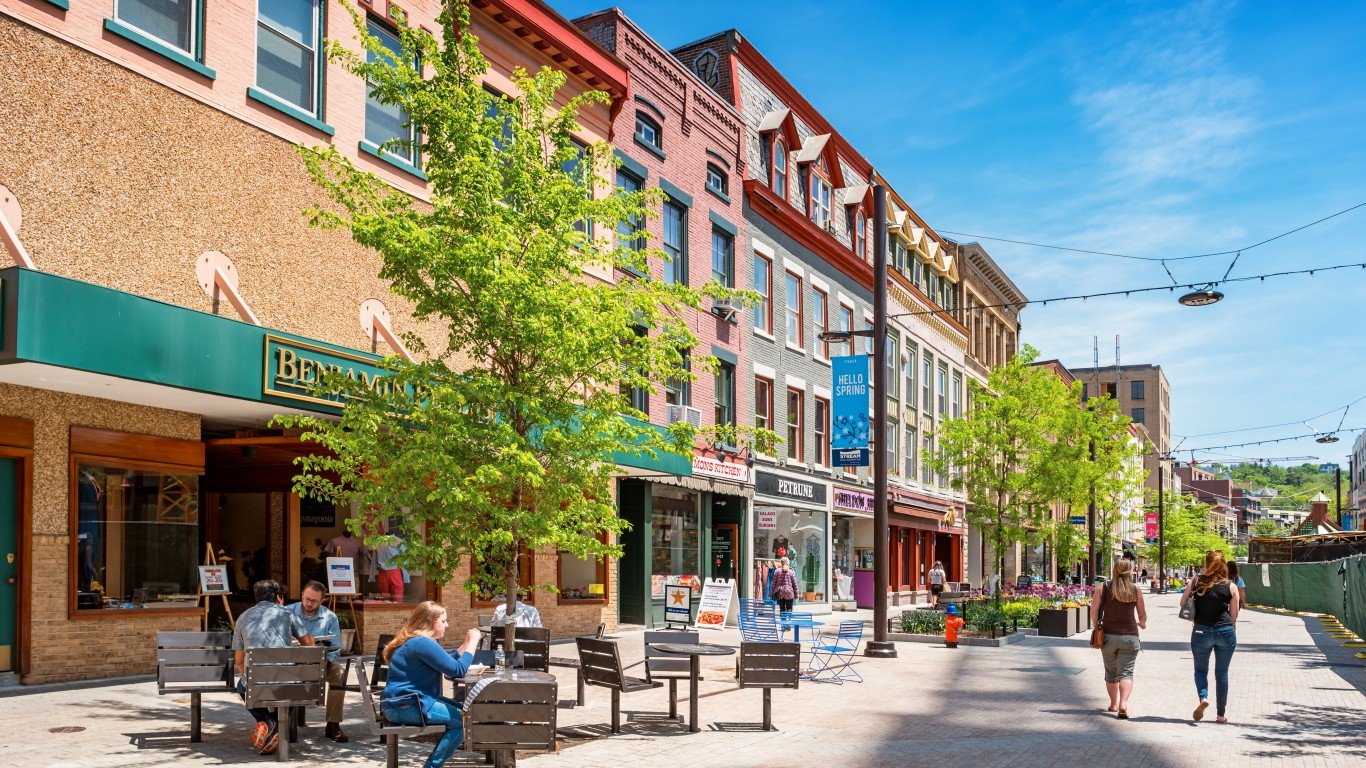
New York: Ithaca
> Gini index: 0.583 (New York: 0.514)
> Avg. household income, top 20%: $185,171 (New York: $276,728)
> Avg. household income, bottom 20%: $3,177 (New York: $13,020)
> Share of all income in Ithaca that went to top 20%: 60.1% (New York: 54.3%)
> Share of all income in Ithaca that went to bottom 20%: 1.0% (New York: 2.6%)
> Median household income: $34,424 (New York: $68,486)

Source: Ryan Herron / E+ via Getty Images
North Carolina: Chapel Hill
> Gini index: 0.549 (North Carolina: 0.476)
> Avg. household income, top 20%: $349,298 (North Carolina: $196,793)
> Avg. household income, bottom 20%: $11,245 (North Carolina: $12,761)
> Share of all income in Chapel Hill that went to top 20%: 56.7% (North Carolina: 51.2%)
> Share of all income in Chapel Hill that went to bottom 20%: 1.8% (North Carolina: 3.3%)
> Median household income: $73,614 (North Carolina: $54,602)

Source: DenisTangneyJr / iStock via Getty Images
North Dakota: Grand Forks
> Gini index: 0.489 (North Dakota: 0.454)
> Avg. household income, top 20%: $181,320 (North Dakota: $208,518)
> Avg. household income, bottom 20%: $9,679 (North Dakota: $14,804)
> Share of all income in Grand Forks that went to top 20%: 51.3% (North Dakota: 48.8%)
> Share of all income in Grand Forks that went to bottom 20%: 2.7% (North Dakota: 3.5%)
> Median household income: $50,076 (North Dakota: $64,894)
[in-text-ad-2]

Source: DenisTangneyJr / Getty Images
Ohio: Cincinnati
> Gini index: 0.541 (Ohio: 0.465)
> Avg. household income, top 20%: $185,279 (Ohio: $192,225)
> Avg. household income, bottom 20%: $7,255 (Ohio: $12,861)
> Share of all income in Cincinnati that went to top 20%: 56.8% (Ohio: 50.0%)
> Share of all income in Cincinnati that went to bottom 20%: 2.2% (Ohio: 3.3%)
> Median household income: $40,640 (Ohio: $56,602)
Source: DenisTangneyJr / iStock Unreleased via Getty Images
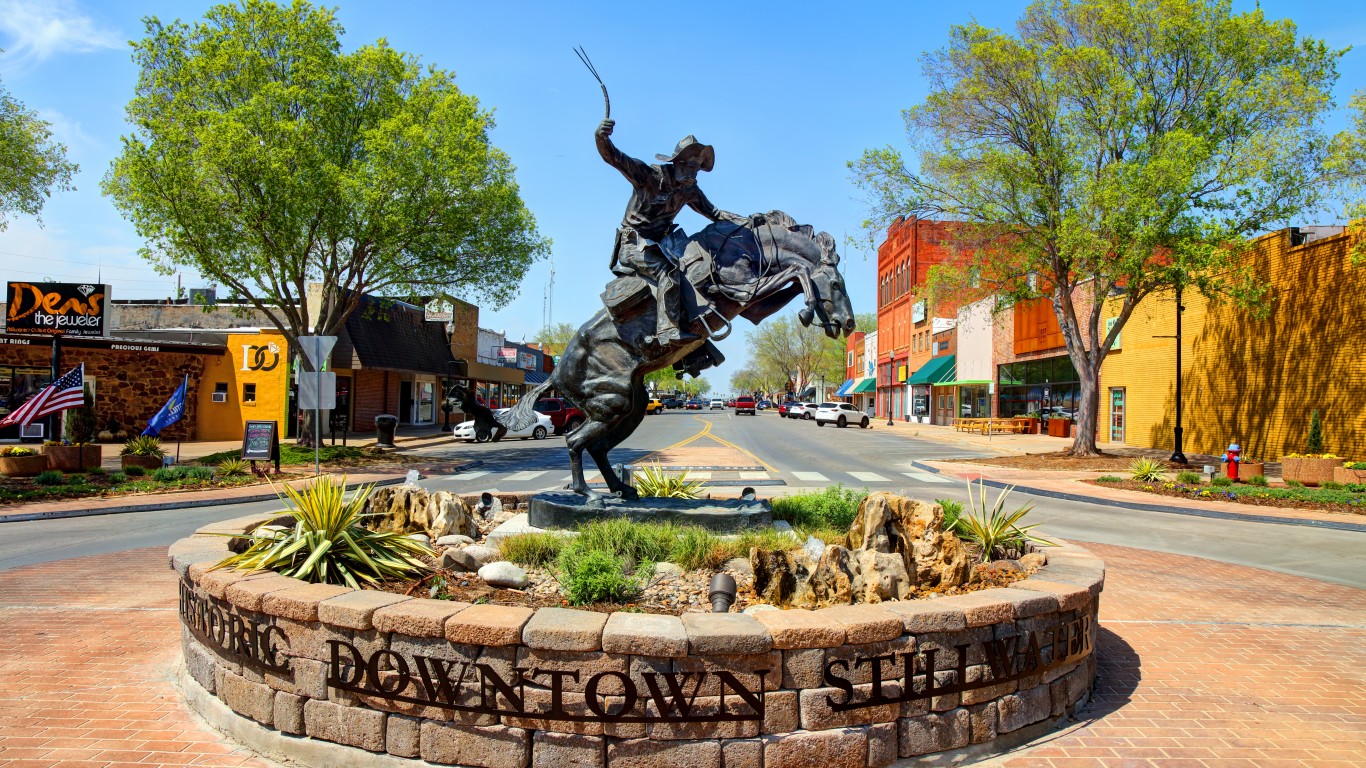
Oklahoma: Stillwater
> Gini index: 0.561 (Oklahoma: 0.469)
> Avg. household income, top 20%: $166,775 (Oklahoma: $183,130)
> Avg. household income, bottom 20%: $4,192 (Oklahoma: $12,268)
> Share of all income in Stillwater that went to top 20%: 57.7% (Oklahoma: 50.4%)
> Share of all income in Stillwater that went to bottom 20%: 1.5% (Oklahoma: 3.4%)
> Median household income: $34,309 (Oklahoma: $52,919)
[in-text-ad]

Source: Daphne Zheng / iStock via Getty Images
Oregon: Corvallis
> Gini index: 0.504 (Oregon: 0.459)
> Avg. household income, top 20%: $195,450 (Oregon: $208,393)
> Avg. household income, bottom 20%: $8,160 (Oregon: $14,622)
> Share of all income in Corvallis that went to top 20%: 52.6% (Oregon: 49.5%)
> Share of all income in Corvallis that went to bottom 20%: 2.2% (Oregon: 3.5%)
> Median household income: $52,942 (Oregon: $62,818)
 24/7 Wall St.
Source: aimintang / Getty Images
Pennsylvania: State College
> Gini index: 0.569 (Pennsylvania: 0.472)
> Avg. household income, top 20%: $171,136 (Pennsylvania: $214,725)
> Avg. household income, bottom 20%: $2,771 (Pennsylvania: $13,887)
> Share of all income in State College that went to top 20%: 59.0% (Pennsylvania: 50.6%)
> Share of all income in State College that went to bottom 20%: 0.9% (Pennsylvania: 3.3%)
> Median household income: $34,005 (Pennsylvania: $61,744)

Source: DenisTangneyJr / Getty Images
Rhode Island: Providence
> Gini index: 0.541 (Rhode Island: 0.47)
> Avg. household income, top 20%: $200,972 (Rhode Island: $222,204)
> Avg. household income, bottom 20%: $7,807 (Rhode Island: $13,273)
> Share of all income in Providence that went to top 20%: 56.5% (Rhode Island: 49.9%)
> Share of all income in Providence that went to bottom 20%: 2.2% (Rhode Island: 3.0%)
> Median household income: $45,610 (Rhode Island: $67,167)
[in-text-ad-2]

Source: SeanPavonePhoto / Getty Images
South Carolina: Columbia
> Gini index: 0.548 (South Carolina: 0.474)
> Avg. household income, top 20%: $219,240 (South Carolina: $186,571)
> Avg. household income, bottom 20%: $7,675 (South Carolina: $11,736)
> Share of all income in Columbia that went to top 20%: 57.6% (South Carolina: 50.8%)
> Share of all income in Columbia that went to bottom 20%: 2.0% (South Carolina: 3.2%)
> Median household income: $47,286 (South Carolina: $53,199)
Source: EunikaSopotnicka / Getty Images
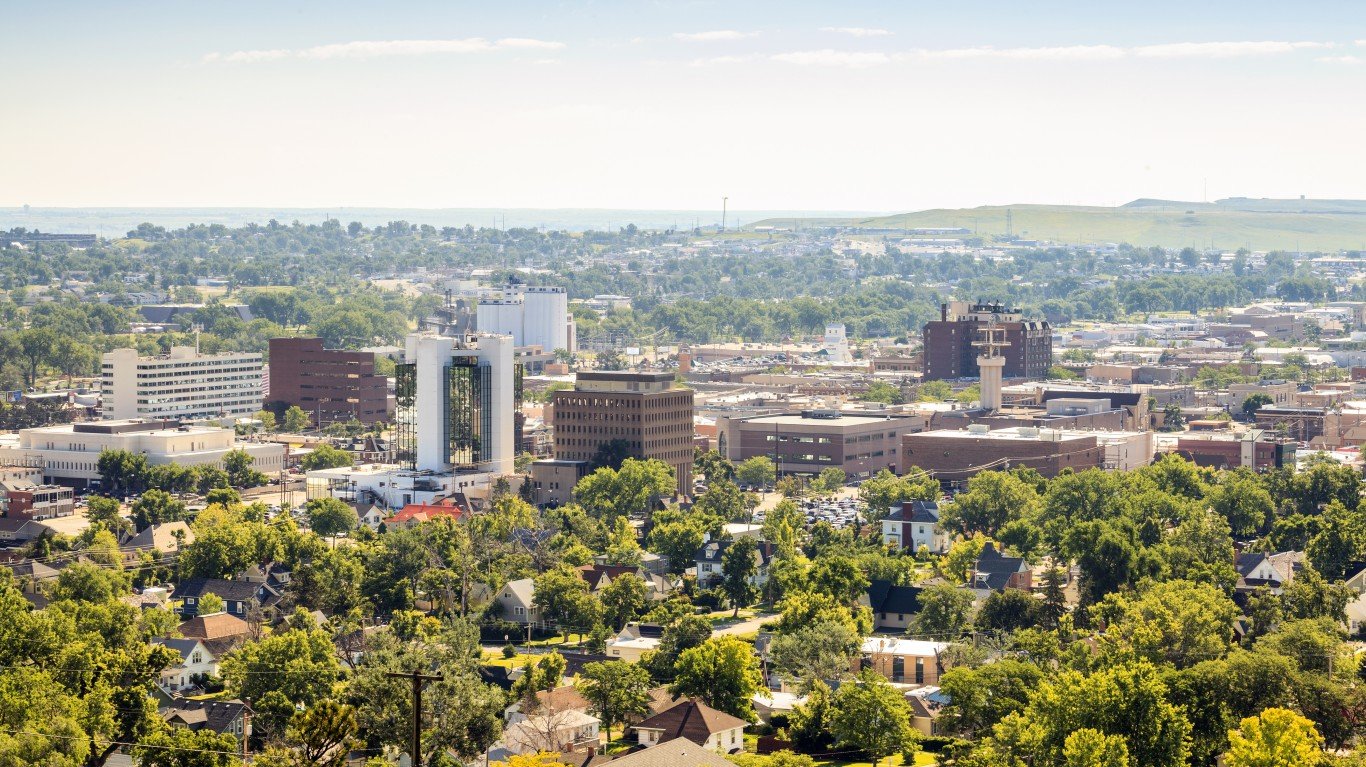
South Dakota: Rapid City
> Gini index: 0.473 (South Dakota: 0.444)
> Avg. household income, top 20%: $188,826 (South Dakota: $183,626)
> Avg. household income, bottom 20%: $13,396 (South Dakota: $14,543)
> Share of all income in Rapid City that went to top 20%: 51.3% (South Dakota: 48.2%)
> Share of all income in Rapid City that went to bottom 20%: 3.6% (South Dakota: 3.8%)
> Median household income: $52,351 (South Dakota: $58,275)
[in-text-ad]

Source: DenisTangneyJr / iStock via Getty Images
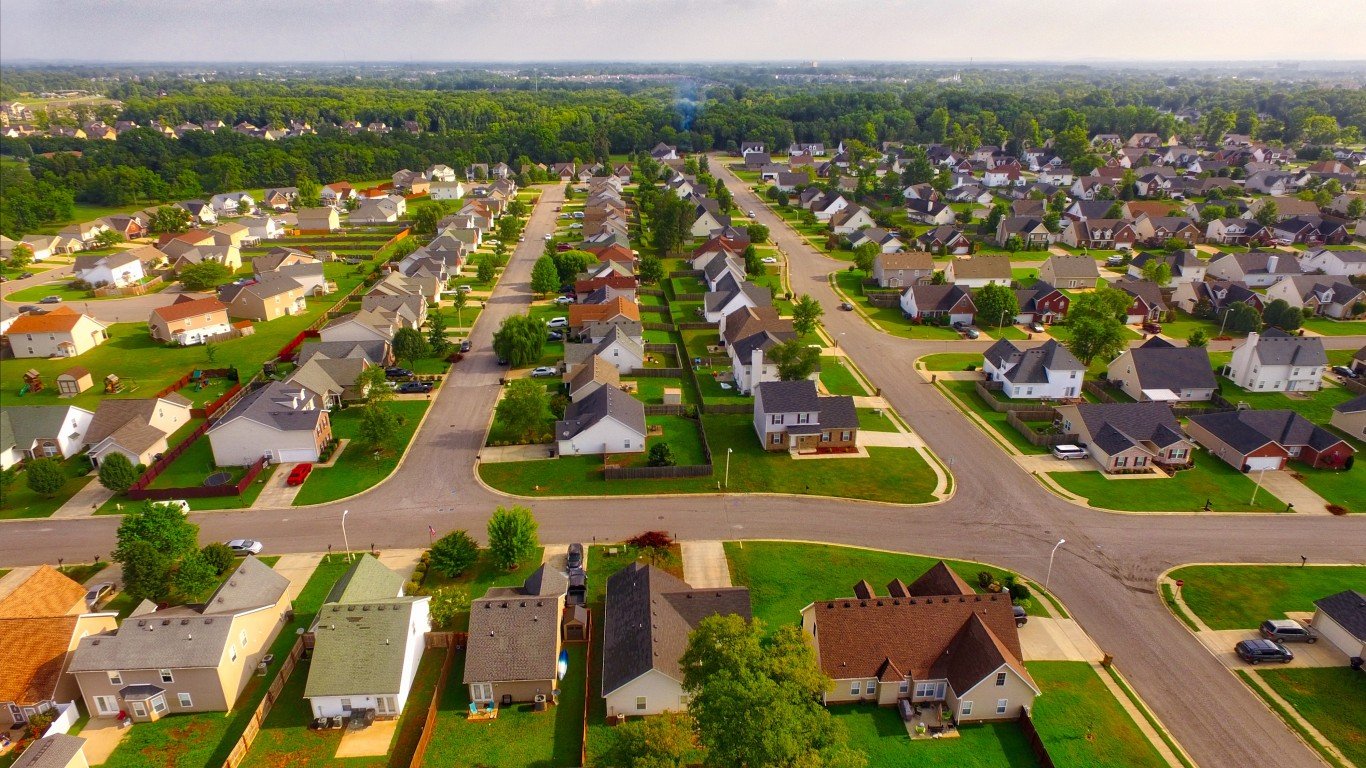
Tennessee: Johnson City
> Gini index: 0.541 (Tennessee: 0.479)
> Avg. household income, top 20%: $199,035 (Tennessee: $191,924)
> Avg. household income, bottom 20%: $8,378 (Tennessee: $12,221)
> Share of all income in Johnson City that went to top 20%: 57.2% (Tennessee: 51.3%)
> Share of all income in Johnson City that went to bottom 20%: 2.4% (Tennessee: 3.3%)
> Median household income: $41,682 (Tennessee: $53,320)
 24/7 Wall St.
Source: DenisTangneyJr / Getty Images
Texas: Texarkana
> Gini index: 0.55 (Texas: 0.479)
> Avg. household income, top 20%: $205,398 (Texas: $224,146)
> Avg. household income, bottom 20%: $7,427 (Texas: $14,034)
> Share of all income in Texarkana that went to top 20%: 57.7% (Texas: 51.4%)
> Share of all income in Texarkana that went to bottom 20%: 2.1% (Texas: 3.2%)
> Median household income: $45,080 (Texas: $61,874)

Source: 4kodiak / Getty Images
Utah: Salt Lake City
> Gini index: 0.501 (Utah: 0.426)
> Avg. household income, top 20%: $235,698 (Utah: $214,437)
> Avg. household income, bottom 20%: $12,454 (Utah: $19,112)
> Share of all income in Salt Lake City that went to top 20%: 53.5% (Utah: 47.0%)
> Share of all income in Salt Lake City that went to bottom 20%: 2.8% (Utah: 4.2%)
> Median household income: $60,676 (Utah: $71,621)
[in-text-ad-2]

Source: DenisTangneyJr / Getty Images
Vermont: Burlington*
> Gini index: 0.496 (Vermont: 0.448)
> Avg. household income, top 20%: $186,745 (Vermont: $196,616)
> Avg. household income, bottom 20%: $9,650 (Vermont: $14,666)
> Share of all income in Burlington that went to top 20%: 52.1% (Vermont: 48.4%)
> Share of all income in Burlington that went to bottom 20%: 2.7% (Vermont: 3.6%)
> Median household income: $51,394 (Vermont: $61,973)
*Because Burlington is the only eligible city in Vermont, it is the city with the widest income gaps by default.

Source: BigFishDesign / Getty Images
Virginia: Blacksburg
> Gini index: 0.588 (Virginia: 0.469)
> Avg. household income, top 20%: $210,738 (Virginia: $256,360)
> Avg. household income, bottom 20%: $1,776 (Virginia: $16,508)
> Share of all income in Blacksburg that went to top 20%: 59.5% (Virginia: 50.4%)
> Share of all income in Blacksburg that went to bottom 20%: 0.5% (Virginia: 3.3%)
> Median household income: $43,173 (Virginia: $74,222)
[in-text-ad]

Source: redfishweb / Getty Images
Washington: Pullman
> Gini index: 0.555 (Washington: 0.457)
> Avg. household income, top 20%: $158,178 (Washington: $244,742)
> Avg. household income, bottom 20%: $4,079 (Washington: $17,314)
> Share of all income in Pullman that went to top 20%: 57.8% (Washington: 49.5%)
> Share of all income in Pullman that went to bottom 20%: 1.5% (Washington: 3.5%)
> Median household income: $31,487 (Washington: $73,775)

Source: Sean Pavone / iStock via Getty Images
West Virginia: Charleston
> Gini index: 0.551 (West Virginia: 0.467)
> Avg. household income, top 20%: $219,063 (West Virginia: $158,941)
> Avg. household income, bottom 20%: $8,779 (West Virginia: $10,504)
> Share of all income in Charleston that went to top 20%: 58.3% (West Virginia: 49.9%)
> Share of all income in Charleston that went to bottom 20%: 2.3% (West Virginia: 3.3%)
> Median household income: $43,344 (West Virginia: $46,711)

Source: Jason_Ray_Photography / Getty Images
Wisconsin: La Crosse
> Gini index: 0.481 (Wisconsin: 0.445)
> Avg. household income, top 20%: $165,109 (Wisconsin: $194,624)
> Avg. household income, bottom 20%: $11,524 (Wisconsin: $15,311)
> Share of all income in La Crosse that went to top 20%: 51.9% (Wisconsin: 48.3%)
> Share of all income in La Crosse that went to bottom 20%: 3.6% (Wisconsin: 3.8%)
> Median household income: $45,233 (Wisconsin: $61,747)
[in-text-ad-2]
Source: RiverNorthPhotography / iStock Unreleased via Getty Images
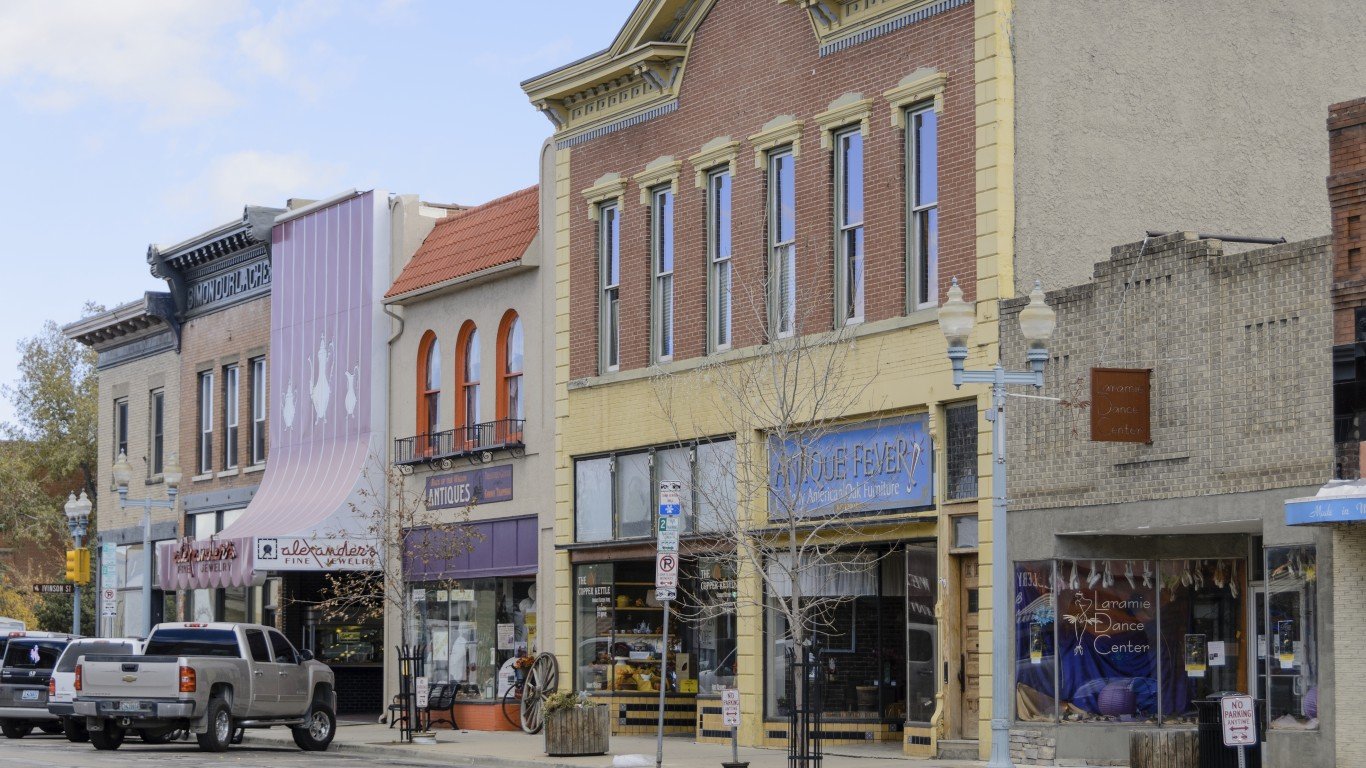
Wyoming: Laramie
> Gini index: 0.462 (Wyoming: 0.436)
> Avg. household income, top 20%: $153,257 (Wyoming: $193,249)
> Avg. household income, bottom 20%: $10,227 (Wyoming: $15,572)
> Share of all income in Laramie that went to top 20%: 49.5% (Wyoming: 47.2%)
> Share of all income in Laramie that went to bottom 20%: 3.3% (Wyoming: 3.8%)
> Median household income: $46,117 (Wyoming: $64,049)
To determine the city with the widest income gaps in every state, 24/7 Wall St. reviewed five-year estimates of the Gini Index of income inequality from the U.S. Census Bureau’s 2019 American Community Survey.
The Gini Index of income inequality summarizes income dispersion in an area on a scale from 0 to 1. A value of 0 indicates perfect equality — everyone in the area receives an equal share on income. A value of 1 indicates perfect inequality — only one recipient receives all the income.
We used Census “place” geographies — a category that includes 29,573 incorporated legal entities and Census-designated statistical entities. Of those, 29,319 had boundaries that fell within one of the 50 states, while the rest were in the District of Columbia or Puerto Rico.
We defined cities based on a population threshold — having more than 25,000 people — and 1,774 of the places fell within this threshold.
Cities were ranked within their state based on their Gini Index. To break ties, we used the share of aggregate household income earned by the top 20% of households.
Additional information on average household income by quintile, share of aggregate household income by quintile, and median household income are also five-year estimates from the 2019 ACS.
Sponsored: Attention Savvy Investors: Speak to 3 Financial Experts – FREE
Ever wanted an extra set of eyes on an investment you’re considering? Now you can speak with up to 3 financial experts in your area for FREE. By simply
clicking here you can begin to match with financial professionals who can help guide you through the financial decisions you’re making. And the best part? The first conversation with them is free.
Click here to match with up to 3 financial pros who would be excited to help you make financial decisions.
Thank you for reading! Have some feedback for us?
Contact the 24/7 Wall St. editorial team.
Editors' Picks