Fewer Americans moved to a new home in the past year than at any other time since 1948 — the earliest year with available data from the U.S. Census Bureau. Only about 27.1 million Americans moved between March 2020 and March 2021, compared to 28.7 million from 1947 to 1948, when the U.S. population was less than half its current size.
The most recent data on relocation in the United States reflects the continuation of a longer-term downward trend in domestic relocation, as moving has become less common in each of the last six years. While the COVID-19 pandemic pushed many Americans out of urban areas and into the suburbs, it also likely created many hurdles that made moving more difficult.
Regardless of the causal factors, the fact remains that only 8.4% of Americans age 1 and up moved to a new home in the past year, less than half the share reported in years passed. (This is the top city Americans are moving to.)
Most Americans who moved in the past year did not go far. The largest share of movers — 4.9% of the population — relocated to a new home within the same county. Meanwhile, 1.9% of the population moved to a new county in the same state, and just 1.4% of the population relocated to a different state. Here is a look at the 40 places where young people are moving.
Using data from the Current Population Survey from the Census Bureau, 24/7 Wall St. identified the number of Americans who moved the year you were born. Prior to 2004, the period of moving was as of March 1 of the previous year. Total number of movers includes those moving from abroad. Due to data limitations, the years 1972 through 1975 and 1977 to 1980 are not included in this analysis. All data came from the CPS.
Click here to see how many Americans moved the year you were born
Source: Three Lions / Getty Images
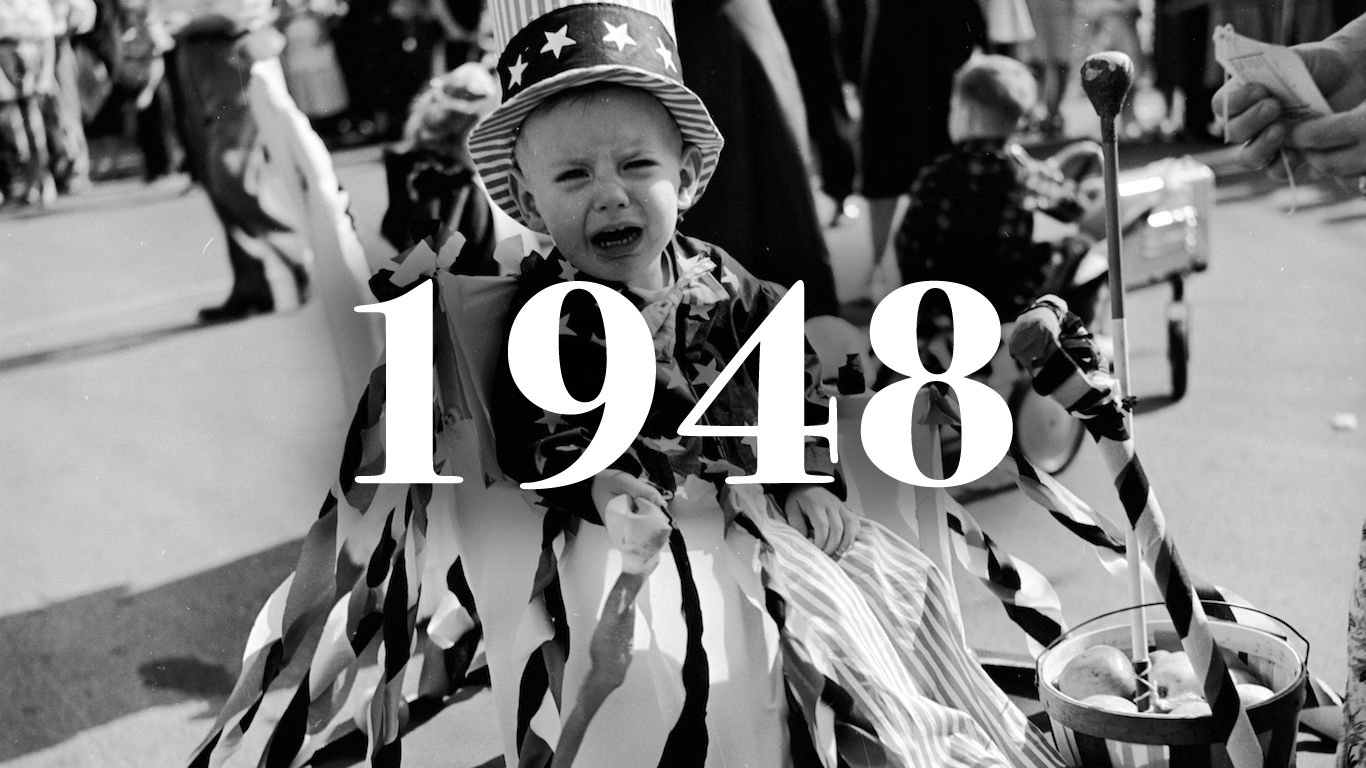
1947-1948
> Pct. 1 yr. and older who moved: 20.2% of pop. — 9th most in 66 years (28,672,000 total)
> Moved within same county: 13.6% of pop. (19,202,000 total)
> Moved to a new county in-state: 3.3% of pop. (4,638,000 total)
> Moved to a new state: 3.1% of pop. (4,370,000 total)
[in-text-ad]
Source: Hulton Archive / Getty Images
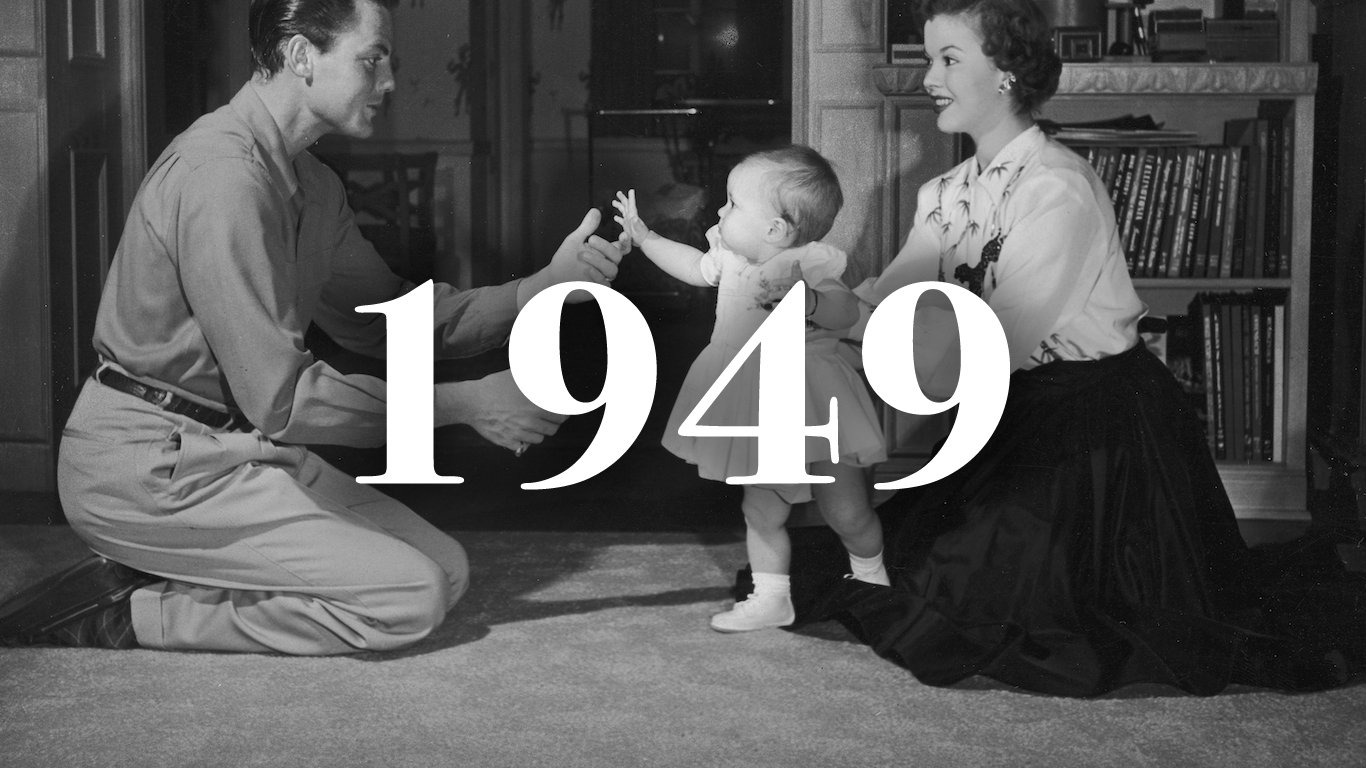
1948-1949
> Pct. 1 yr. and older who moved: 19.2% of pop. — 20th most in 66 years (27,603,000 total)
> Moved within same county: 13.0% of pop. (18,792,000 total)
> Moved to a new county in-state: 2.8% of pop. (3,992,000 total)
> Moved to a new state: 3.0% of pop. (4,344,000 total)
Source: George Konig / Keystone Features / Getty Images
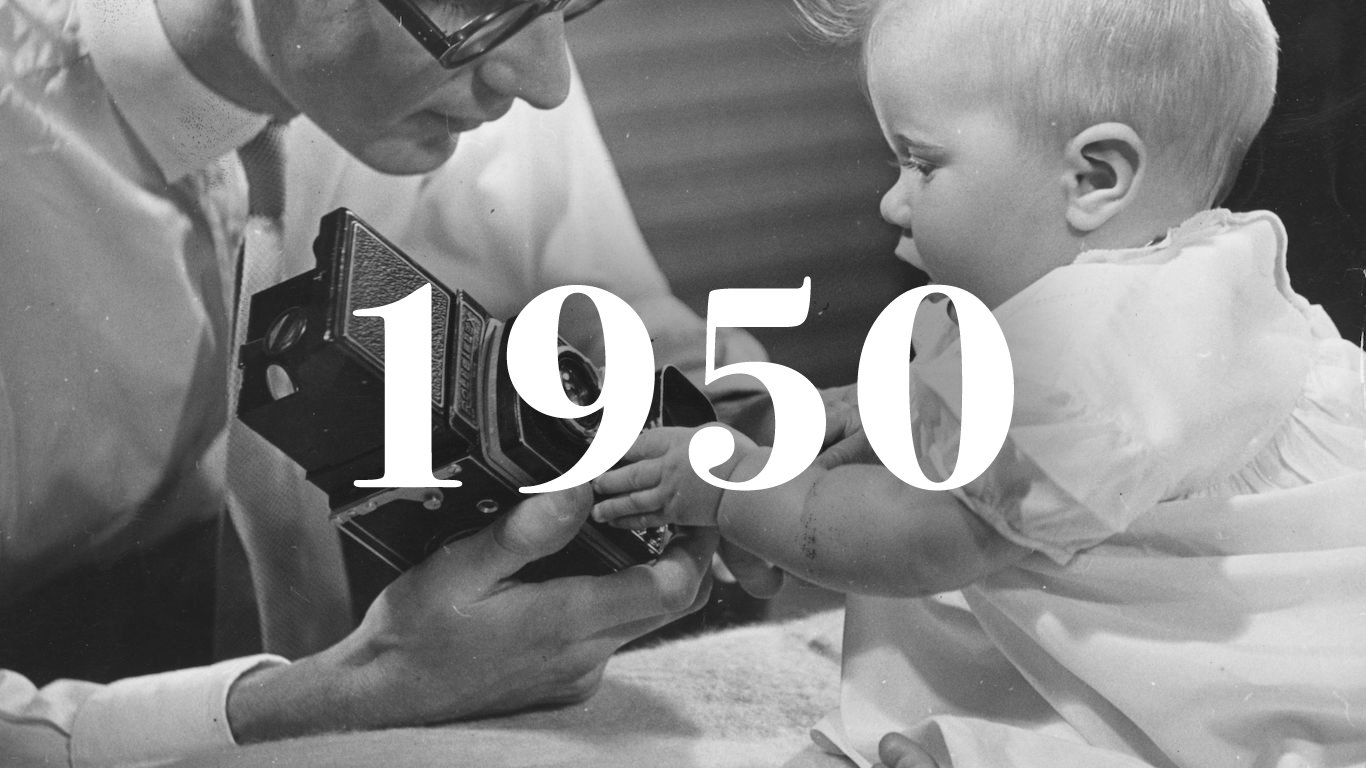
1949-1950
> Pct. 1 yr. and older who moved: 19.1% of pop. — 21st most in 66 years (28,015,000 total)
> Moved within same county: 13.1% of pop. (19,276,000 total)
> Moved to a new county in-state: 3.0% of pop. (4,360,000 total)
> Moved to a new state: 2.6% of pop. (3,889,000 total)
Source: Hulton Archive / Getty Images
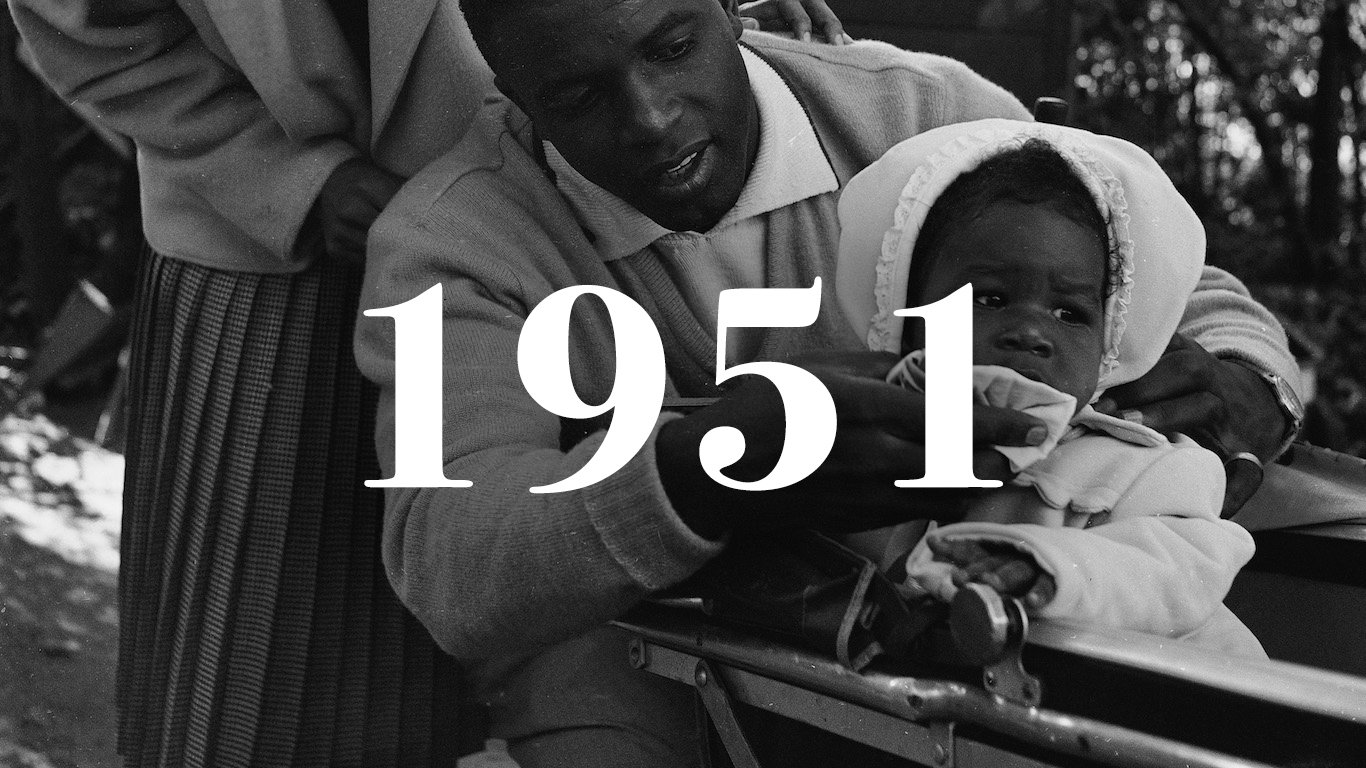
1950-1951
> Pct. 1 yr. and older who moved: 21.2% of pop. — most in 66 years (31,464,000 total)
> Moved within same county: 13.9% of pop. (20,694,000 total)
> Moved to a new county in-state: 3.6% of pop. (5,276,000 total)
> Moved to a new state: 3.5% of pop. (5,188,000 total)
Source: Housewife / Getty Images
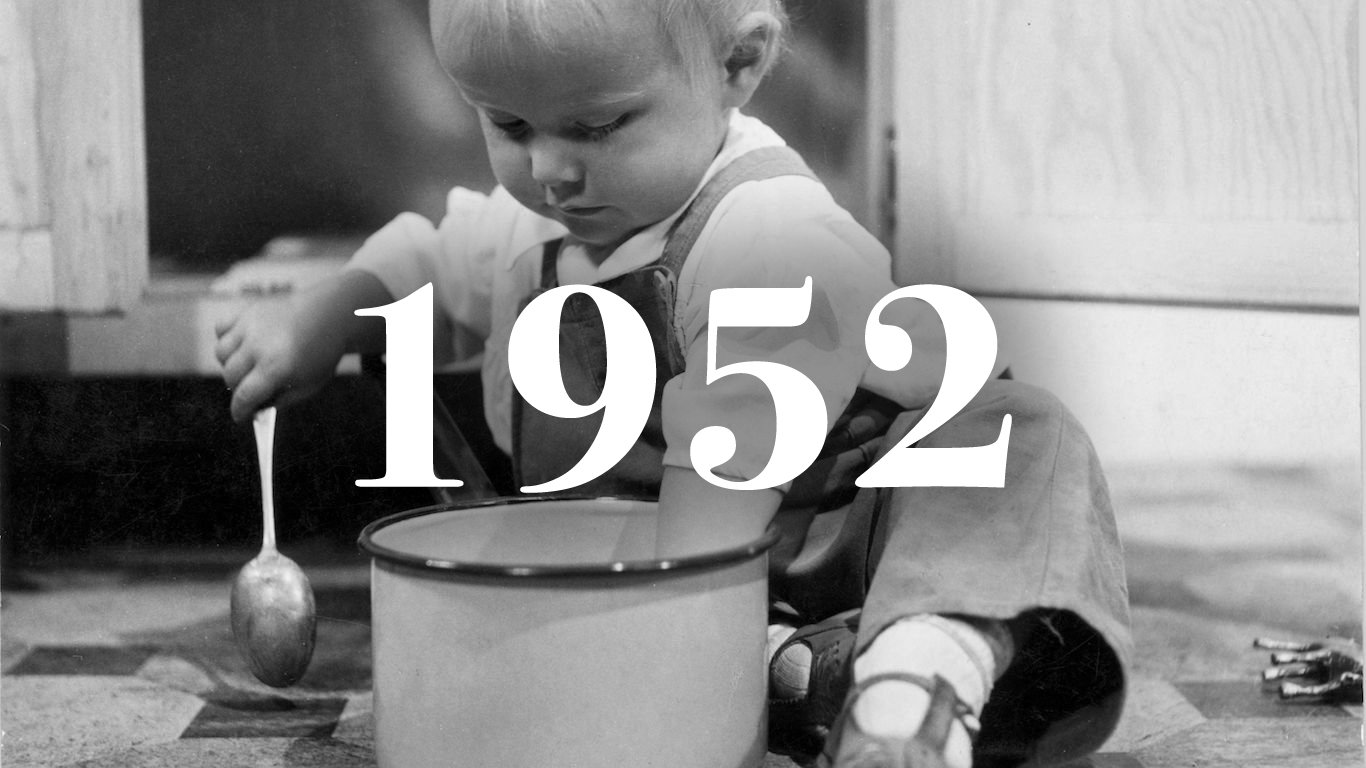
1951-1952
> Pct. 1 yr. and older who moved: 20.3% of pop. — 7th most in 66 years (30,478,000 total)
> Moved within same county: 13.2% of pop. (19,874,000 total)
> Moved to a new county in-state: 3.2% of pop. (4,854,000 total)
> Moved to a new state: 3.4% of pop. (5,112,000 total)
Source: Alan Meek / Express / Getty Images
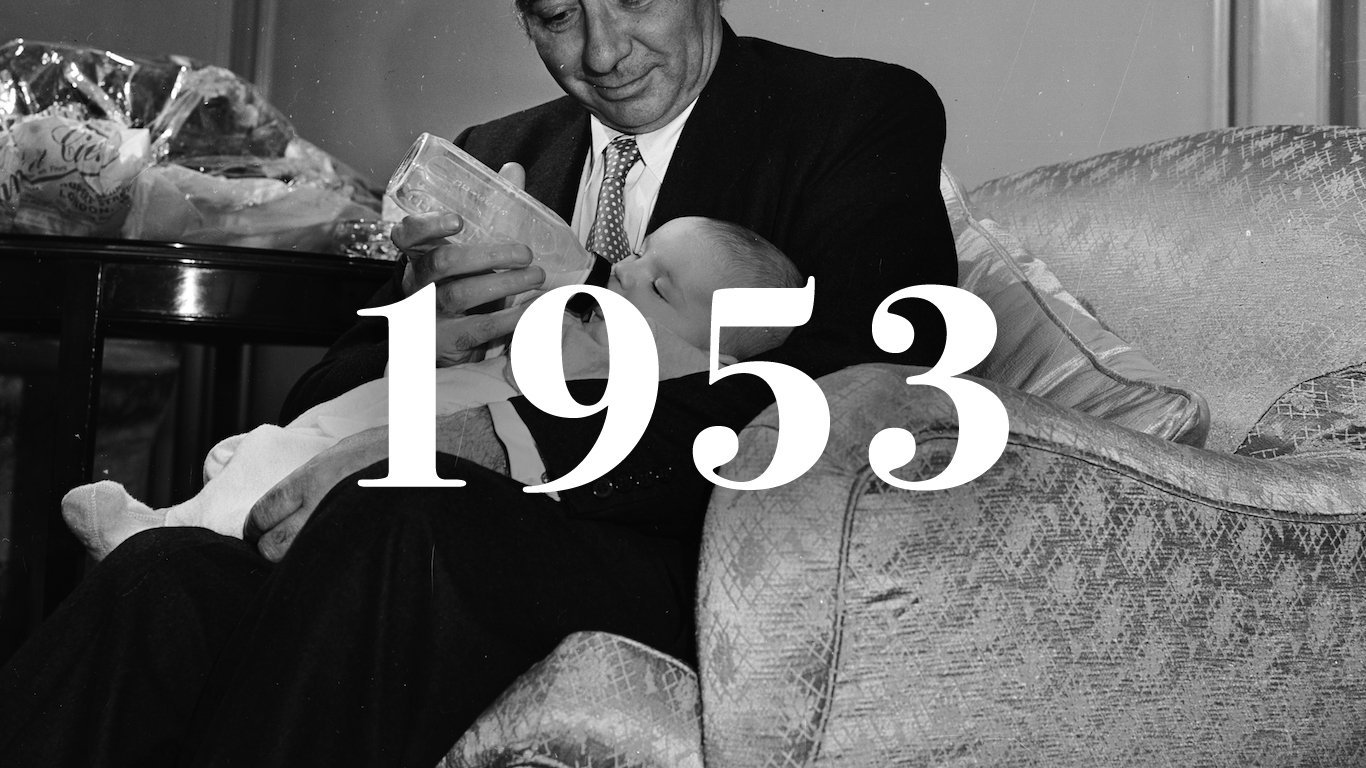
1952-1953
> Pct. 1 yr. and older who moved: 20.6% of pop. — 4th most in 66 years (31,526,000 total)
> Moved within same county: 13.5% of pop. (20,638,000 total)
> Moved to a new county in-state: 3.0% of pop. (4,626,000 total)
> Moved to a new state: 3.6% of pop. (5,522,000 total)
Source: Central Press / Getty Images
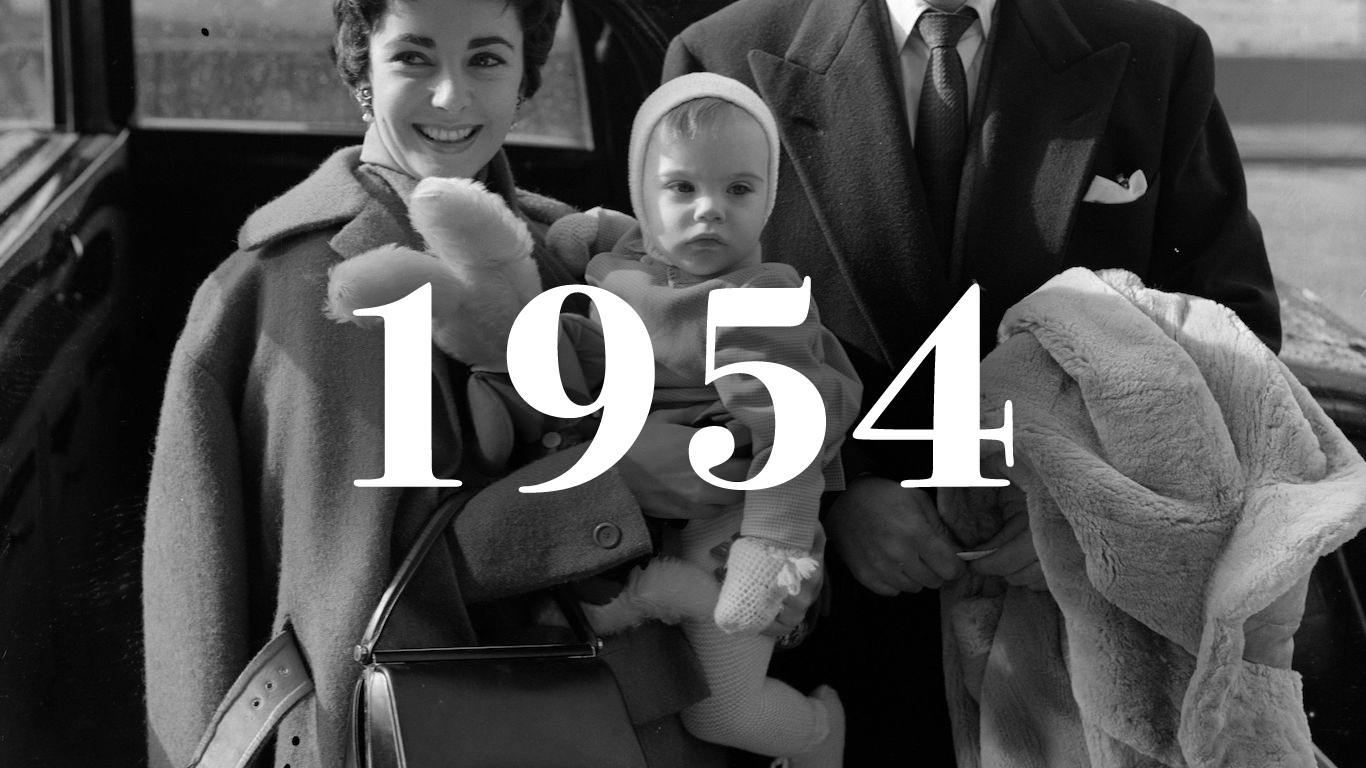
1953-1954
> Pct. 1 yr. and older who moved: 19.3% of pop. — 19th most in 66 years (30,025,000 total)
> Moved within same county: 12.2% of pop. (19,046,000 total)
> Moved to a new county in-state: 3.2% of pop. (4,947,000 total)
> Moved to a new state: 3.2% of pop. (5,034,000 total)
[in-text-ad-2]
Source: Carsten / Three Lions / Getty Images
1954-1955
> Pct. 1 yr. and older who moved: 20.4% of pop. — 6th most in 66 years (32,419,000 total)
> Moved within same county: 13.3% of pop. (21,086,000 total)
> Moved to a new county in-state: 3.5% of pop. (5,511,000 total)
> Moved to a new state: 3.1% of pop. (4,895,000 total)
Source: Terry Fincher / Keystone / Getty Images
1955-1956
> Pct. 1 yr. and older who moved: 21.1% of pop. — 2nd most in 66 years (34,040,000 total)
> Moved within same county: 13.7% of pop. (22,186,000 total)
> Moved to a new county in-state: 3.6% of pop. (5,859,000 total)
> Moved to a new state: 3.1% of pop. (5,053,000 total)
Source: Chaloner Woods / Getty Images
1956-1957
> Pct. 1 yr. and older who moved: 19.9% of pop. — 13th most in 66 years (32,723,000 total)
> Moved within same county: 13.1% of pop. (21,566,000 total)
> Moved to a new county in-state: 3.2% of pop. (5,192,000 total)
> Moved to a new state: 3.1% of pop. (5,076,000 total)
Source: Keystone / Getty Images
1957-1958
> Pct. 1 yr. and older who moved: 20.3% of pop. — 7th most in 66 years (34,103,000 total)
> Moved within same county: 13.1% of pop. (22,023,000 total)
> Moved to a new county in-state: 3.4% of pop. (5,656,000 total)
> Moved to a new state: 3.3% of pop. (5,584,000 total)
[in-text-ad]
Source: Reg Speller / Fox Photos / Getty Images
1958-1959
> Pct. 1 yr. and older who moved: 19.7% of pop. — 16th most in 66 years (33,640,000 total)
> Moved within same county: 13.1% of pop. (22,315,000 total)
> Moved to a new county in-state: 3.2% of pop. (5,419,000 total)
> Moved to a new state: 3.0% of pop. (5,070,000 total)
Source: Keystone / Getty Images
1959-1960
> Pct. 1 yr. and older who moved: 19.9% of pop. — 13th most in 66 years (34,685,000 total)
> Moved within same county: 12.9% of pop. (22,564,000 total)
> Moved to a new county in-state: 3.3% of pop. (5,724,000 total)
> Moved to a new state: 3.2% of pop. (5,523,000 total)
Source: Keystone / Hulton Archive / Getty Images
1960-1961
> Pct. 1 yr. and older who moved: 20.6% of pop. — 4th most in 66 years (36,533,000 total)
> Moved within same county: 13.7% of pop. (24,289,000 total)
> Moved to a new county in-state: 3.1% of pop. (5,493,000 total)
> Moved to a new state: 3.2% of pop. (5,753,000 total)
 24/7 Wall St.
Source: Chaloner Woods / Getty Images
1961-1962
> Pct. 1 yr. and older who moved: 19.6% of pop. — 17th most in 66 years (35,218,000 total)
> Moved within same county: 13.0% of pop. (23,341,000 total)
> Moved to a new county in-state: 3.0% of pop. (5,461,000 total)
> Moved to a new state: 3.1% of pop. (5,562,000 total)
Source: Keystone / Getty Images
1962-1963
> Pct. 1 yr. and older who moved: 20.0% of pop. — 12th most in 66 years (36,432,000 total)
> Moved within same county: 12.6% of pop. (23,059,000 total)
> Moved to a new county in-state: 3.1% of pop. (5,712,000 total)
> Moved to a new state: 3.6% of pop. (6,640,000 total)
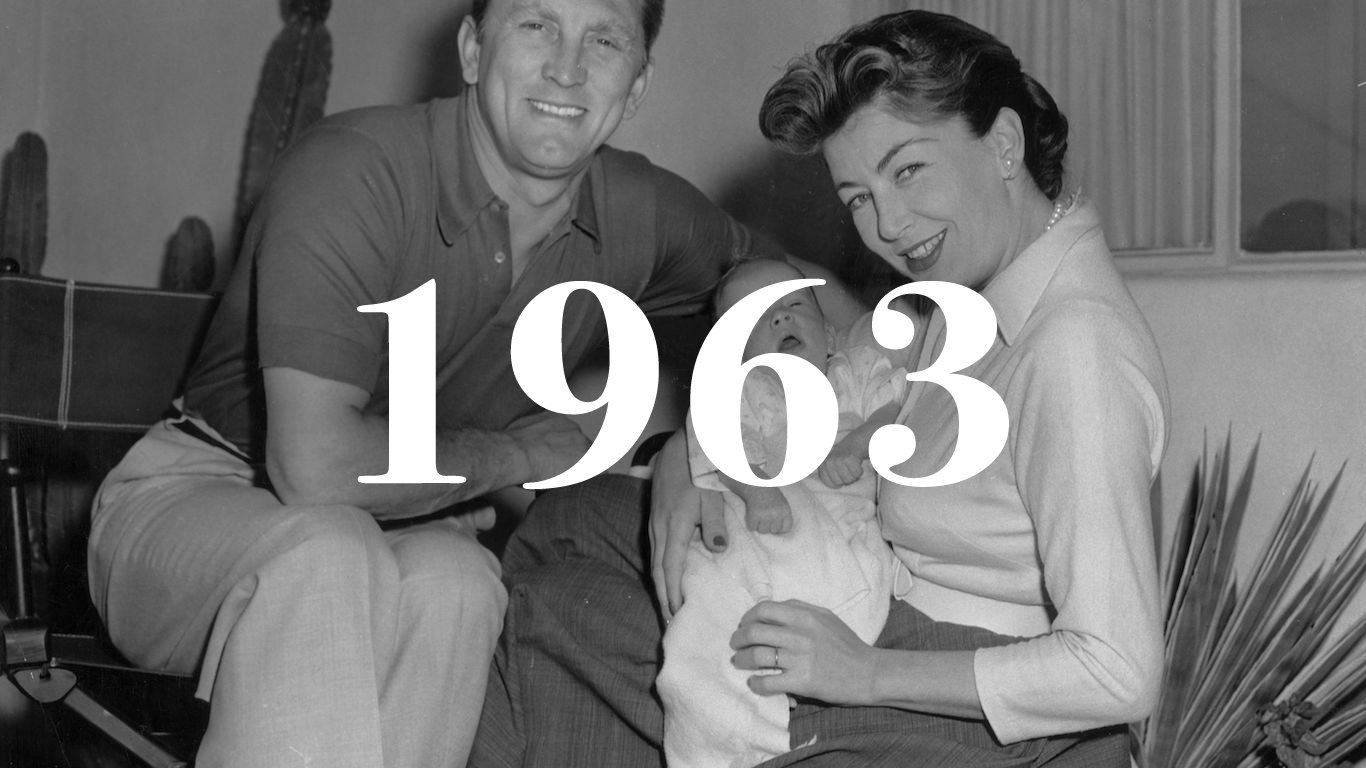
Source: Evening Standard / Getty Images
1963-1964
> Pct. 1 yr. and older who moved: 20.1% of pop. — 11th most in 66 years (37,187,000 total)
> Moved within same county: 13.0% of pop. (24,089,000 total)
> Moved to a new county in-state: 3.3% of pop. (6,191,000 total)
> Moved to a new state: 3.3% of pop. (6,047,000 total)
[in-text-ad-2]
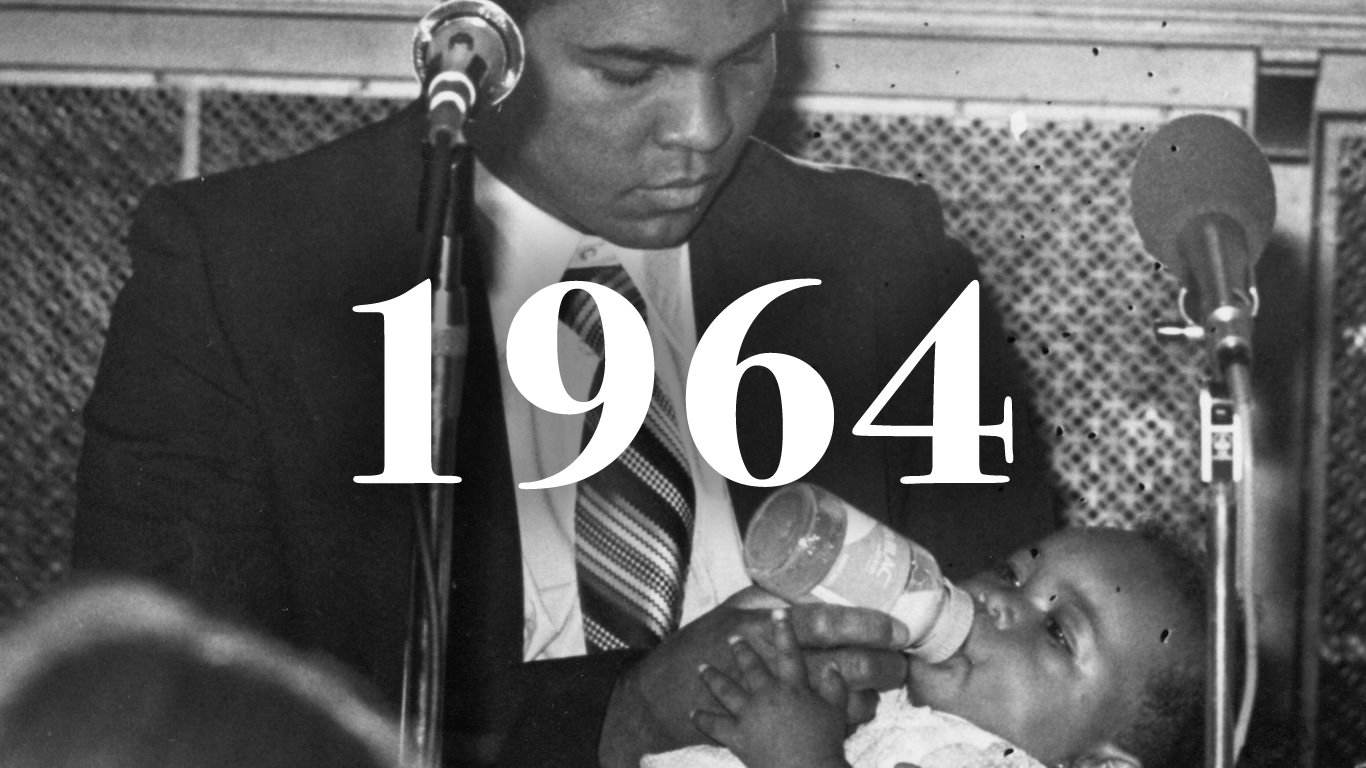
Source: Keystone / Getty Images
1964-1965
> Pct. 1 yr. and older who moved: 20.7% of pop. — 3rd most in 66 years (38,846,000 total)
> Moved within same county: 13.4% of pop. (25,122,000 total)
> Moved to a new county in-state: 3.5% of pop. (6,597,000 total)
> Moved to a new state: 3.3% of pop. (6,147,000 total)
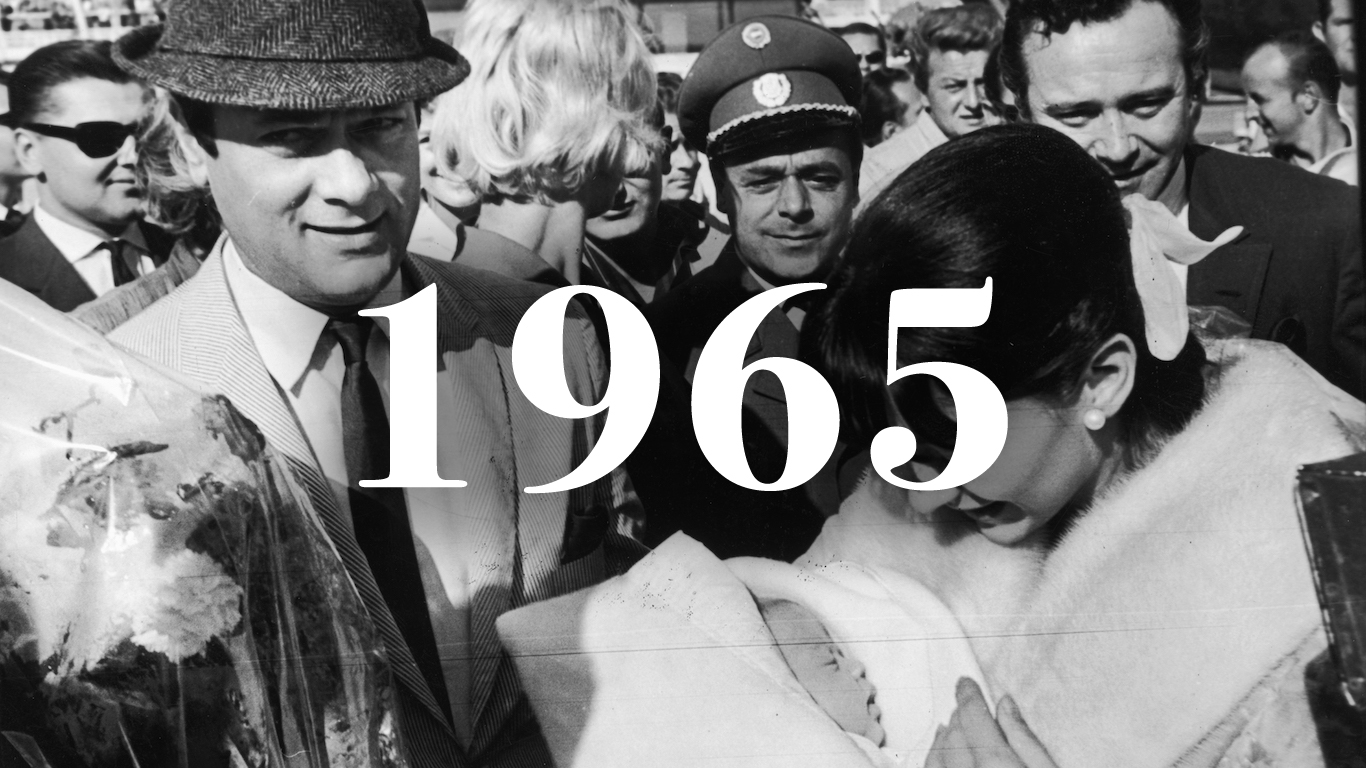
Source: Chris Ware / Keystone Features / Getty Images
1965-1966
> Pct. 1 yr. and older who moved: 19.8% of pop. — 15th most in 66 years (37,586,000 total)
> Moved within same county: 12.7% of pop. (24,165,000 total)
> Moved to a new county in-state: 3.3% of pop. (6,275,000 total)
> Moved to a new state: 3.3% of pop. (6,263,000 total)
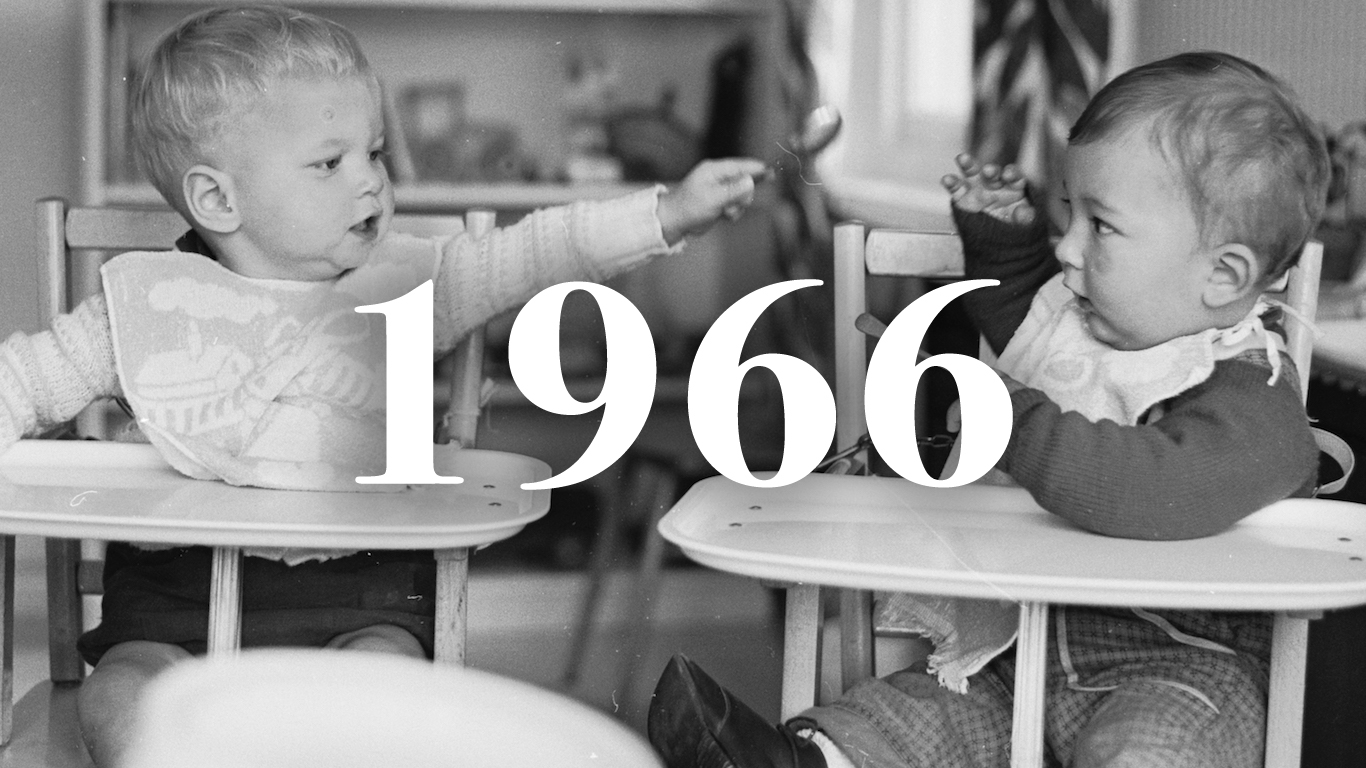
Source: Express / Express / Getty Images
1966-1967
> Pct. 1 yr. and older who moved: 19.0% of pop. — 23rd most in 66 years (36,523,000 total)
> Moved within same county: 11.6% of pop. (22,339,000 total)
> Moved to a new county in-state: 3.3% of pop. (6,308,000 total)
> Moved to a new state: 3.4% of pop. (6,553,000 total)
Source: Getty Images
1967-1968
> Pct. 1 yr. and older who moved: 19.5% of pop. — 18th most in 66 years (37,886,000 total)
> Moved within same county: 11.8% of pop. (22,960,000 total)
> Moved to a new county in-state: 3.4% of pop. (6,607,000 total)
> Moved to a new state: 3.6% of pop. (7,035,000 total)
[in-text-ad]
Source: Keystone / Getty Images
1968-1969
> Pct. 1 yr. and older who moved: 19.0% of pop. — 23rd most in 66 years (37,332,000 total)
> Moved within same county: 11.7% of pop. (22,993,000 total)
> Moved to a new county in-state: 3.2% of pop. (6,316,000 total)
> Moved to a new state: 3.4% of pop. (6,625,000 total)
Source: Paramount Pictures / Courtesy of Getty Images
1969-1970
> Pct. 1 yr. and older who moved: 19.1% of pop. — 21st most in 66 years (38,095,000 total)
> Moved within same county: 11.7% of pop. (23,225,000 total)
> Moved to a new county in-state: 3.1% of pop. (6,250,000 total)
> Moved to a new state: 3.6% of pop. (7,066,000 total)
Source: Dwayne Bey / Getty Images
1970-1971
> Pct. 1 yr. and older who moved: 18.7% of pop. — 25th most in 66 years (37,705,000 total)
> Moved within same county: 11.4% of pop. (23,018,000 total)
> Moved to a new county in-state: 3.1% of pop. (6,197,000 total)
> Moved to a new state: 3.4% of pop. (6,946,000 total)
Source: Archive Photos / Getty Images
1975-1976
> Pct. 1 yr. and older who moved: 17.7% of pop. — 31st most in 66 years (36,793,000 total)
> Moved within same county: 10.8% of pop. (22,399,000 total)
> Moved to a new county in-state: 3.4% of pop. (7,106,000 total)
> Moved to a new state: 3.0% of pop. (6,140,000 total)
Source: Getty Images
1980-1981
> Pct. 1 yr. and older who moved: 17.2% of pop. — 34th most in 66 years (38,200,000 total)
> Moved within same county: 10.4% of pop. (23,097,000 total)
> Moved to a new county in-state: 3.4% of pop. (7,614,000 total)
> Moved to a new state: 2.8% of pop. (6,175,000 total)
Source: cws_design / Getty Images
1981-1982
> Pct. 1 yr. and older who moved: 17.0% of pop. — 35th most in 66 years (38,127,000 total)
> Moved within same county: 10.3% of pop. (23,081,000 total)
> Moved to a new county in-state: 3.3% of pop. (7,330,000 total)
> Moved to a new state: 3.0% of pop. (6,628,000 total)
[in-text-ad-2]
Source: Hulton Archive / Getty Images
1982-1983
> Pct. 1 yr. and older who moved: 16.6% of pop. — 39th most in 66 years (37,408,000 total)
> Moved within same county: 10.1% of pop. (22,858,000 total)
> Moved to a new county in-state: 3.3% of pop. (7,403,000 total)
> Moved to a new state: 2.7% of pop. (6,169,000 total)
Source: bgwalker / Getty Images
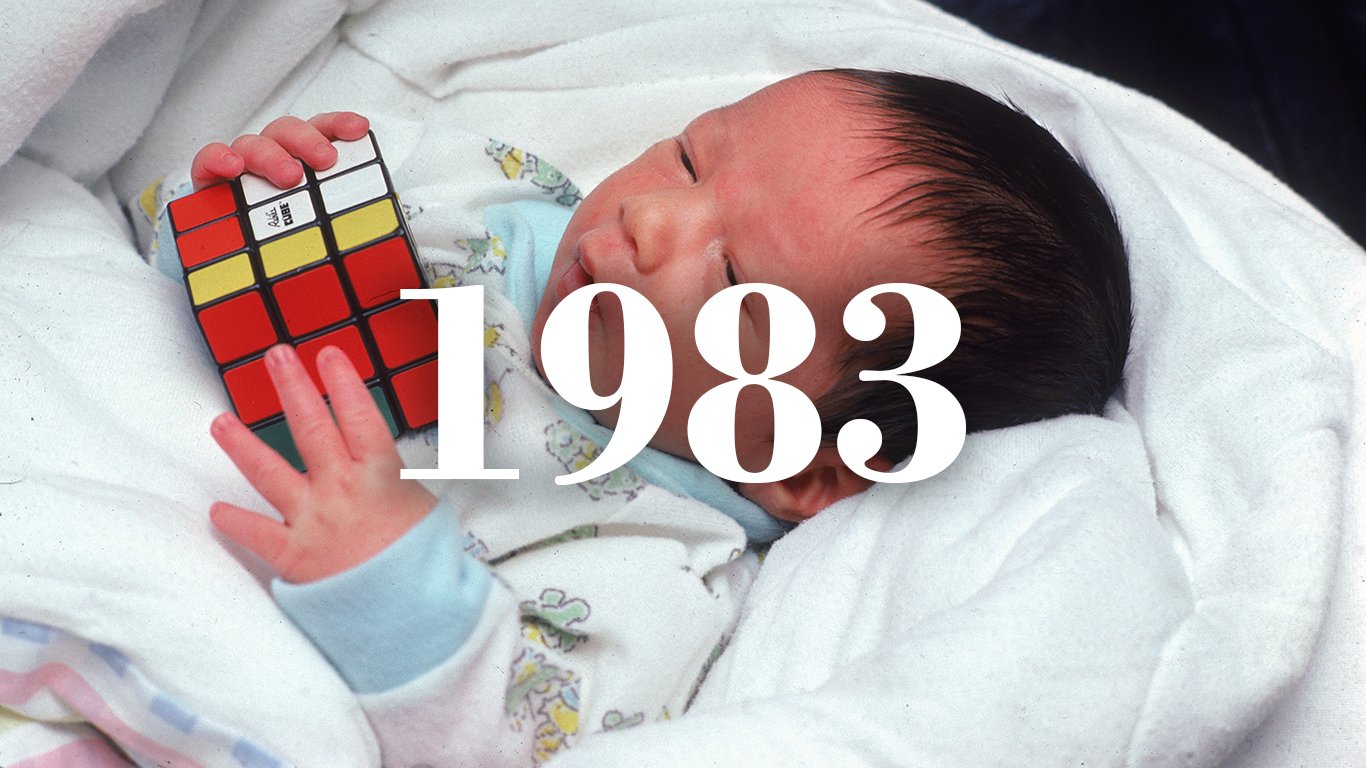
1983-1984
> Pct. 1 yr. and older who moved: 17.3% of pop. — 32nd most in 66 years (39,379,000 total)
> Moved within same county: 10.4% of pop. (23,659,000 total)
> Moved to a new county in-state: 3.6% of pop. (8,198,000 total)
> Moved to a new state: 2.8% of pop. (6,444,000 total)

Source: cws_design / Getty Images
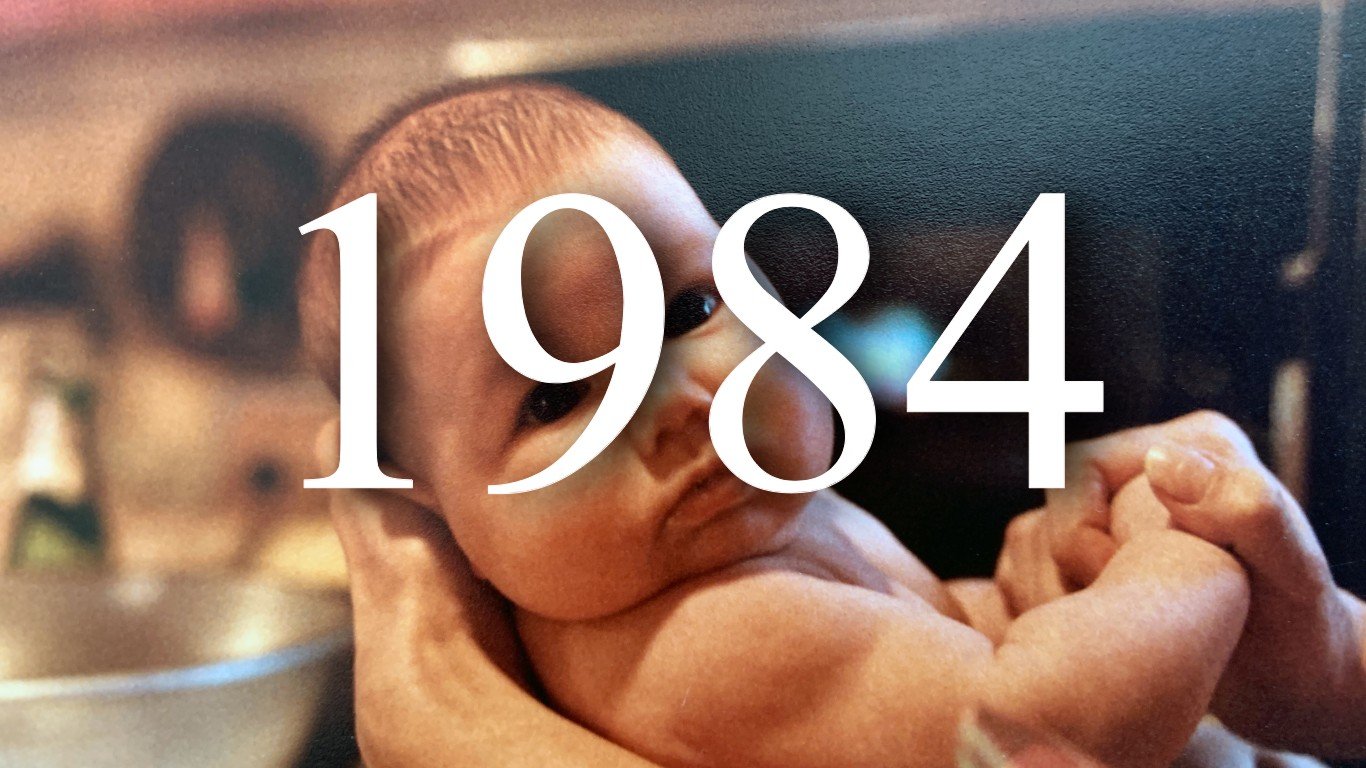
1984-1985
> Pct. 1 yr. and older who moved: 20.2% of pop. — 9th most in 66 years (46,470,000 total)
> Moved within same county: 13.1% of pop. (30,126,000 total)
> Moved to a new county in-state: 3.5% of pop. (7,995,000 total)
> Moved to a new state: 3.0% of pop. (6,921,000 total)
Source: Getty Images
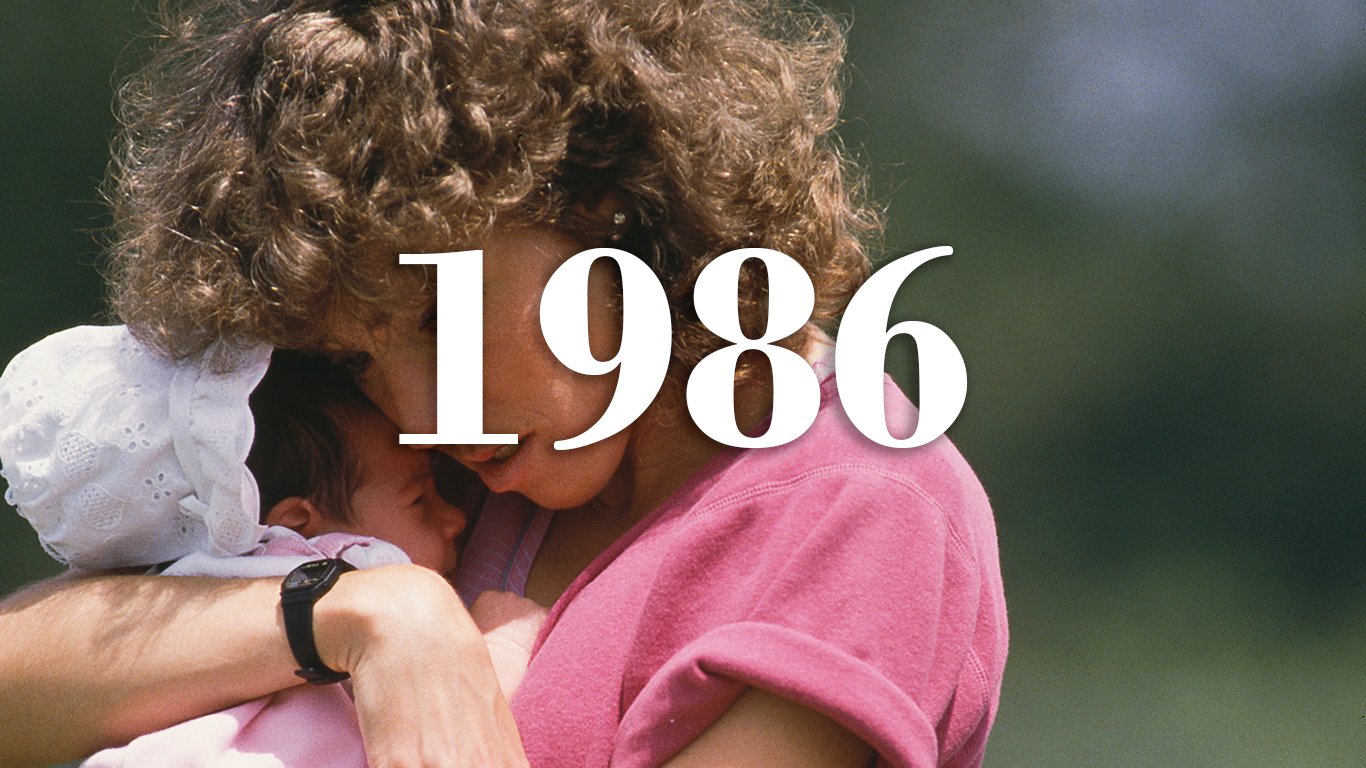
1985-1986
> Pct. 1 yr. and older who moved: 18.6% of pop. — 26th most in 66 years (43,237,000 total)
> Moved within same county: 11.3% of pop. (26,401,000 total)
> Moved to a new county in-state: 3.7% of pop. (8,665,000 total)
> Moved to a new state: 3.0% of pop. (6,971,000 total)
[in-text-ad]
Source: Getty Images
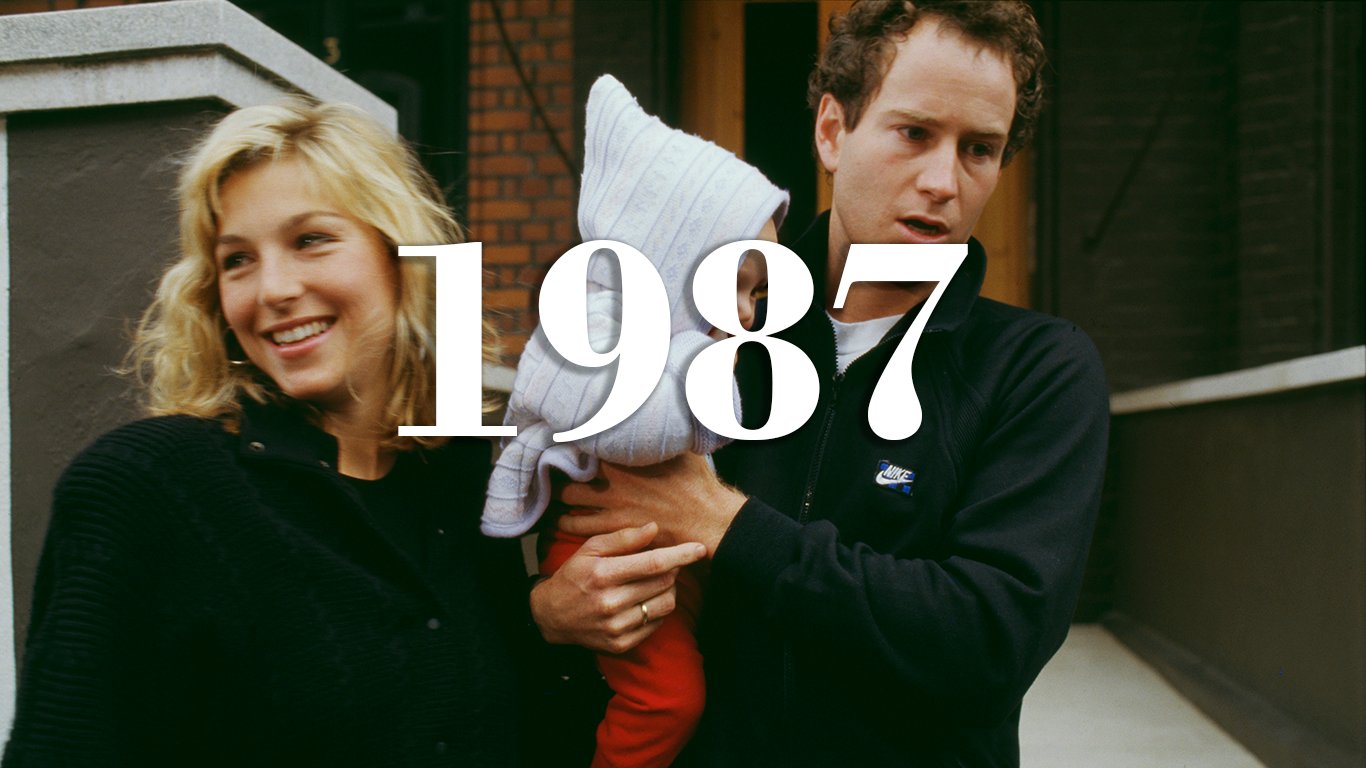
1986-1987
> Pct. 1 yr. and older who moved: 18.6% of pop. — 26th most in 66 years (43,693,000 total)
> Moved within same county: 11.6% of pop. (27,196,000 total)
> Moved to a new county in-state: 3.7% of pop. (8,762,000 total)
> Moved to a new state: 2.8% of pop. (6,593,000 total)
Source: Tony Duffy / Allsport / Getty Images
1987-1988
> Pct. 1 yr. and older who moved: 17.8% of pop. — 29th most in 66 years (42,174,000 total)
> Moved within same county: 11.0% of pop. (26,201,000 total)
> Moved to a new county in-state: 3.3% of pop. (7,727,000 total)
> Moved to a new state: 3.0% of pop. (7,046,000 total)

Source: Tom Kelley Archive / Getty Images
1988-1989
> Pct. 1 yr. and older who moved: 17.8% of pop. — 29th most in 66 years (42,620,000 total)
> Moved within same county: 10.9% of pop. (26,123,000 total)
> Moved to a new county in-state: 3.3% of pop. (7,949,000 total)
> Moved to a new state: 3.0% of pop. (7,081,000 total)
Source: GomezDavid / Getty Images
1989-1990
> Pct. 1 yr. and older who moved: 17.9% of pop. — 28th most in 66 years (43,381,000 total)
> Moved within same county: 10.6% of pop. (25,726,000 total)
> Moved to a new county in-state: 3.3% of pop. (8,061,000 total)
> Moved to a new state: 3.3% of pop. (8,033,000 total)
Source: Comstock / Getty Images
1990-1991
> Pct. 1 yr. and older who moved: 17.0% of pop. — 35th most in 66 years (41,539,000 total)
> Moved within same county: 10.3% of pop. (25,151,000 total)
> Moved to a new county in-state: 3.2% of pop. (7,881,000 total)
> Moved to a new state: 2.9% of pop. (7,122,000 total)
Source: Jupiterimages / Getty Images
1991-1992
> Pct. 1 yr. and older who moved: 17.3% of pop. — 32nd most in 66 years (42,800,000 total)
> Moved within same county: 10.7% of pop. (26,587,000 total)
> Moved to a new county in-state: 3.2% of pop. (7,853,000 total)
> Moved to a new state: 2.9% of pop. (7,105,000 total)
[in-text-ad-2]
Source: Comstock / Getty Images
1992-1993
> Pct. 1 yr. and older who moved: 17.0% of pop. — 35th most in 66 years (43,099,000 total)
> Moved within same county: 10.7% of pop. (26,932,000 total)
> Moved to a new county in-state: 3.1% of pop. (7,855,000 total)
> Moved to a new state: 2.7% of pop. (6,916,000 total)
Source: Comstock / Getty Images
1993-1994
> Pct. 1 yr. and older who moved: 16.7% of pop. — 38th most in 66 years (42,835,000 total)
> Moved within same county: 10.4% of pop. (26,638,000 total)
> Moved to a new county in-state: 3.2% of pop. (8,226,000 total)
> Moved to a new state: 2.6% of pop. (6,726,000 total)

Source: pitchal frederic / Getty Images
1994-1995
> Pct. 1 yr. and older who moved: 16.4% of pop. — 41st most in 66 years (42,317,000 total)
> Moved within same county: 10.8% of pop. (27,908,000 total)
> Moved to a new county in-state: 3.1% of pop. (7,888,000 total)
> Moved to a new state: 2.2% of pop. (5,743,000 total)

Source: Comstock / Getty Images
1995-1996
> Pct. 1 yr. and older who moved: 16.3% of pop. — 42nd most in 66 years (42,537,000 total)
> Moved within same county: 10.3% of pop. (26,696,000 total)
> Moved to a new county in-state: 3.1% of pop. (8,009,000 total)
> Moved to a new state: 2.5% of pop. (6,471,000 total)
[in-text-ad]
Source: LindaYolanda / Getty Images
1996-1997
> Pct. 1 yr. and older who moved: 16.5% of pop. — 40th most in 66 years (43,391,000 total)
> Moved within same county: 10.5% of pop. (27,740,000 total)
> Moved to a new county in-state: 3.0% of pop. (7,960,000 total)
> Moved to a new state: 2.4% of pop. (6,389,000 total)
Source: Shanina / Getty Images
1997-1998
> Pct. 1 yr. and older who moved: 16.0% of pop. — 44th most in 66 years (42,507,000 total)
> Moved within same county: 10.2% of pop. (27,082,000 total)
> Moved to a new county in-state: 3.0% of pop. (7,867,000 total)
> Moved to a new state: 2.4% of pop. (6,355,000 total)
Source: Harry How / Getty Images
1998-1999
> Pct. 1 yr. and older who moved: 15.9% of pop. — 45th most in 66 years (42,636,000 total)
> Moved within same county: 9.4% of pop. (25,268,000 total)
> Moved to a new county in-state: 3.1% of pop. (8,423,000 total)
> Moved to a new state: 2.8% of pop. (7,516,000 total)
Source: landonarnold / Getty Images
1999-2000
> Pct. 1 yr. and older who moved: 16.1% of pop. — 43rd most in 66 years (43,388,000 total)
> Moved within same county: 9.0% of pop. (24,399,000 total)
> Moved to a new county in-state: 3.3% of pop. (8,814,000 total)
> Moved to a new state: 3.1% of pop. (8,428,000 total)
Source: Westersoe / Getty Images
2000-2001
> Pct. 1 yr. and older who moved: 14.2% of pop. — 47th most in 66 years (39,007,000 total)
> Moved within same county: 8.0% of pop. (21,918,000 total)
> Moved to a new county in-state: 2.7% of pop. (7,550,000 total)
> Moved to a new state: 2.8% of pop. (7,783,000 total)
Source: cws_design / Getty Images
2001-2002
> Pct. 1 yr. and older who moved: 14.8% of pop. — 46th most in 66 years (41,111,000 total)
> Moved within same county: 8.5% of pop. (23,712,000 total)
> Moved to a new county in-state: 2.9% of pop. (8,066,000 total)
> Moved to a new state: 2.8% of pop. (7,770,000 total)
[in-text-ad-2]
Source: Amax Photo / Getty Images
2002-2003
> Pct. 1 yr. and older who moved: 14.2% of pop. — 47th most in 66 years (40,093,000 total)
> Moved within same county: 8.3% of pop. (23,468,000 total)
> Moved to a new county in-state: 2.7% of pop. (7,728,000 total)
> Moved to a new state: 2.7% of pop. (7,628,000 total)
Source: Wolfsburg1984 / Getty Images
2003-2004
> Pct. 1 yr. and older who moved: 13.7% of pop. — 50th most in 66 years (38,995,000 total)
> Moved within same county: 7.9% of pop. (22,551,000 total)
> Moved to a new county in-state: 2.8% of pop. (7,842,000 total)
> Moved to a new state: 2.6% of pop. (7,330,000 total)

Source: Altinosmanaj / Getty Images
2004-2005
> Pct. 1 yr. and older who moved: 13.9% of pop. — 49th most in 66 years (39,888,000 total)
> Moved within same county: 7.9% of pop. (22,736,000 total)
> Moved to a new county in-state: 2.7% of pop. (7,847,000 total)
> Moved to a new state: 2.6% of pop. (7,441,000 total)
Source: LSOphoto / Getty Images
2005-2006
> Pct. 1 yr. and older who moved: 13.7% of pop. — 50th most in 66 years (39,837,000 total)
> Moved within same county: 8.6% of pop. (24,851,000 total)
> Moved to a new county in-state: 2.8% of pop. (8,010,000 total)
> Moved to a new state: 2.0% of pop. (5,679,000 total)
[in-text-ad]

Source: lechatnoir / Getty Images
2006-2007
> Pct. 1 yr. and older who moved: 13.2% of pop. — 52nd most in 66 years (38,681,000 total)
> Moved within same county: 8.6% of pop. (25,192,000 total)
> Moved to a new county in-state: 2.5% of pop. (7,436,000 total)
> Moved to a new state: 1.7% of pop. (4,862,000 total)

Source: deucee_ / Getty Images
2007-2008
> Pct. 1 yr. and older who moved: 11.9% of pop. — 56th most in 66 years (35,167,000 total)
> Moved within same county: 7.8% of pop. (23,013,000 total)
> Moved to a new county in-state: 2.1% of pop. (6,282,000 total)
> Moved to a new state: 1.6% of pop. (4,728,000 total)
Source: JasonDoiy / Getty Images
2008-2009
> Pct. 1 yr. and older who moved: 12.5% of pop. — 53rd most in 66 years (37,105,000 total)
> Moved within same county: 8.4% of pop. (24,984,000 total)
> Moved to a new county in-state: 2.1% of pop. (6,374,000 total)
> Moved to a new state: 1.6% of pop. (4,660,000 total)
 24/7 Wall St.
Source: Brendan Hoffman / Getty Images
2009-2010
> Pct. 1 yr. and older who moved: 12.5% of pop. — 53rd most in 66 years (37,445,000 total)
> Moved within same county: 8.6% of pop. (25,910,000 total)
> Moved to a new county in-state: 2.1% of pop. (6,227,000 total)
> Moved to a new state: 1.4% of pop. (4,323,000 total)

Source: Koh Sze Kiat / Getty Images
2010-2011
> Pct. 1 yr. and older who moved: 11.6% of pop. — 58th most in 66 years (35,038,000 total)
> Moved within same county: 7.7% of pop. (23,330,000 total)
> Moved to a new county in-state: 1.9% of pop. (5,868,000 total)
> Moved to a new state: 1.6% of pop. (4,756,000 total)
Source: Mario Tama / Getty Images
2011-2012
> Pct. 1 yr. and older who moved: 12.0% of pop. — 55th most in 66 years (36,488,000 total)
> Moved within same county: 7.7% of pop. (23,493,000 total)
> Moved to a new county in-state: 2.2% of pop. (6,782,000 total)
> Moved to a new state: 1.7% of pop. (5,059,000 total)
[in-text-ad-2]

Source: Kemal Yildirim / Getty Images
2012-2013
> Pct. 1 yr. and older who moved: 11.7% of pop. — 57th most in 66 years (35,918,000 total)
> Moved within same county: 7.5% of pop. (23,150,000 total)
> Moved to a new county in-state: 2.3% of pop. (6,961,000 total)
> Moved to a new state: 1.6% of pop. (4,770,000 total)

Source: Andrew Burton / Getty Images
2013-2014
> Pct. 1 yr. and older who moved: 11.5% of pop. — 60th most in 66 years (35,681,000 total)
> Moved within same county: 7.6% of pop. (23,436,000 total)
> Moved to a new county in-state: 2.1% of pop. (6,446,000 total)
> Moved to a new state: 1.5% of pop. (4,666,000 total)

Source: Alex Brandon-Pool / Getty Images
2014-2015
> Pct. 1 yr. and older who moved: 11.6% of pop. — 58th most in 66 years (36,324,000 total)
> Moved within same county: 7.3% of pop. (22,905,000 total)
> Moved to a new county in-state: 2.1% of pop. (6,653,000 total)
> Moved to a new state: 1.6% of pop. (5,093,000 total)

Source: Jeff J Mitchell / Getty Images
2015-2016
> Pct. 1 yr. and older who moved: 11.2% of pop. — 61st most in 66 years (35,138,000 total)
> Moved within same county: 6.9% of pop. (21,588,000 total)
> Moved to a new county in-state: 2.4% of pop. (7,501,000 total)
> Moved to a new state: 1.5% of pop. (4,768,000 total)
[in-text-ad]

Source: Igor Alecsander / Getty Images
2016-2017
> Pct. 1 yr. and older who moved: 11.0% of pop. — 62nd most in 66 years (34,902,000 total)
> Moved within same county: 6.8% of pop. (21,614,000 total)
> Moved to a new county in-state: 2.1% of pop. (6,668,000 total)
> Moved to a new state: 1.7% of pop. (5,366,000 total)

Source: Anchiy / Getty Images
2017-2018
> Pct. 1 yr. and older who moved: 10.1% of pop. — 63rd most in 66 years (32,352,000 total)
> Moved within same county: 6.2% of pop. (19,852,000 total)
> Moved to a new county in-state: 2.0% of pop. (6,496,000 total)
> Moved to a new state: 1.5% of pop. (4,838,000 total)

Source: PIKSEL / Getty Images
2018-2019
> Pct. 1 yr. and older who moved: 9.8% of pop. — 64th most in 66 years (31,371,000 total)
> Moved within same county: 5.9% of pop. (18,833,000 total)
> Moved to a new county in-state: 2.1% of pop. (6,663,000 total)
> Moved to a new state: 1.5% of pop. (4,738,000 total)
[in-text-ad-2]

Source: Geber86 / Getty Images
2019-2020
> Pct. 1 yr. and older who moved: 9.3% of pop. — 65th most in 66 years (29,780,000 total)
> Moved within same county: 5.4% of pop. (17,522,000 total)
> Moved to a new county in-state: 2.2% of pop. (7,059,000 total)
> Moved to a new state: 1.3% of pop. (4,233,000 total)
Source: Fly View Productions / Getty Images
2020-2021
> Pct. 1 yr. and older who moved: 8.4% of pop. — 66th most in 66 years (27,059,000 total)
> Moved within same county: 4.9% of pop. (15,805,000 total)
> Moved to a new county in-state: 1.9% of pop. (6,270,000 total)
> Moved to a new state: 1.4% of pop. (4,374,000 total)
Take This Retirement Quiz To Get Matched With An Advisor Now (Sponsored)
Are you ready for retirement? Planning for retirement can be overwhelming, that’s why it could be a good idea to speak to a fiduciary financial advisor about your goals today.
Start by taking this retirement quiz right here from SmartAsset that will match you with up to 3 financial advisors that serve your area and beyond in 5 minutes. Smart Asset is now matching over 50,000 people a month.
Click here now to get started.
Thank you for reading! Have some feedback for us?
Contact the 24/7 Wall St. editorial team.
Editors' Picks