
The U.S. has reported more than 48.7 million confirmed COVID-19 cases as of December 7. More than 782,000 Americans have died of COVID-19 — the highest death toll of any country.
The virus has spread throughout the country in a way that has been difficult to predict, surging in one region, then showing signs of improvement, and then reappearing in other regions. Though local outbreaks may ebb and flow, the current surge in cases has been felt nearly nationwide, leading to new travel restrictions and business closures around the country.
Nationwide, there were an average of 31.5 daily new coronavirus cases per 100,000 Americans in the week ending December 7. Cumulatively, the U.S. has reported 14,863.1 cases per 100,000 Americans, and 238.2 deaths per 100,000 Americans.
The coronavirus has spread to different parts of the country in different stages throughout the pandemic. In the spring, the worst hit states were in the Northeast, as New York City became the epicenter of the nation’s crisis. The virus spread to states throughout the Sun Belt in the summer, and hit states in the Midwest and West during the fall. Now, nearly every state is categorized as a COVID-19 hotspot, according to definitions based on new cases per capita from the nonprofit health organization Kaiser Family Foundation.
While the nation’s largest metropolitan areas were hit hardest in the early months of the pandemic, nearly every city has suffered from the virus. Outbreaks are particularly likely to occur in places where large numbers of people tend to congregate, leaving cities with high concentrations of colleges, correctional facilities, and nursing homes particularly at risk.
To determine the metropolitan area in each state with the highest number of COVID-19 cases per capita, 24/7 Wall St. compiled and reviewed data from state and local health departments. We ranked metropolitan areas according to the number of confirmed COVID-19 cases per 100,000 residents as of December 7. Data was aggregated from the county level to the metropolitan area level using boundary definitions from the U.S. Census Bureau. Population data used to adjust case and death totals came from the U.S. Census Bureau’s 2019 American Community Survey and are five-year estimates.
Source: jjneff / Getty Images
Alabama: Anniston-Oxford
COVID-19 cases as of December 7 in Anniston: 22,632 (19,745.6 per 100,000)
COVID-19 cases as of December 7 in Alabama: 848,781 (17,310.8 per 100,000)
Peak pandemic unemployment in Anniston: 18.7% (April 2020)
Anniston population: 114,618 (189.2 per sq. mi.)

Source: Chilkoot / Getty Images
Alaska: Anchorage
COVID-19 cases as of December 7 in Anchorage: 86,117 (21,588.6 per 100,000)
COVID-19 cases as of December 7 in Alaska: 146,558 (20,034.0 per 100,000)
Peak pandemic unemployment in Anchorage: 14.8% (April 2020)
Anchorage population: 398,900 (15.2 per sq. mi.)
These are all the counties in Alaska where COVID-19 is slowing (and where it’s still getting worse).
Source: ianmcdonnell / Getty Images
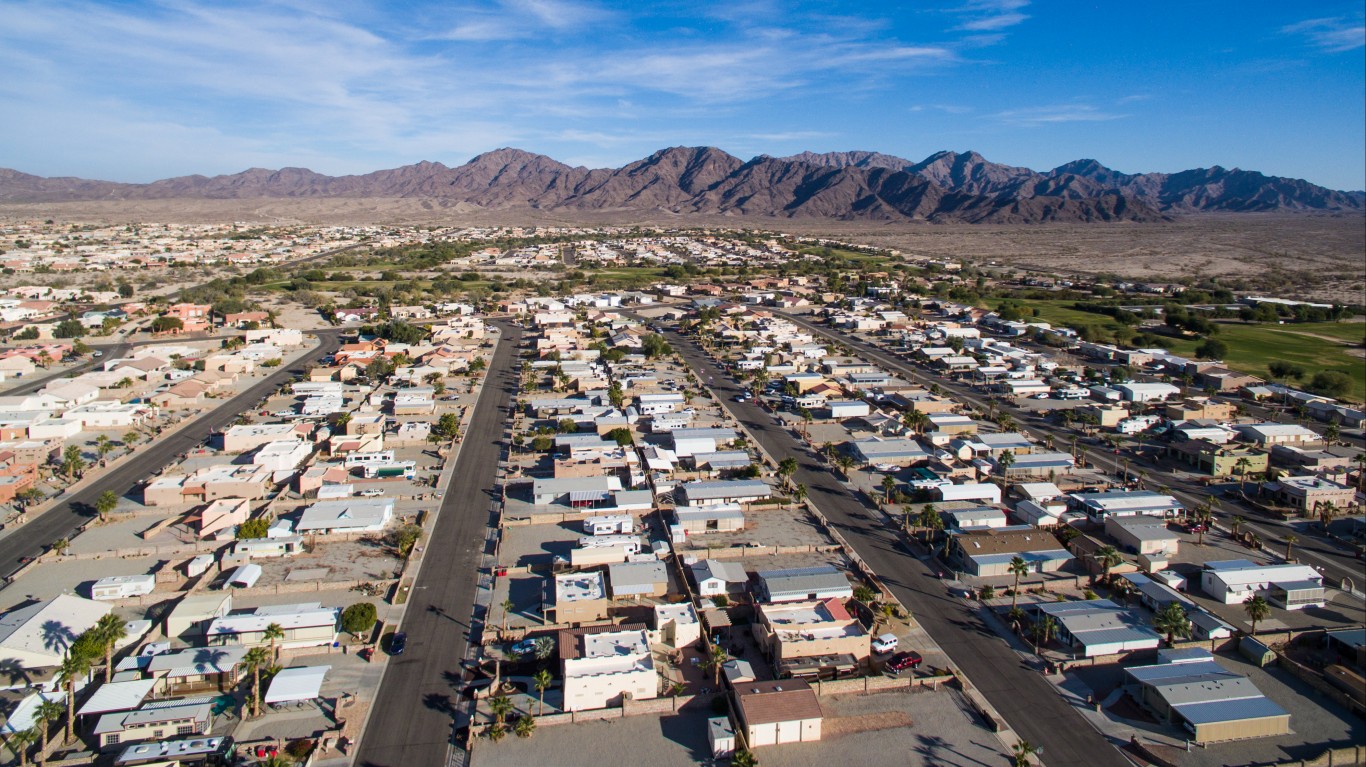
Arizona: Yuma
COVID-19 cases as of December 7 in Yuma: 43,033 (20,543.9 per 100,000)
COVID-19 cases as of December 7 in Arizona: 1,292,054 (17,751.1 per 100,000)
Peak pandemic unemployment in Yuma: 25.0% (April 2020)
Yuma population: 209,468 (38.0 per sq. mi.)

Source: BOB WESTON / iStock via Getty Images
Arkansas: Jonesboro
COVID-19 cases as of December 7 in Jonesboro: 27,617 (21,043.0 per 100,000)
COVID-19 cases as of December 7 in Arkansas: 533,356 (17,673.6 per 100,000)
Peak pandemic unemployment in Jonesboro: 9.3% (April 2020)
Jonesboro population: 131,241 (89.5 per sq. mi.)

Source: David Crockett Photo / Getty Images
California: Hanford-Corcoran
COVID-19 cases as of December 7 in Hanford: 35,370 (23,471.9 per 100,000)
COVID-19 cases as of December 7 in California: 5,084,927 (12,869.3 per 100,000)
Peak pandemic unemployment in Hanford: 16.6% (April 2020)
Hanford population: 150,691 (108.5 per sq. mi.)
Source: Adventure_Photo / Getty Images
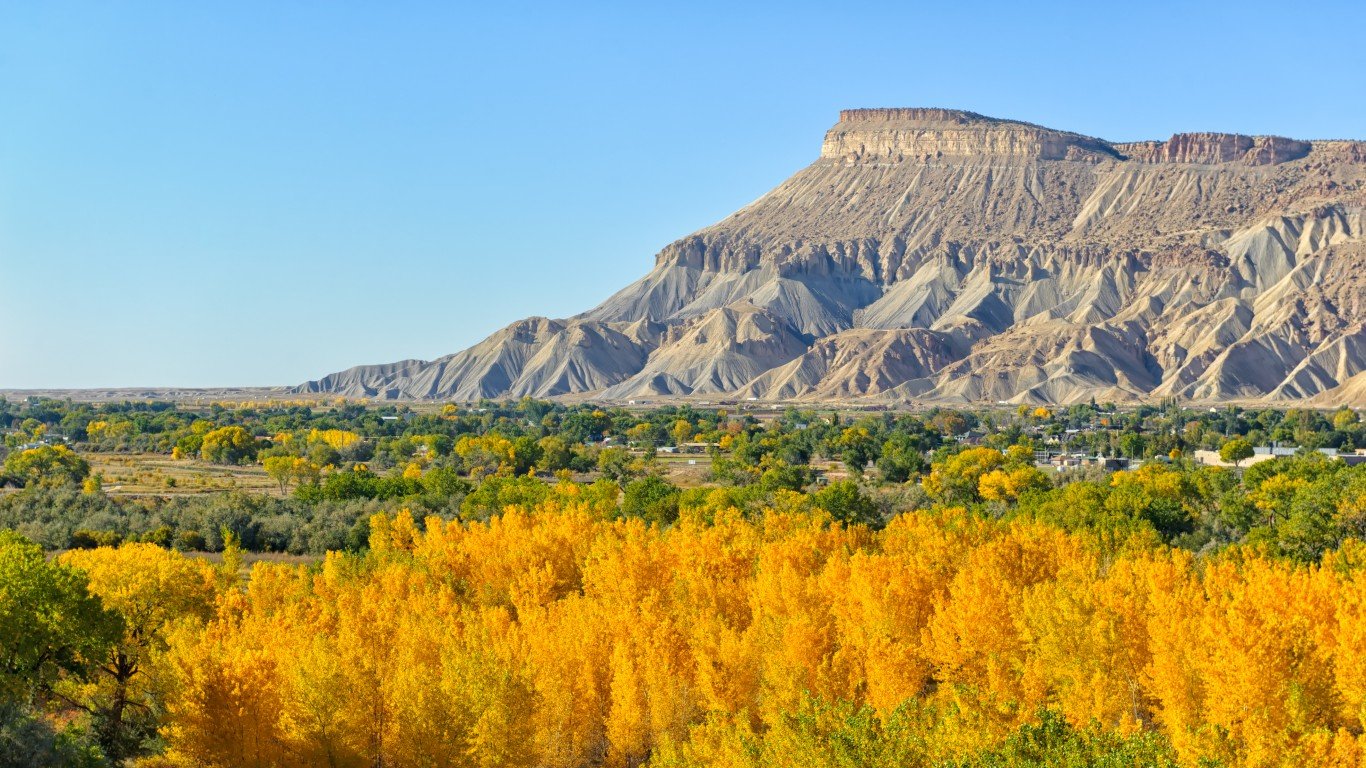
Colorado: Grand Junction
COVID-19 cases as of December 7 in Grand Junction: 28,240 (18,675.0 per 100,000)
COVID-19 cases as of December 7 in Colorado: 838,587 (14,562.0 per 100,000)
Peak pandemic unemployment in Grand Junction: 12.5% (April 2020)
Grand Junction population: 151,218 (45.4 per sq. mi.)
Source: pabradyphoto / iStock via Getty Images
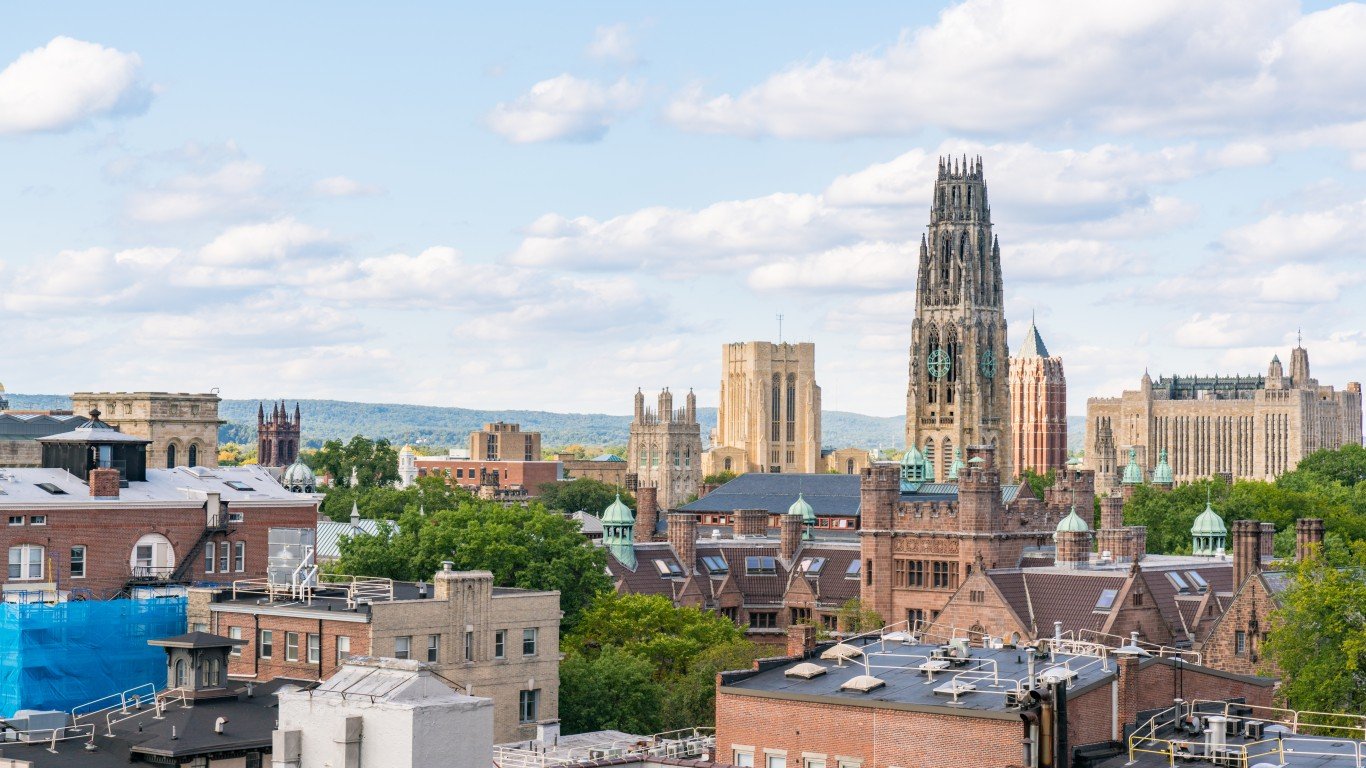
Connecticut: New Haven-Milford
COVID-19 cases as of December 7 in New Haven: 110,848 (12,926.7 per 100,000)
COVID-19 cases as of December 7 in Connecticut: 425,275 (11,928.2 per 100,000)
Peak pandemic unemployment in New Haven: 9.5% (July 2020)
New Haven population: 857,513 (1,418.5 per sq. mi.)

Source: aimintang / Getty Images
Delaware: Dover
COVID-19 cases as of December 7 in Dover: 28,916 (16,364.6 per 100,000)
COVID-19 cases as of December 7 in Delaware: 156,454 (16,066.9 per 100,000)
Peak pandemic unemployment in Dover: 17.3% (May 2020)
Dover population: 176,699 (301.4 per sq. mi.)

Source: Art Wager / E+ via Getty Images
Florida: Miami-Fort Lauderdale-Pompano Beach
COVID-19 cases as of December 7 in Miami: 1,283,697 (21,076.5 per 100,000)
COVID-19 cases as of December 7 in Florida: 3,702,338 (17,238.0 per 100,000)
Peak pandemic unemployment in Miami: 13.8% (April 2020)
Miami population: 6,090,660 (1,199.6 per sq. mi.)

Source: BOB WESTON / Getty Images
Georgia: Dalton
COVID-19 cases as of December 7 in Dalton: 30,772 (21,375.2 per 100,000)
COVID-19 cases as of December 7 in Georgia: 1,668,875 (15,718.3 per 100,000)
Peak pandemic unemployment in Dalton: 20.3% (April 2020)
Dalton population: 143,961 (226.7 per sq. mi.)

Source: 7Michael / iStock via Getty Images
Hawaii: Kahului-Wailuku-Lahaina
COVID-19 cases as of December 7 in Kahului: 10,468 (6,306.8 per 100,000)
COVID-19 cases as of December 7 in Hawaii: 85,330 (6,026.7 per 100,000)
Peak pandemic unemployment in Kahului: 34.8% (April 2020)
Kahului population: 165,979 (142.9 per sq. mi.)
These are all the counties in Hawaii where COVID-19 is slowing (and where it’s still getting worse).

Source: csfotoimages / Getty Images
Idaho: Coeur d’Alene
COVID-19 cases as of December 7 in Coeur d’Alene: 31,094 (19,764.6 per 100,000)
COVID-19 cases as of December 7 in Idaho: 308,869 (17,283.6 per 100,000)
Peak pandemic unemployment in Coeur d’Alene: 17.2% (April 2020)
Coeur d’Alene population: 157,322 (126.5 per sq. mi.)
These are all the counties in Idaho where COVID-19 is slowing (and where it’s still getting worse).

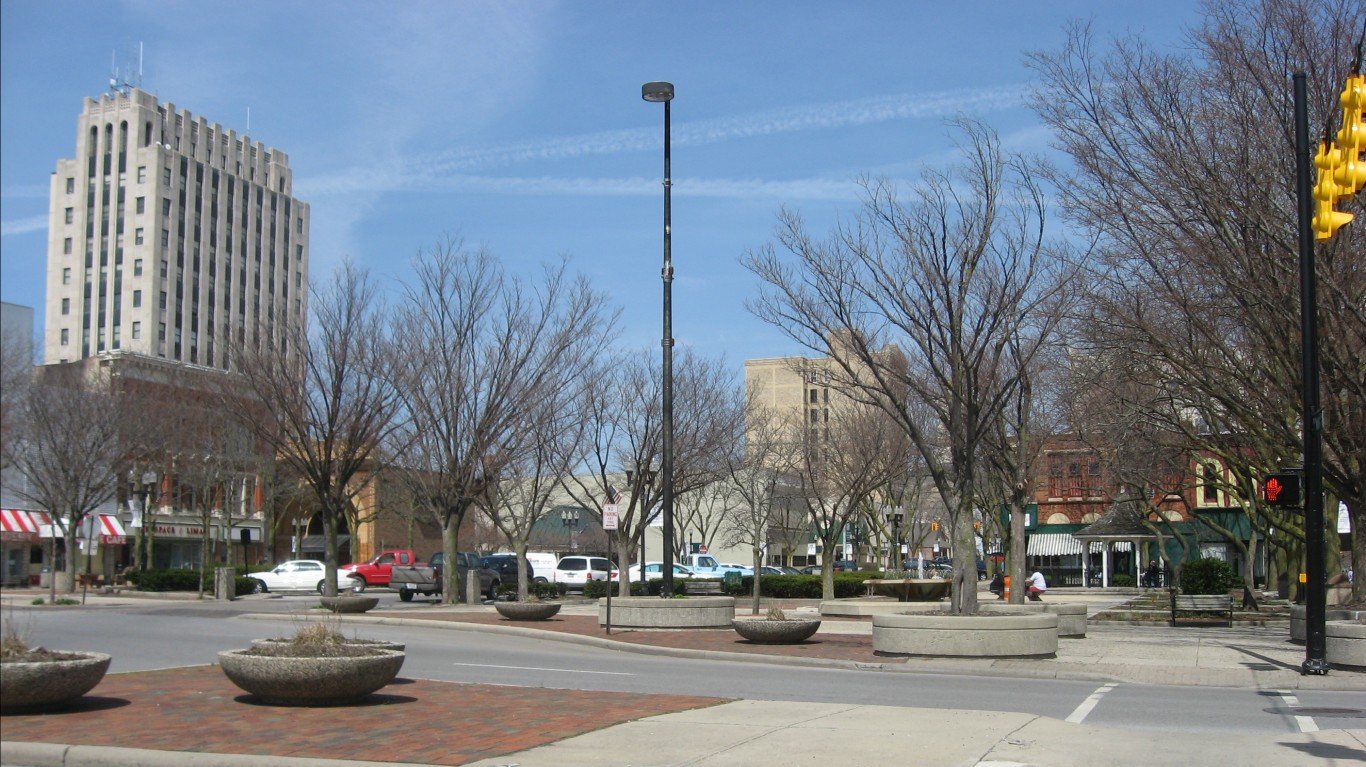
Illinois: Danville
COVID-19 cases as of December 7 in Danville: 16,638 (21,451.0 per 100,000)
COVID-19 cases as of December 7 in Illinois: 1,835,076 (14,481.5 per 100,000)
Peak pandemic unemployment in Danville: 18.4% (April 2020)
Danville population: 77,563 (86.3 per sq. mi.)

Source: Public Domain / Wikimedia Commons
Indiana: Kokomo
COVID-19 cases as of December 7 in Kokomo: 16,770 (20,369.0 per 100,000)
COVID-19 cases as of December 7 in Indiana: 1,118,335 (16,611.7 per 100,000)
Peak pandemic unemployment in Kokomo: 33.8% (April 2020)
Kokomo population: 82,331 (280.9 per sq. mi.)

Source: DenisTangneyJr / iStock via Getty Images
Iowa: Sioux City, IA-NE-SD
COVID-19 cases as of December 7 in Sioux City: 29,486 (20,498.3 per 100,000)
COVID-19 cases as of December 7 in Iowa: 534,623 (16,944.9 per 100,000)
Peak pandemic unemployment in Sioux City: 9.8% (April 2020)
Sioux City population: 143,846 (69.4 per sq. mi.)
These are all the counties in Iowa where COVID-19 is slowing (and where it’s still getting worse).

Source: Sean Pavone / Getty Images
Kansas: Wichita
COVID-19 cases as of December 7 in Wichita: 109,312 (17,141.9 per 100,000)
COVID-19 cases as of December 7 in Kansas: 474,479 (16,286.6 per 100,000)
Peak pandemic unemployment in Wichita: 18.2% (April 2020)
Wichita population: 637,690 (153.7 per sq. mi.)
These are all the counties in Kansas where COVID-19 is slowing (and where it’s still getting worse).
Source: Jacqueline Nix / Getty Images
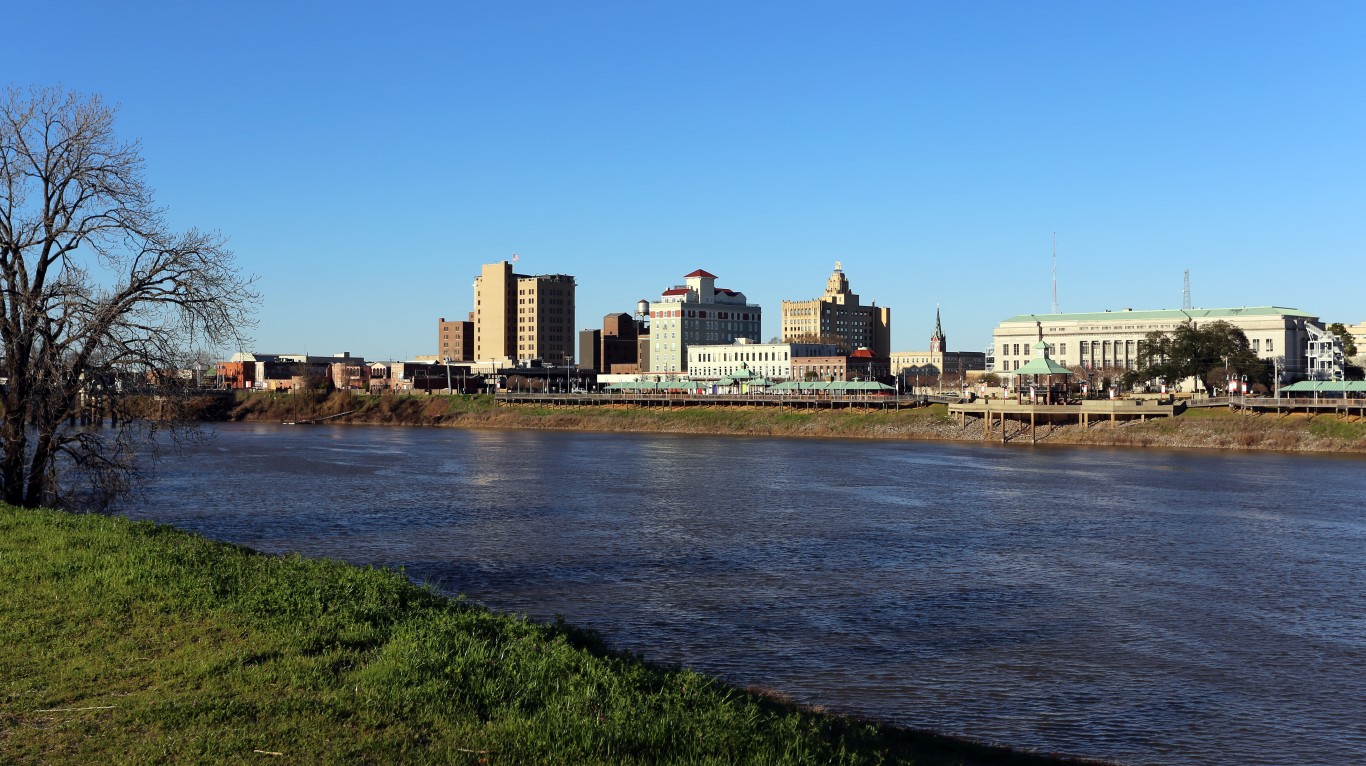
Kentucky: Bowling Green
COVID-19 cases as of December 7 in Bowling Green: 35,428 (20,302.8 per 100,000)
COVID-19 cases as of December 7 in Kentucky: 794,816 (17,790.4 per 100,000)
Peak pandemic unemployment in Bowling Green: 18.8% (April 2020)
Bowling Green population: 174,498 (108.1 per sq. mi.)
Source: wellesenterprises / Getty Images
Louisiana: Monroe
COVID-19 cases as of December 7 in Monroe: 41,057 (20,179.7 per 100,000)
COVID-19 cases as of December 7 in Louisiana: 772,789 (16,623.4 per 100,000)
Peak pandemic unemployment in Monroe: 12.8% (April 2020)
Monroe population: 203,457 (89.1 per sq. mi.)
Source: DenisTangneyJr / Getty Images
Maine: Lewiston-Auburn
COVID-19 cases as of December 7 in Lewiston: 13,318 (12,377.1 per 100,000)
COVID-19 cases as of December 7 in Maine: 123,118 (9,159.1 per 100,000)
Peak pandemic unemployment in Lewiston: 10.3% (July 2020)
Lewiston population: 107,602 (230.0 per sq. mi.)
These are all the counties in Maine where COVID-19 is slowing (and where it’s still getting worse).
Source: John M. Chase / Getty Images
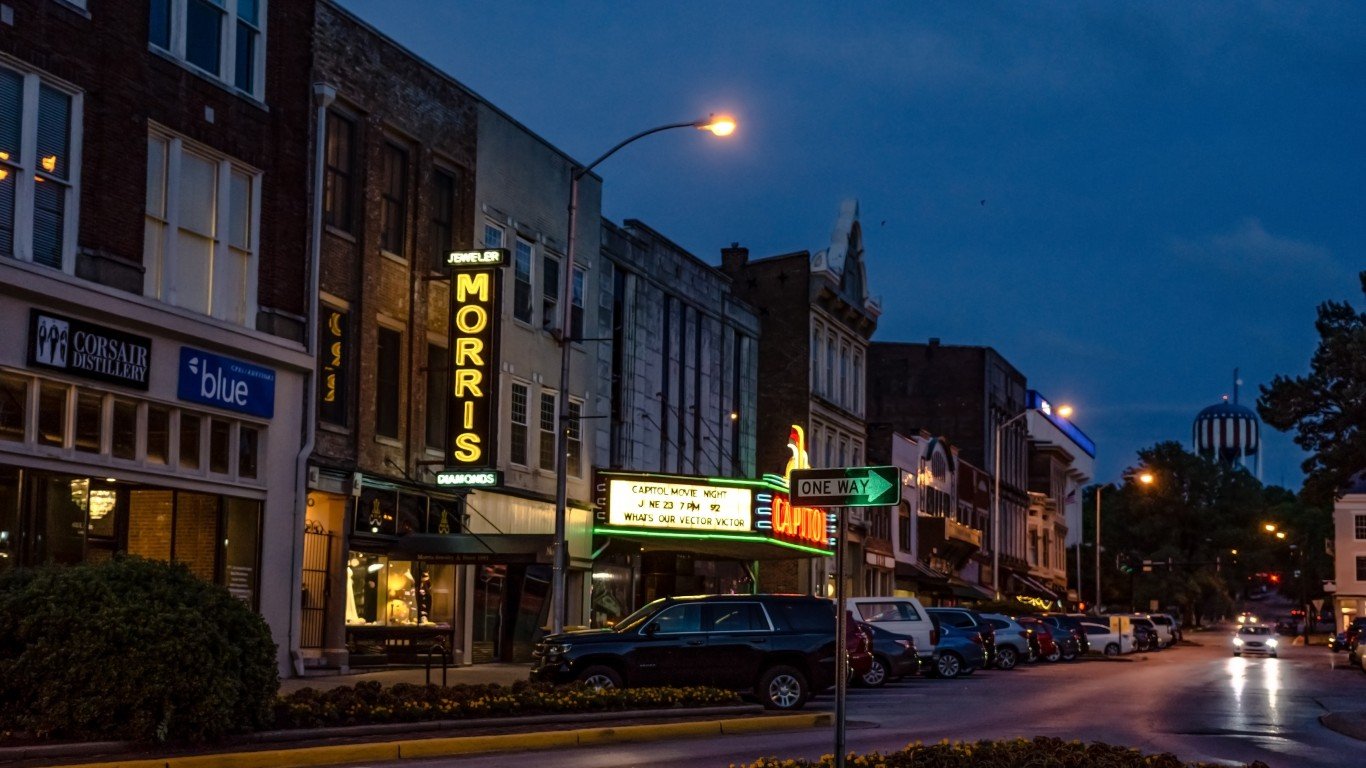
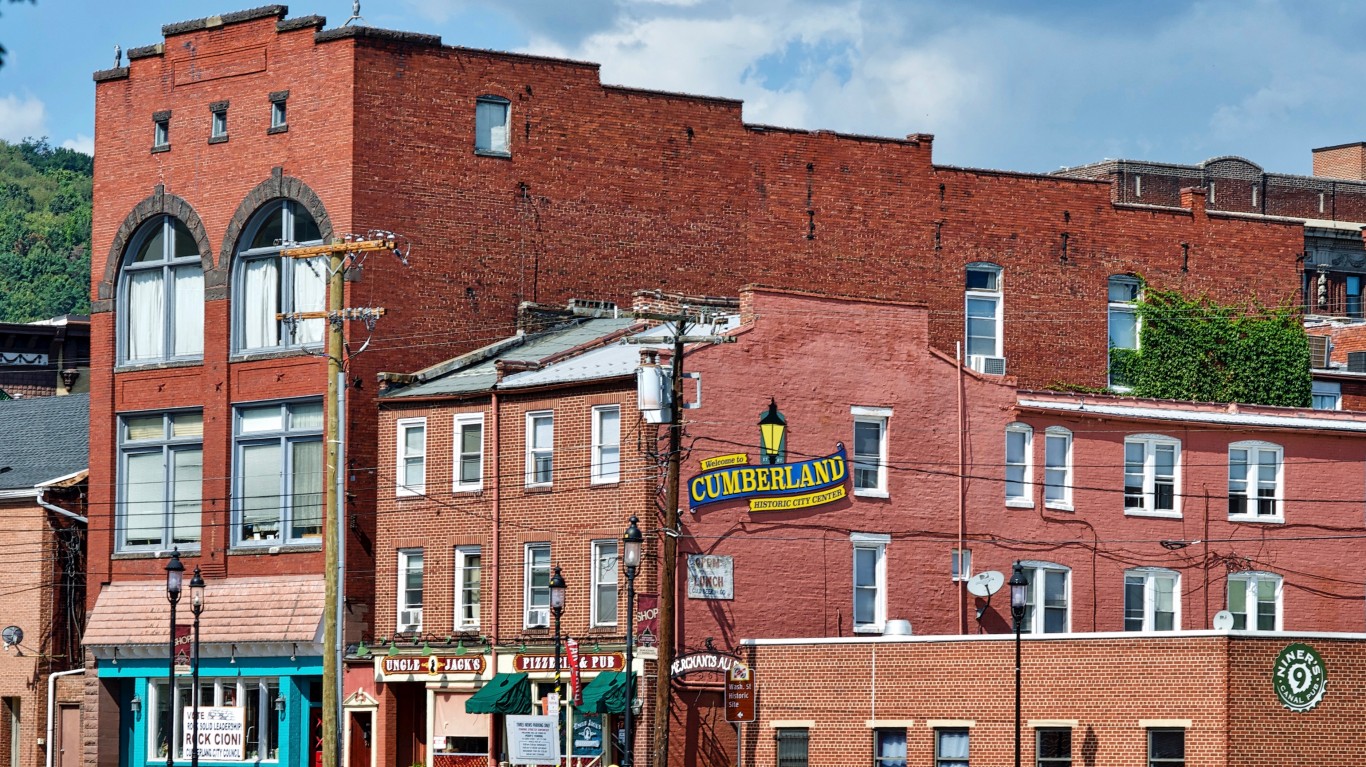
Maryland: Cumberland, MD-WV
COVID-19 cases as of December 7 in Cumberland: 15,770 (15,992.0 per 100,000)
COVID-19 cases as of December 7 in Maryland: 592,679 (9,803.3 per 100,000)
Peak pandemic unemployment in Cumberland: 14.0% (April 2020)
Cumberland population: 98,612 (131.1 per sq. mi.)

Source: SeanPavonePhoto / iStock via Getty Images
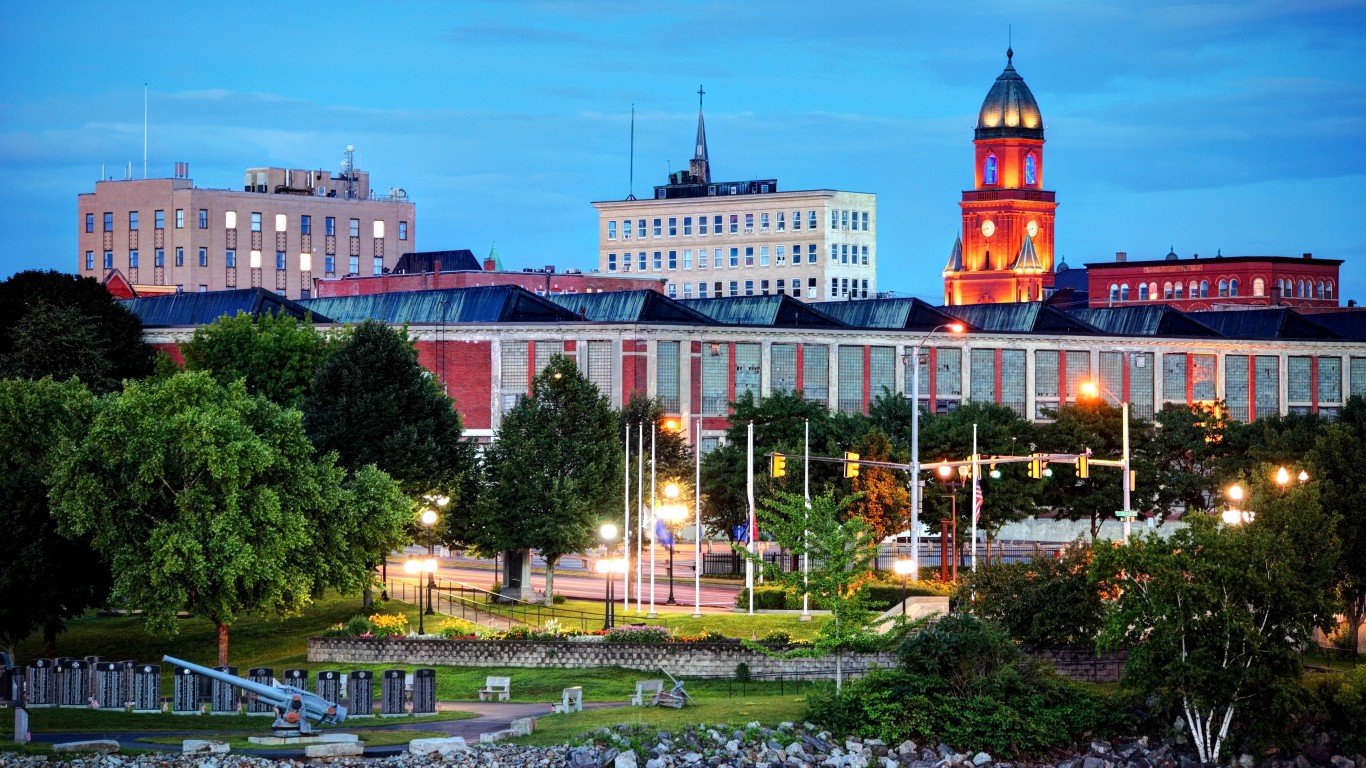
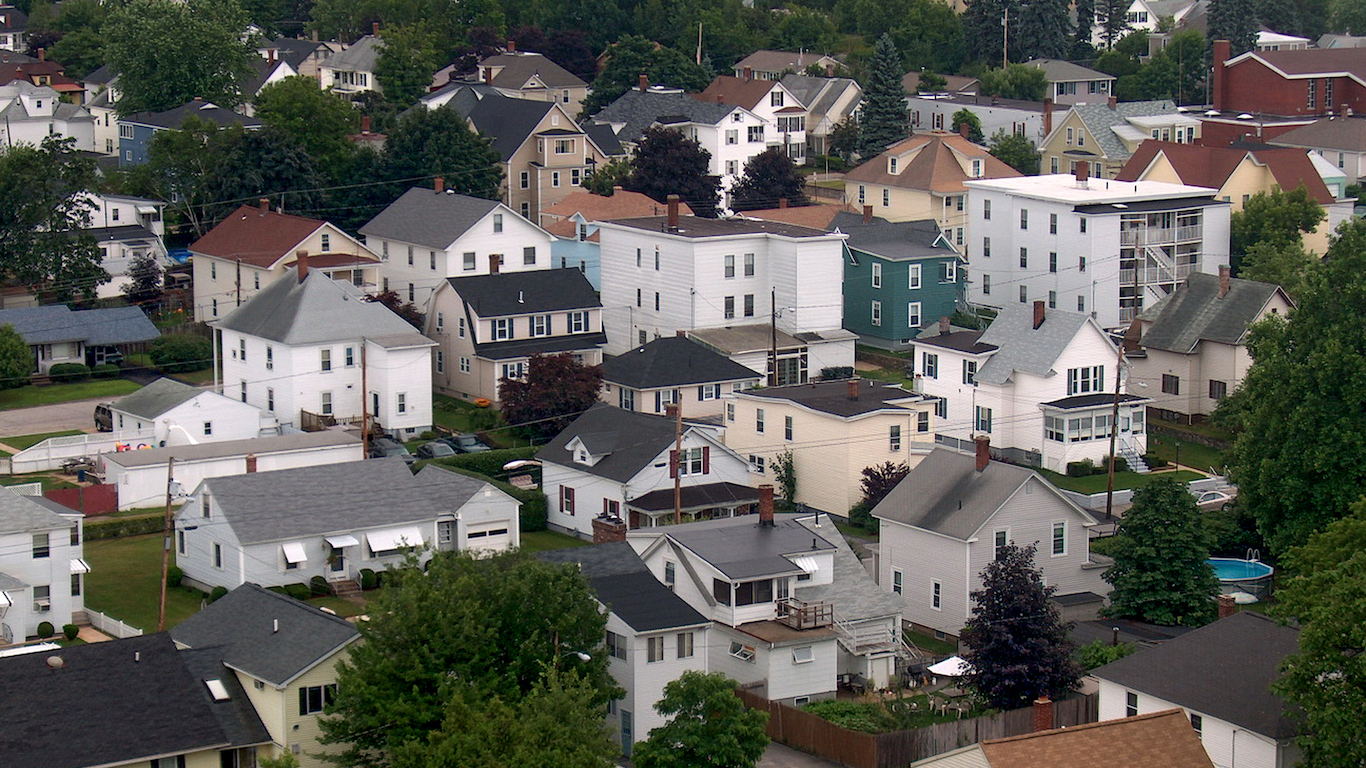
Massachusetts: Worcester, MA-CT
COVID-19 cases as of December 7 in Worcester: 121,806 (12,939.7 per 100,000)
COVID-19 cases as of December 7 in Massachusetts: 935,844 (13,577.7 per 100,000)
Peak pandemic unemployment in Worcester: 15.9% (June 2020)
Worcester population: 941,338 (465.2 per sq. mi.)

Source: Sean Pavone / iStock via Getty Images
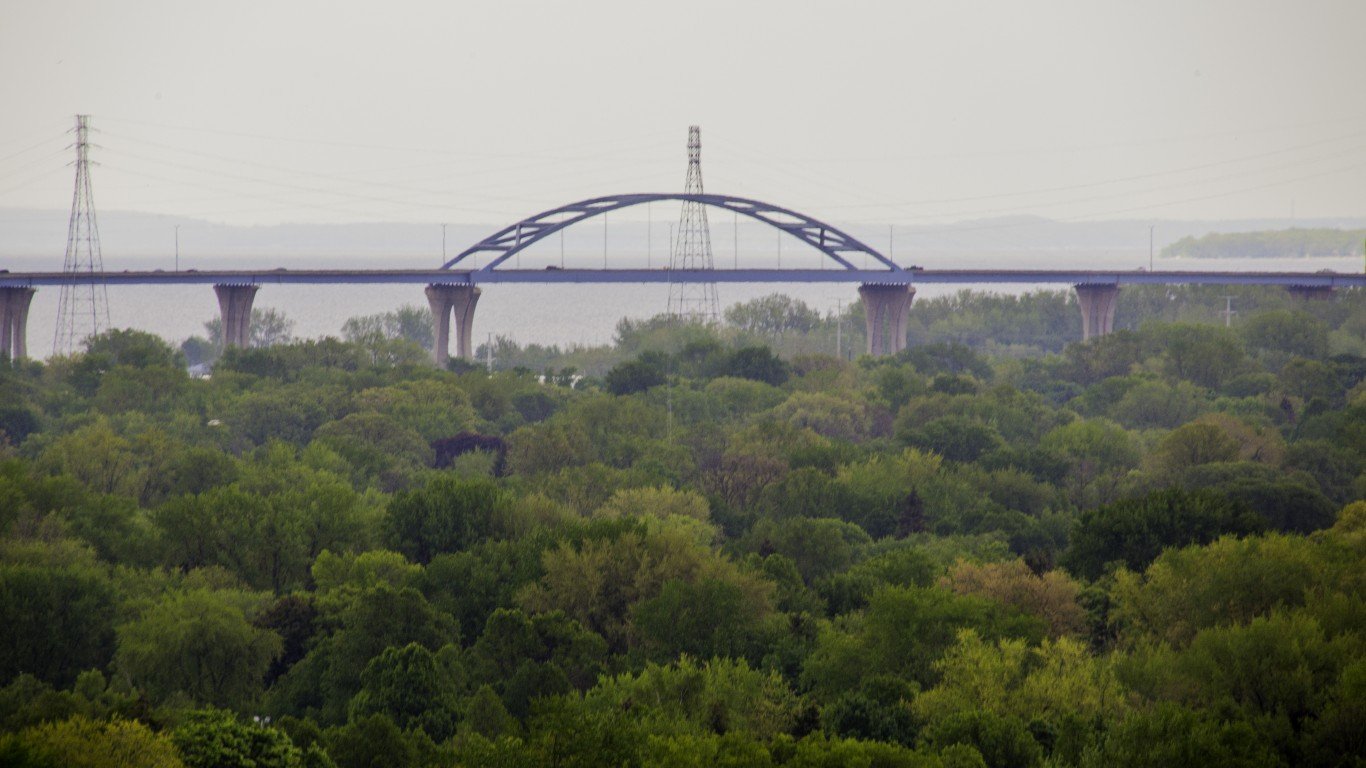
Michigan: Grand Rapids-Kentwood
COVID-19 cases as of December 7 in Grand Rapids: 184,784 (17,393.2 per 100,000)
COVID-19 cases as of December 7 in Michigan: 1,517,325 (15,193.2 per 100,000)
Peak pandemic unemployment in Grand Rapids: 22.3% (April 2020)
Grand Rapids population: 1,062,392 (395.4 per sq. mi.)

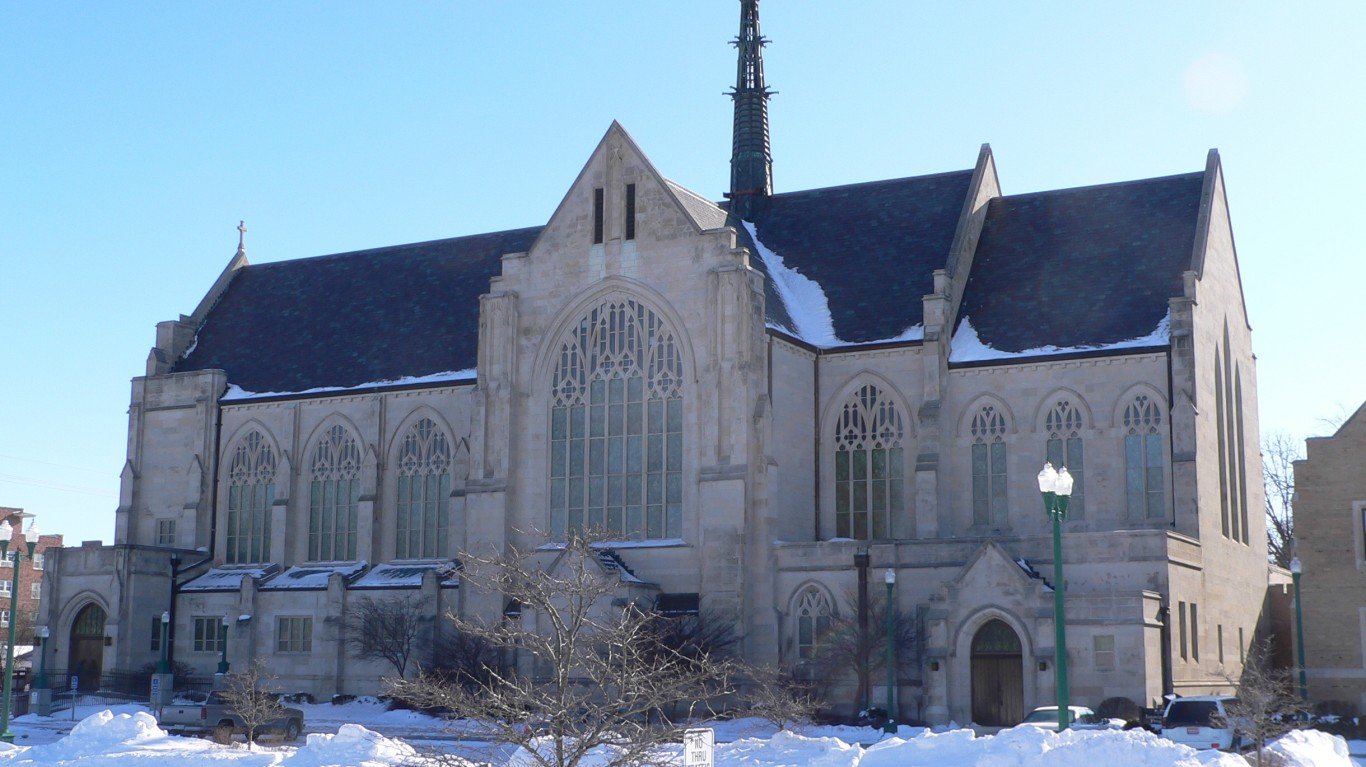
Minnesota: St. Cloud
COVID-19 cases as of December 7 in St. Cloud: 43,195 (21,751.8 per 100,000)
COVID-19 cases as of December 7 in Minnesota: 926,931 (16,436.0 per 100,000)
Peak pandemic unemployment in St. Cloud: 9.4% (May 2020)
St. Cloud population: 198,581 (113.4 per sq. mi.)
Source: DenisTangneyJr / Getty Images
Mississippi: Hattiesburg
COVID-19 cases as of December 7 in Hattiesburg: 31,020 (18,444.9 per 100,000)
COVID-19 cases as of December 7 in Mississippi: 515,504 (17,321.2 per 100,000)
Peak pandemic unemployment in Hattiesburg: 13.3% (April 2020)
Hattiesburg population: 168,177 (83.1 per sq. mi.)
Source: gnagel / Getty Images
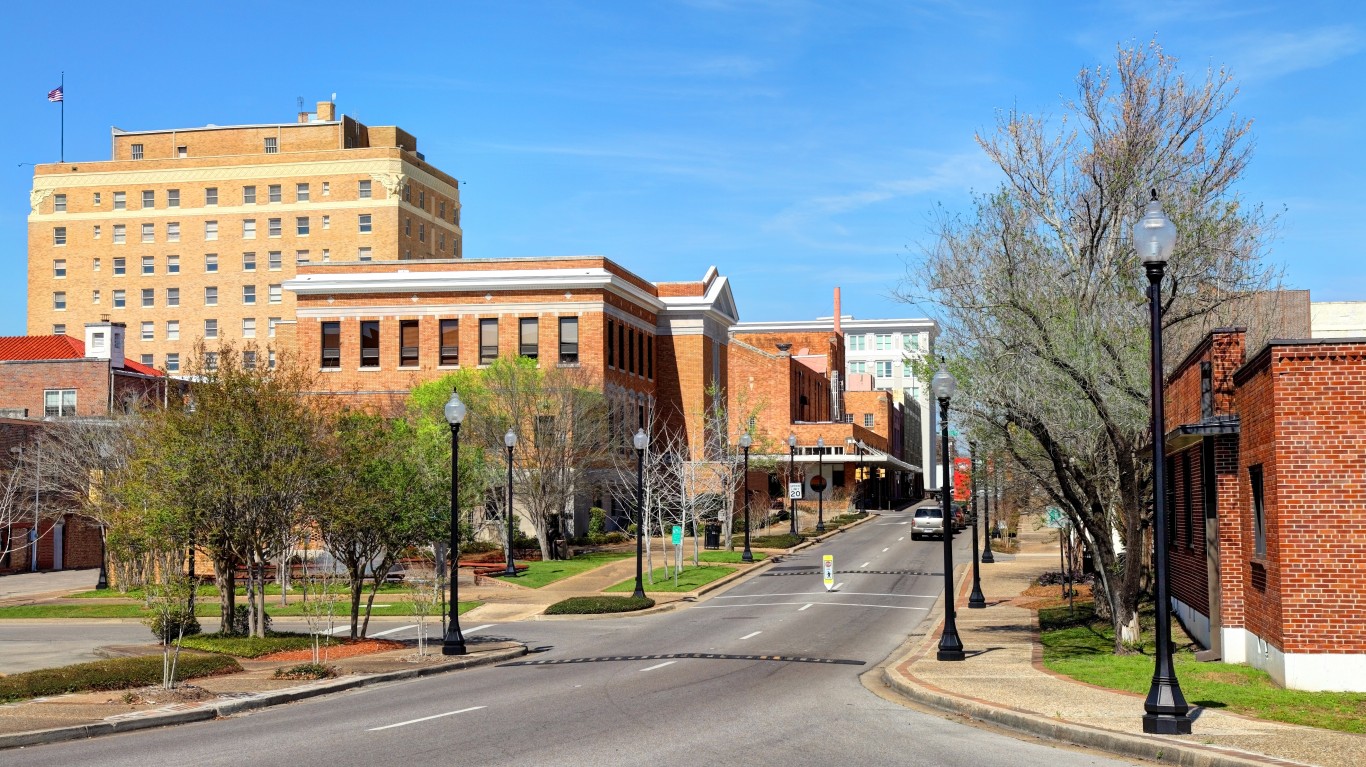
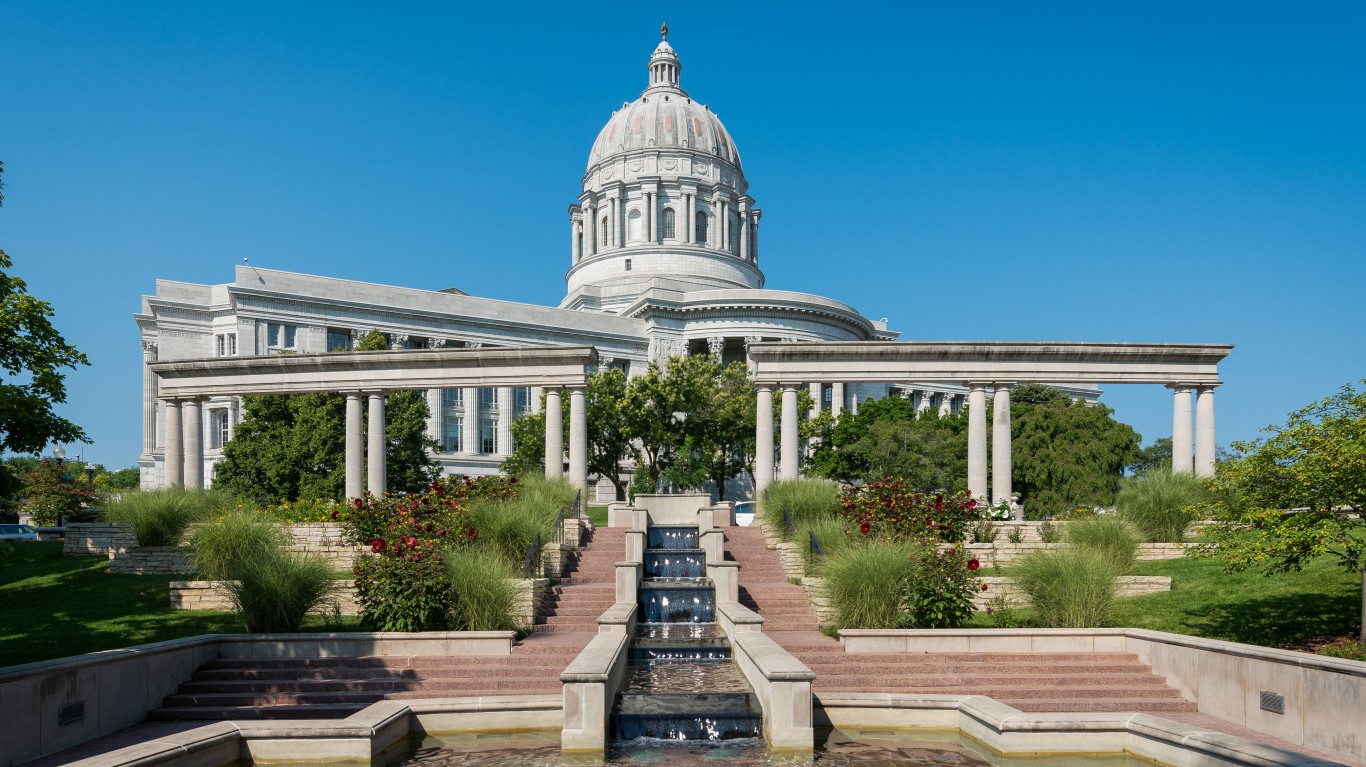
Missouri: Jefferson City
COVID-19 cases as of December 7 in Jefferson City: 27,260 (18,020.4 per 100,000)
COVID-19 cases as of December 7 in Missouri: 922,489 (15,030.5 per 100,000)
Peak pandemic unemployment in Jefferson City: 7.1% (April 2020)
Jefferson City population: 151,273 (67.3 per sq. mi.)

Source: leezsnow / Getty Images
Montana: Great Falls
COVID-19 cases as of December 7 in Great Falls: 16,791 (20,570.9 per 100,000)
COVID-19 cases as of December 7 in Montana: 192,236 (17,986.5 per 100,000)
Peak pandemic unemployment in Great Falls: 12.6% (April 2020)
Great Falls population: 81,625 (30.3 per sq. mi.)
Source: Public Domain / Wikimedia Commons
Nebraska: Grand Island
COVID-19 cases as of December 7 in Grand Island: 12,939 (17,142.3 per 100,000)
COVID-19 cases as of December 7 in Nebraska: 313,935 (16,229.0 per 100,000)
Peak pandemic unemployment in Grand Island: 11.4% (April 2020)
Grand Island population: 75,480 (47.2 per sq. mi.)

Source: DenisTangneyJr / Getty Images
Nevada: Carson City
COVID-19 cases as of December 7 in Carson City: 9,377 (17,119.7 per 100,000)
COVID-19 cases as of December 7 in Nevada: 473,150 (15,361.2 per 100,000)
Peak pandemic unemployment in Carson City: 21.0% (April 2020)
Carson City population: 54,773 (378.6 per sq. mi.)
These are all the counties in Nevada where COVID-19 is slowing (and where it’s still getting worse).
Source: stockphoto52 / iStock
New Hampshire: Manchester-Nashua
COVID-19 cases as of December 7 in Manchester: 55,547 (13,448.5 per 100,000)
COVID-19 cases as of December 7 in New Hampshire: 165,574 (12,177.1 per 100,000)
Peak pandemic unemployment in Manchester: 17.5% (April 2020)
Manchester population: 413,035 (471.4 per sq. mi.)

Source: AUDREY SCRIPP / iStock via Getty Images
New Jersey: Atlantic City-Hammonton
COVID-19 cases as of December 7 in Atlantic City: 41,938 (15,759.9 per 100,000)
COVID-19 cases as of December 7 in New Jersey: 1,272,728 (14,329.0 per 100,000)
Peak pandemic unemployment in Atlantic City: 35.2% (June 2020)
Atlantic City population: 266,105 (478.9 per sq. mi.)
Source: KaraGrubis / iStock via Getty Images
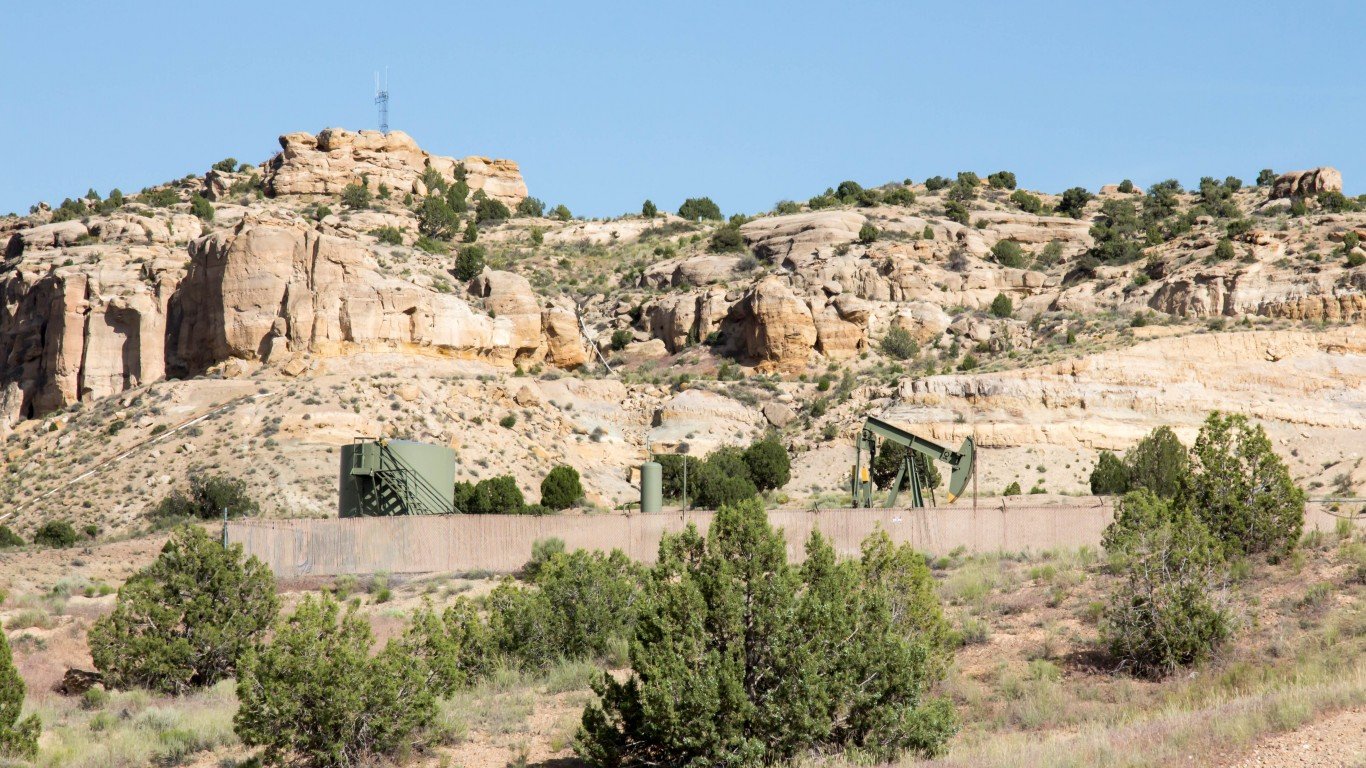
New Mexico: Farmington
COVID-19 cases as of December 7 in Farmington: 26,990 (21,333.4 per 100,000)
COVID-19 cases as of December 7 in New Mexico: 320,520 (15,285.9 per 100,000)
Peak pandemic unemployment in Farmington: 14.5% (July 2020)
Farmington population: 126,515 (22.9 per sq. mi.)
Source: DenisTangneyJr / Getty Images
New York: Elmira
COVID-19 cases as of December 7 in Elmira: 13,290 (15,654.6 per 100,000)
COVID-19 cases as of December 7 in New York: 2,783,423 (14,308.0 per 100,000)
Peak pandemic unemployment in Elmira: 16.4% (April 2020)
Elmira population: 84,895 (208.4 per sq. mi.)
Source: Jeff Yount / iStock via Getty Images
North Carolina: Hickory-Lenoir-Morganton
COVID-19 cases as of December 7 in Hickory: 66,663 (18,180.3 per 100,000)
COVID-19 cases as of December 7 in North Carolina: 1,544,544 (14,726.7 per 100,000)
Peak pandemic unemployment in Hickory: 18.2% (April 2020)
Hickory population: 366,678 (223.9 per sq. mi.)
Source: powerofforever / Getty Images
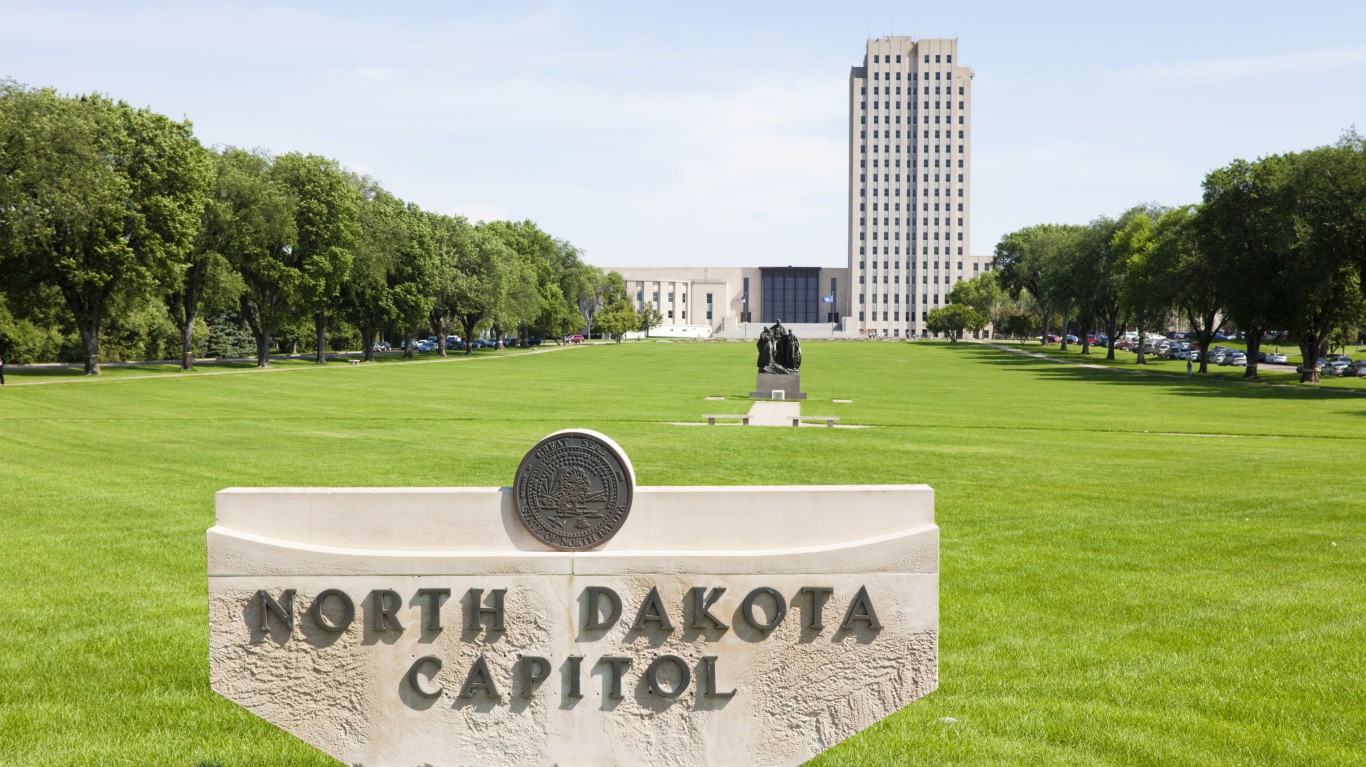
North Dakota: Bismarck
COVID-19 cases as of December 7 in Bismarck: 32,738 (25,676.3 per 100,000)
COVID-19 cases as of December 7 in North Dakota: 164,702 (21,612.7 per 100,000)
Peak pandemic unemployment in Bismarck: 9.5% (April 2020)
Bismarck population: 127,503 (29.8 per sq. mi.)
Source: Public Domain / Wikimedia Commons
Ohio: Lima
COVID-19 cases as of December 7 in Lima: 19,119 (18,530.7 per 100,000)
COVID-19 cases as of December 7 in Ohio: 1,731,003 (14,808.7 per 100,000)
Peak pandemic unemployment in Lima: 20.4% (April 2020)
Lima population: 103,175 (256.3 per sq. mi.)
These are all the counties in Ohio where COVID-19 is slowing (and where it’s still getting worse).

Source: DenisTangneyJr / Getty Images
Oklahoma: Lawton
COVID-19 cases as of December 7 in Lawton: 22,506 (17,635.2 per 100,000)
COVID-19 cases as of December 7 in Oklahoma: 672,227 (16,988.4 per 100,000)
Peak pandemic unemployment in Lawton: 19.5% (April 2020)
Lawton population: 127,620 (75.0 per sq. mi.)
Source: JamesBrey / Getty Images
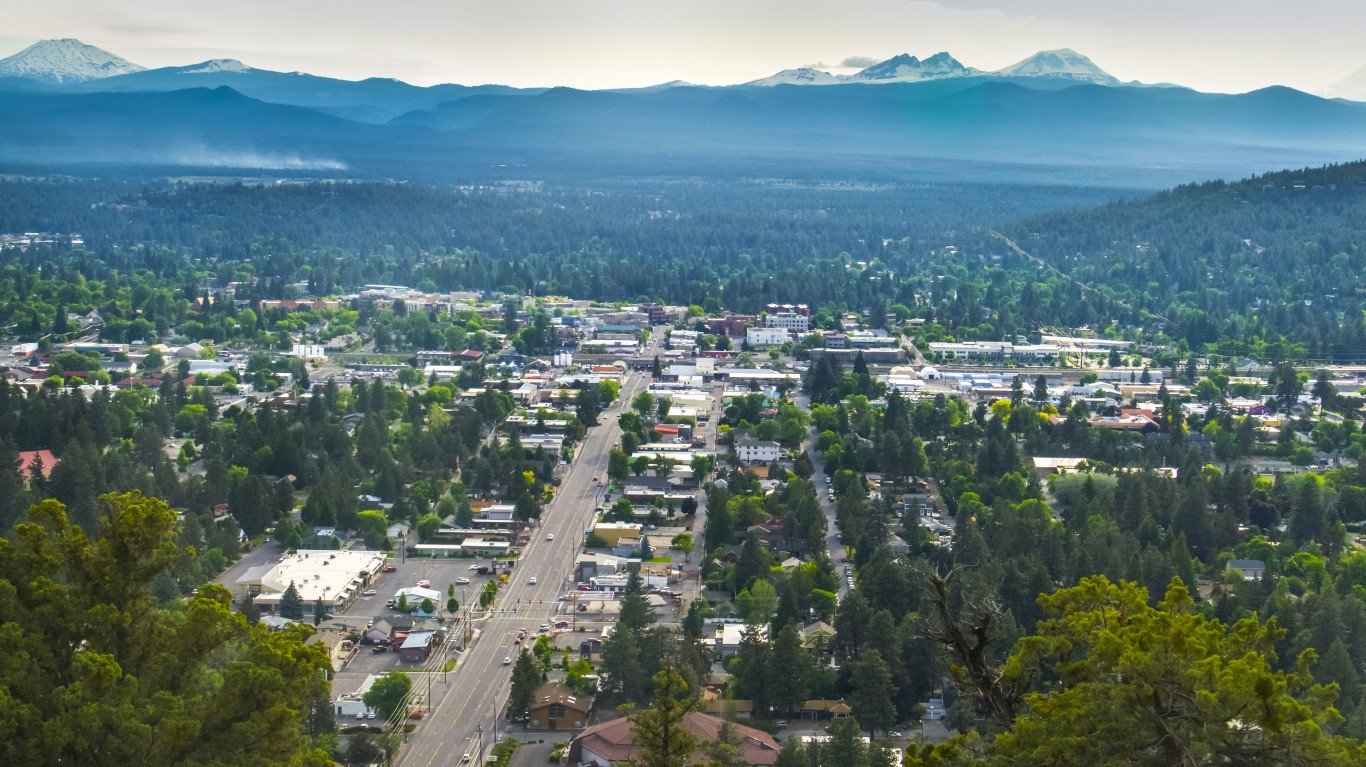
Oregon: Bend
COVID-19 cases as of December 7 in Bend: 23,795 (12,775.8 per 100,000)
COVID-19 cases as of December 7 in Oregon: 394,569 (9,355.0 per 100,000)
Peak pandemic unemployment in Bend: 18.3% (April 2020)
Bend population: 186,251 (61.7 per sq. mi.)
These are all the counties in Oregon where COVID-19 is slowing (and where it’s still getting worse).

Pennsylvania: Williamsport
COVID-19 cases as of December 7 in Williamsport: 20,036 (17,524.7 per 100,000)
COVID-19 cases as of December 7 in Pennsylvania: 1,779,151 (13,897.5 per 100,000)
Peak pandemic unemployment in Williamsport: 17.4% (April 2020)
Williamsport population: 114,330 (93.1 per sq. mi.)

Source: Sean Pavone / iStock via Getty Images
Rhode Island: Providence-Warwick, RI-MA
COVID-19 cases as of December 7 in Providence: 268,186 (16,572.4 per 100,000)
COVID-19 cases as of December 7 in Rhode Island: 194,858 (18,393.9 per 100,000)
Peak pandemic unemployment in Providence: 18.5% (April 2020)
Providence population: 1,618,268 (1,019.8 per sq. mi.)

Source: SeanPavonePhoto / iStock
South Carolina: Greenville-Anderson
COVID-19 cases as of December 7 in Greenville: 186,557 (20,822.4 per 100,000)
COVID-19 cases as of December 7 in South Carolina: 921,607 (17,899.8 per 100,000)
Peak pandemic unemployment in Greenville: 12.5% (April 2020)
Greenville population: 895,942 (330.5 per sq. mi.)

Source: DenisTangneyJr / Getty Images
South Dakota: Sioux Falls
COVID-19 cases as of December 7 in Sioux Falls: 54,169 (20,886.6 per 100,000)
COVID-19 cases as of December 7 in South Dakota: 168,271 (19,021.0 per 100,000)
Peak pandemic unemployment in Sioux Falls: 10.7% (April 2020)
Sioux Falls population: 259,348 (100.7 per sq. mi.)

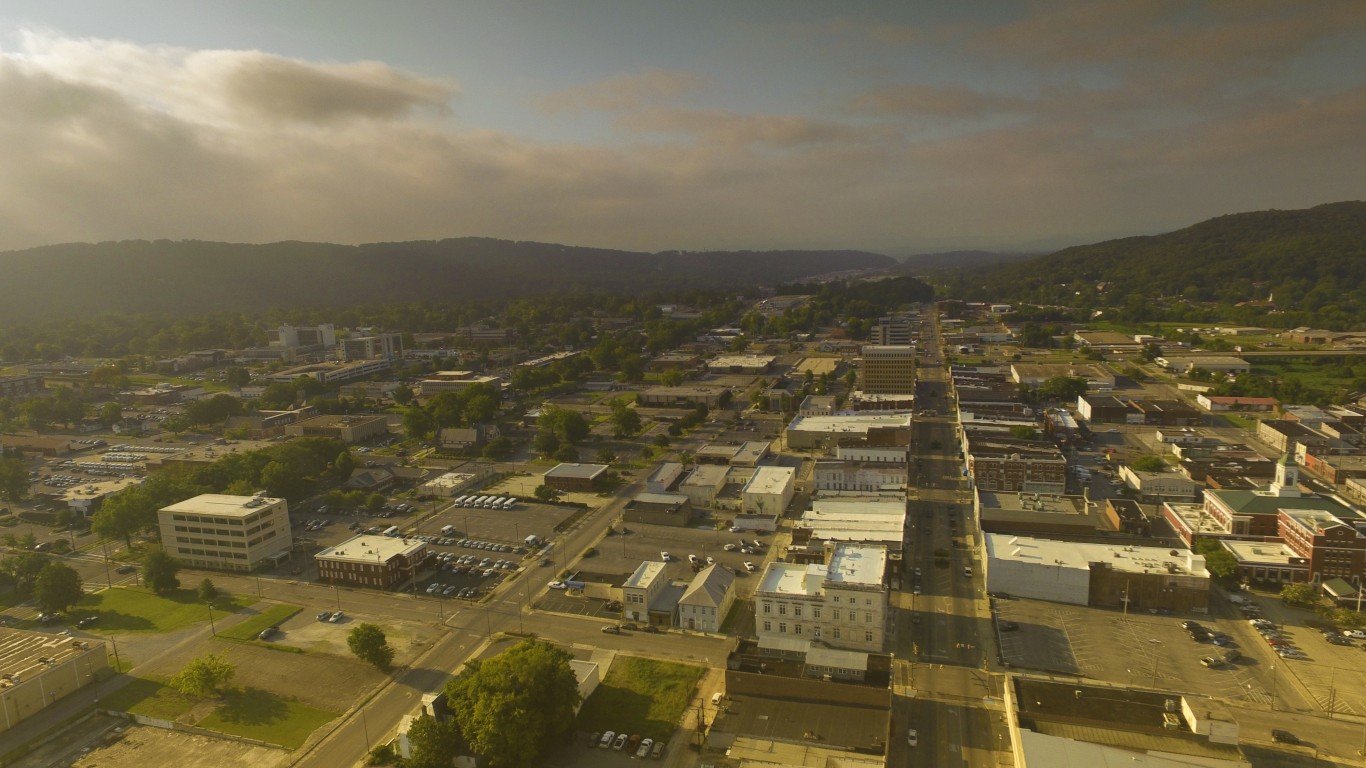
Tennessee: Cleveland
COVID-19 cases as of December 7 in Cleveland: 25,998 (21,211.9 per 100,000)
COVID-19 cases as of December 7 in Tennessee: 1,323,222 (19,376.0 per 100,000)
Peak pandemic unemployment in Cleveland: 14.3% (April 2020)
Cleveland population: 122,563 (160.5 per sq. mi.)

Source: Ron and Patty Thomas / Getty Images
Texas: Lubbock
COVID-19 cases as of December 7 in Lubbock: 70,194 (22,180.0 per 100,000)
COVID-19 cases as of December 7 in Texas: 4,327,926 (14,926.0 per 100,000)
Peak pandemic unemployment in Lubbock: 10.4% (April 2020)
Lubbock population: 316,474 (117.8 per sq. mi.)
These are all the counties in Texas where COVID-19 is slowing (and where it’s still getting worse).

Utah: Provo-Orem
COVID-19 cases as of December 7 in Provo: 138,967 (22,530.6 per 100,000)
COVID-19 cases as of December 7 in Utah: 601,952 (18,776.0 per 100,000)
Peak pandemic unemployment in Provo: 8.1% (April 2020)
Provo population: 616,791 (114.3 per sq. mi.)
These are all the counties in Utah where COVID-19 is slowing (and where it’s still getting worse).

Source: Sean Pavone / iStock via Getty Images
Vermont: Burlington-South Burlington
COVID-19 cases as of December 7 in Burlington: 18,264 (8,348.0 per 100,000)
COVID-19 cases as of December 7 in Vermont: 47,767 (7,655.1 per 100,000)
Peak pandemic unemployment in Burlington: 14.8% (April 2020)
Burlington population: 218,784 (174.7 per sq. mi.)

Source: Montes-Bradley / Getty Images
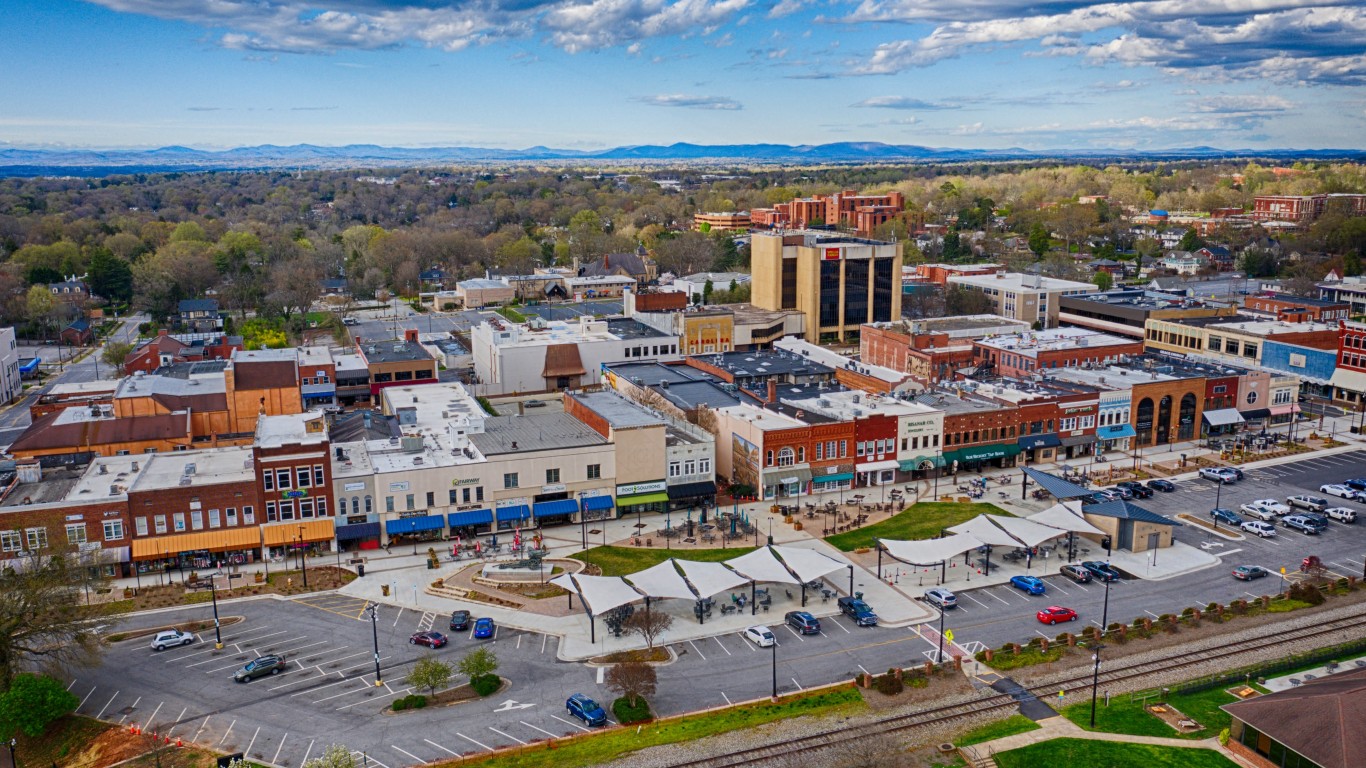
Virginia: Staunton
COVID-19 cases as of December 7 in Staunton: 18,160 (14,928.0 per 100,000)
COVID-19 cases as of December 7 in Virginia: 979,219 (11,472.3 per 100,000)
Peak pandemic unemployment in Staunton: 9.9% (April 2020)
Staunton population: 121,651 (121.4 per sq. mi.)
Source: alohadave / iStock via Getty Images
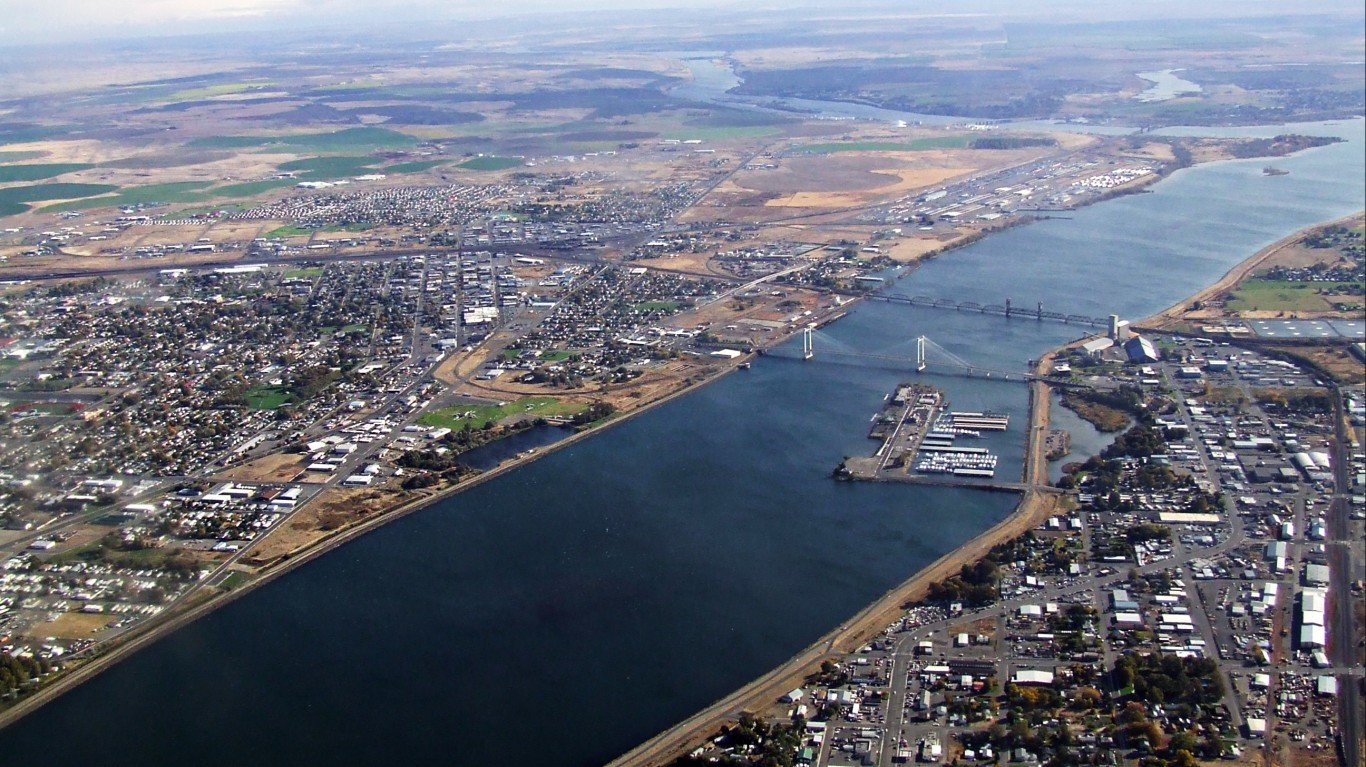
Washington: Kennewick-Richland
COVID-19 cases as of December 7 in Kennewick: 53,162 (18,361.7 per 100,000)
COVID-19 cases as of December 7 in Washington: 780,835 (10,254.1 per 100,000)
Peak pandemic unemployment in Kennewick: 13.7% (April 2020)
Kennewick population: 289,527 (98.4 per sq. mi.)

Source: traveler1116 / Getty Images
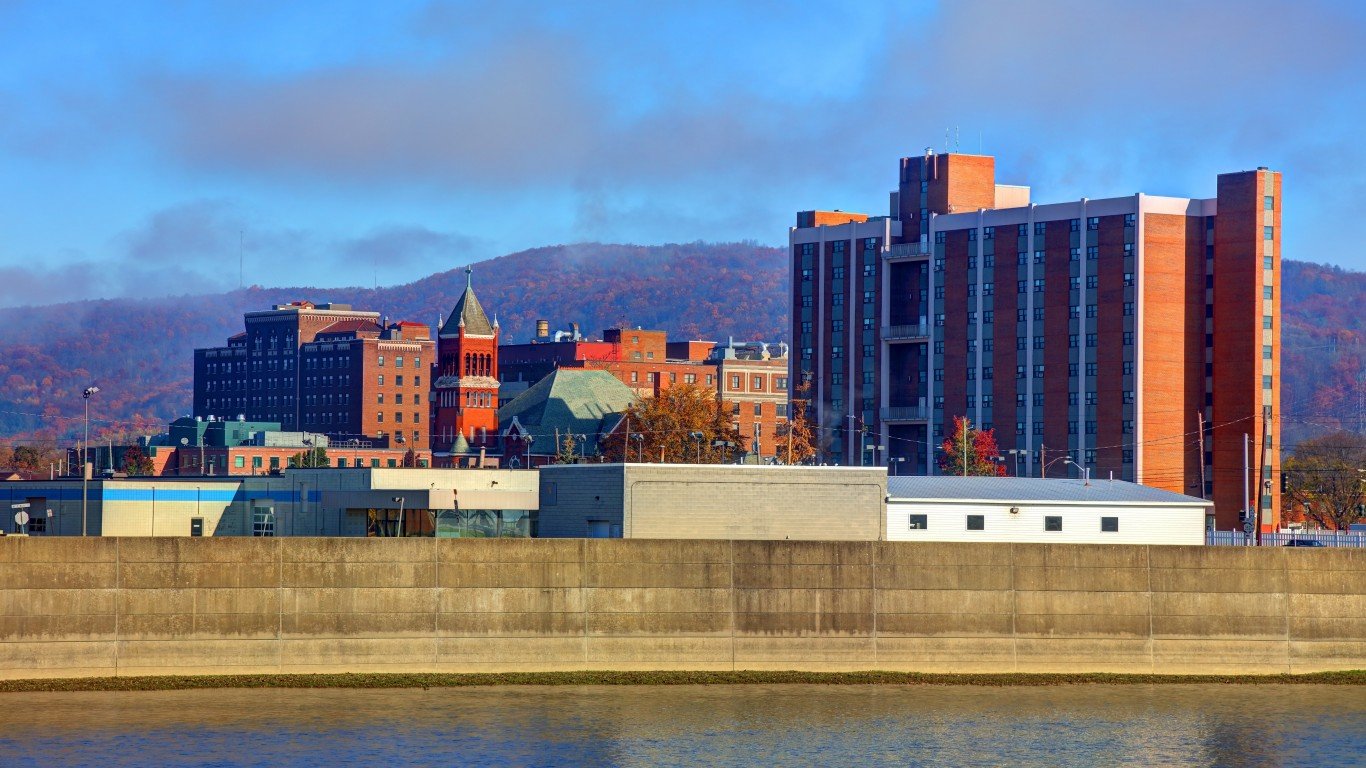
West Virginia: Huntington-Ashland, WV-KY-OH
COVID-19 cases as of December 7 in Huntington: 64,040 (17,698.8 per 100,000)
COVID-19 cases as of December 7 in West Virginia: 300,660 (16,776.5 per 100,000)
Peak pandemic unemployment in Huntington: 17.2% (April 2020)
Huntington population: 361,832 (144.7 per sq. mi.)
Source: ImagesbyK / Getty Images
Wisconsin: Green Bay
COVID-19 cases as of December 7 in Green Bay: 65,116 (20,386.9 per 100,000)
COVID-19 cases as of December 7 in Wisconsin: 997,688 (17,135.2 per 100,000)
Peak pandemic unemployment in Green Bay: 13.3% (April 2020)
Green Bay population: 319,401 (170.8 per sq. mi.)
Source: Public Domain / Wikimedia Commons
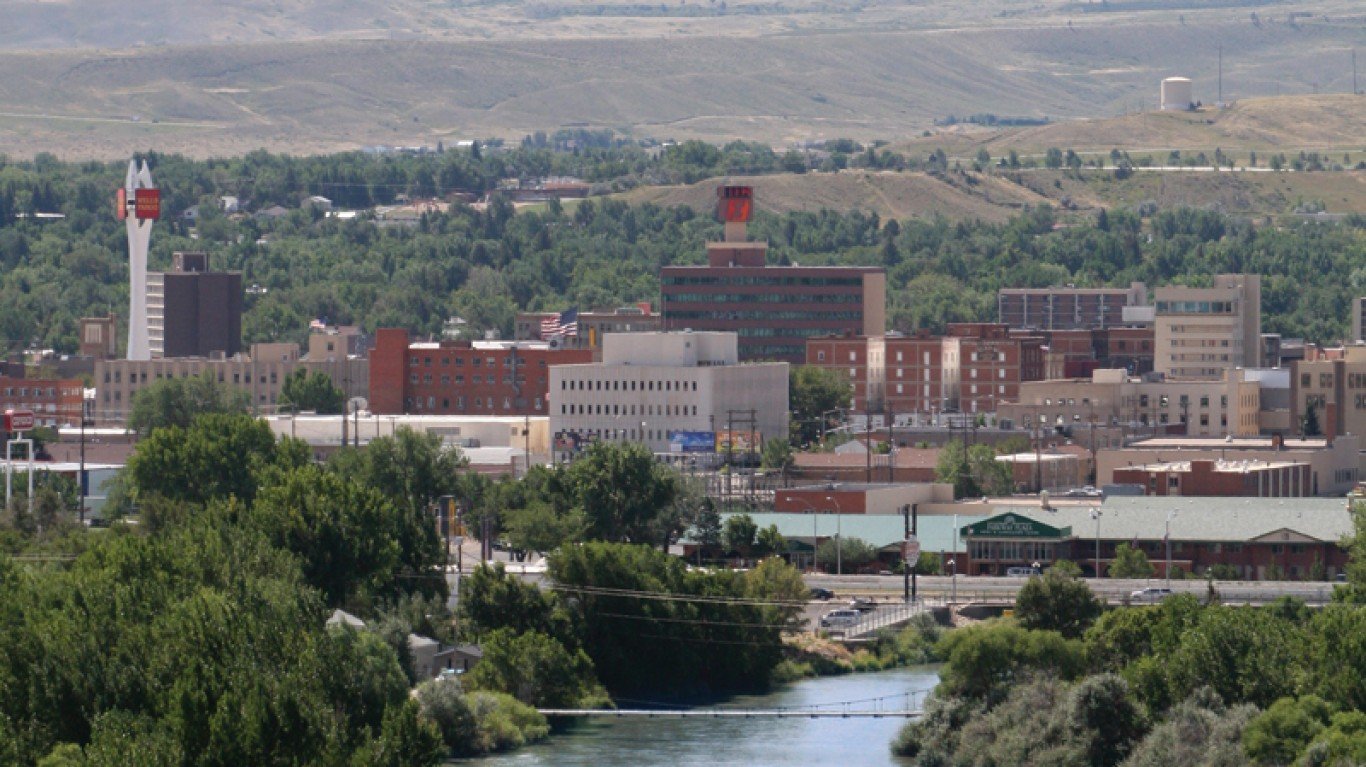
Wyoming: Casper
COVID-19 cases as of December 7 in Casper: 16,374 (20,382.7 per 100,000)
COVID-19 cases as of December 7 in Wyoming: 111,812 (19,319.3 per 100,000)
Peak pandemic unemployment in Casper: 12.6% (April 2020)
Casper population: 80,333 (15.0 per sq. mi.)
Click here to see all coronavirus data for every state.
Sponsored: Want to Retire Early? Here’s a Great First Step
Want retirement to come a few years earlier than you’d planned? Or are you ready to retire now, but want an extra set of eyes on your finances?
Now you can speak with up to 3 financial experts in your area for FREE. By simply clicking here you can begin to match with financial professionals who can help you build your plan to retire early. And the best part? The first conversation with them is free.
Click here to match with up to 3 financial pros who would be excited to help you make financial decisions.
Thank you for reading! Have some feedback for us?
Contact the 24/7 Wall St. editorial team.
Editors' Picks


