
D.Q. Corp., whose restaurants are branded as Dairy Queen and DQ Grill and Chill, offers its signature Blizzards (dense, ice-cold soft-serve ice cream shakes blended with various additions), along with burgers and other kinds of fast food at more than 4,000 locations across the United States. It’s owned by Warren Buffett’s Berkshire Hathaway, and Buffet is said to be a fan of Blizzards. In fact, he and Bill Gates worked a shift serving them up at an Omaha DQ in 2019. (We hope they’re not watching their weight. (Here are 24 milkshakes with more calories than an entire meal.)
To determine which states have the most DQ outlets, both total and per capita, 24/7 Tempo reviewed data collected by NiceRx, a patient assistance program and medication access company, using numbers for total fast-food restaurants taken from the U.S. Census Bureau and tracking the nation’s ten most popular chains as determined by ScrapeHero.com. (Population figures are five-year estimates from the U.S. Census Bureau’s 2019 American Community Survey.) We then ranked the states by their per capita DQ restaurants population per 100,000 residents, lowest to highest. Ties were broken using the total number of Dairy Queen restaurants in the state.
Click here to see the Dairy Queen capitals of America
We discovered that the Dairy Queen capitals of America are North and South Dakota, with 5 and 4.5 restaurants per 100,000 residents, respectively. That’s somewhat unusual, as the Dakotas are typically near the bottom of other fast-food chain rankings.
Minnesota — the home state of the company, whose corporate offices are in Bloomington — claims the No. 3 spot, with 4 Dairy Queens per 100,000 people. Texas is the leader in absolute terms, on the other hand, with 580 Dairy Queens, or roughly 15% of all the outlets in the country. Vermont, famously inhospitable to big chain operations, isn’t on the list: It is the only state in the union that doesn’t have a single DQ restaurant.

Source: SeanPavonePhoto / Getty Images
49. Rhode Island
> All Dairy Queen restaurants per 100K people: 0.2
> Total Dairy Queen restaurants: 2 — 2nd lowest
> Total population in 2019: 1,059,361 — 7th lowest
[in-text-ad]

Source: TomasSereda / Getty Images
48. New York
> All Dairy Queen restaurants per 100K people: 0.2
> Total Dairy Queen restaurants: 39 — 22nd lowest
> Total population in 2019: 19,453,561 — 4th highest
 24/7 Wall St.
Source: choness / Getty Images
47. California
> All Dairy Queen restaurants per 100K people: 0.2
> Total Dairy Queen restaurants: 79 — 22nd highest
> Total population in 2019: 39,512,223 — the highest

Source: okimo / iStock via Getty Images
46. Hawaii
> All Dairy Queen restaurants per 100K people: 0.5
> Total Dairy Queen restaurants: 7 — 4th lowest
> Total population in 2019: 1,415,872 — 11th lowest
[in-text-ad-2]

Source: DenisTangneyJr / Getty Images
45. Oklahoma
> All Dairy Queen restaurants per 100K people: 0.5
> Total Dairy Queen restaurants: 20 — 8th lowest
> Total population in 2019: 3,956,971 — 23rd lowest

Source: Davel5957 / Getty Images
44. Maryland
> All Dairy Queen restaurants per 100K people: 0.5
> Total Dairy Queen restaurants: 30 — 14th lowest
> Total population in 2019: 6,045,680 — 19th highest
[in-text-ad]

Source: DenisTangneyJr / Getty Images
43. Massachusetts
> All Dairy Queen restaurants per 100K people: 0.5
> Total Dairy Queen restaurants: 34 — 18th lowest
> Total population in 2019: 6,892,503 — 15th highest

Source: SeanPavonePhoto / Getty Images
42. South Carolina
> All Dairy Queen restaurants per 100K people: 0.6
> Total Dairy Queen restaurants: 31 — 15th lowest
> Total population in 2019: 5,148,714 — 23rd highest
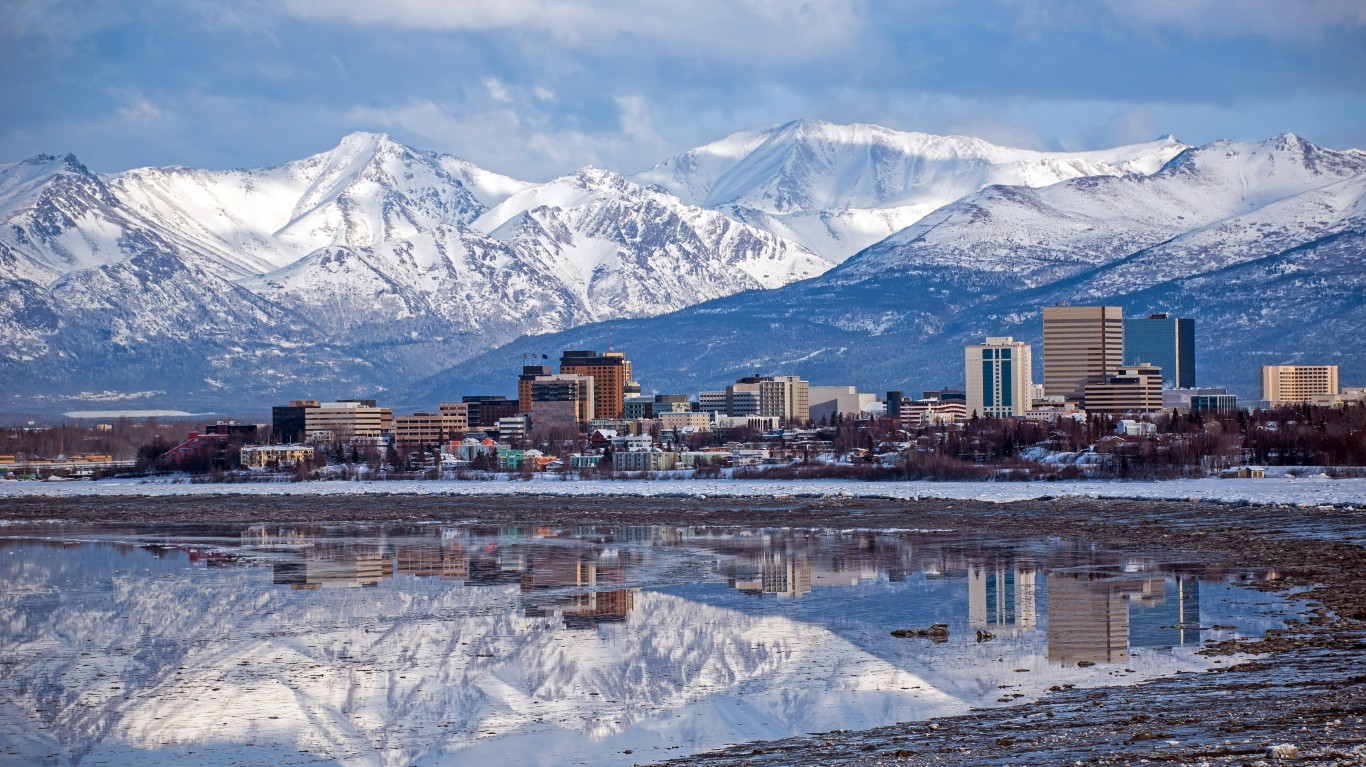
Source: Chilkoot / Getty Images
41. Alaska
> All Dairy Queen restaurants per 100K people: 0.7
> Total Dairy Queen restaurants: 5 — 3rd lowest
> Total population in 2019: 731,545 — 3rd lowest
[in-text-ad-2]

Source: f11photo / Getty Images
40. Louisiana
> All Dairy Queen restaurants per 100K people: 0.7
> Total Dairy Queen restaurants: 33 — 16th lowest
> Total population in 2019: 4,648,794 — 25th highest

Source: marchello74 / Getty Images
39. Florida
> All Dairy Queen restaurants per 100K people: 0.7
> Total Dairy Queen restaurants: 150 — 9th highest
> Total population in 2019: 21,477,737 — 3rd highest
[in-text-ad]

Source: Adventure_Photo / Getty Images
38. Utah
> All Dairy Queen restaurants per 100K people: 0.8
> Total Dairy Queen restaurants: 26 — 11th lowest
> Total population in 2019: 3,205,958 — 21st lowest
 24/7 Wall St.
Source: DenisTangneyJr / Getty Images
37. New Hampshire
> All Dairy Queen restaurants per 100K people: 0.9
> Total Dairy Queen restaurants: 12 — 6th lowest
> Total population in 2019: 1,359,711 — 10th lowest

Source: SeanPavonePhoto / Getty Images
36. Mississippi
> All Dairy Queen restaurants per 100K people: 0.9
> Total Dairy Queen restaurants: 27 — 12th lowest
> Total population in 2019: 2,976,149 — 17th lowest
[in-text-ad-2]

Source: SeanPavonePhoto / Getty Images
35. New Jersey
> All Dairy Queen restaurants per 100K people: 0.9
> Total Dairy Queen restaurants: 80 — 21st highest
> Total population in 2019: 8,882,190 — 11th highest

Source: Sean Pavone / Getty Images
34. North Carolina
> All Dairy Queen restaurants per 100K people: 0.9
> Total Dairy Queen restaurants: 94 — 17th highest
> Total population in 2019: 10,488,084 — 9th highest
[in-text-ad]

Source: DenisTangneyJr / Getty Images
33. Arkansas
> All Dairy Queen restaurants per 100K people: 1.0
> Total Dairy Queen restaurants: 30 — 13th lowest
> Total population in 2019: 3,017,804 — 18th lowest
 24/7 Wall St.
Source: SeanPavonePhoto / Getty Images
32. Connecticut
> All Dairy Queen restaurants per 100K people: 1.1
> Total Dairy Queen restaurants: 39 — 23rd lowest
> Total population in 2019: 3,565,287 — 22nd lowest

Source: Sean Pavone / Getty Images
31. Virginia
> All Dairy Queen restaurants per 100K people: 1.1
> Total Dairy Queen restaurants: 94 — 18th highest
> Total population in 2019: 8,535,519 — 12th highest
[in-text-ad-2]

Source: photoquest7 / Getty Images
30. Nevada
> All Dairy Queen restaurants per 100K people: 1.2
> Total Dairy Queen restaurants: 37 — 20th lowest
> Total population in 2019: 3,080,156 — 19th lowest

Source: benedek / Getty Images
29. Tennessee
> All Dairy Queen restaurants per 100K people: 1.2
> Total Dairy Queen restaurants: 82 — 20th highest
> Total population in 2019: 6,829,174 — 16th highest
[in-text-ad]

Source: vkbhat / Getty Images
28. Idaho
> All Dairy Queen restaurants per 100K people: 1.3
> Total Dairy Queen restaurants: 23 — 10th lowest
> Total population in 2019: 1,787,065 — 12th lowest
 24/7 Wall St.
Source: Sean Pavone / Getty Images
27. Alabama
> All Dairy Queen restaurants per 100K people: 1.3
> Total Dairy Queen restaurants: 64 — 25th highest
> Total population in 2019: 4,903,185 — 24th highest

Source: aiisha5 / iStock via Getty Images
26. Washington
> All Dairy Queen restaurants per 100K people: 1.3
> Total Dairy Queen restaurants: 99 — 15th highest
> Total population in 2019: 7,614,893 — 13th highest
[in-text-ad-2]

Source: DenisTangneyJr / Getty Images
25. Delaware
> All Dairy Queen restaurants per 100K people: 1.5
> Total Dairy Queen restaurants: 15 — 7th lowest
> Total population in 2019: 973,764 — 6th lowest

Source: f11photo / Getty Images
24. Colorado
> All Dairy Queen restaurants per 100K people: 1.5
> Total Dairy Queen restaurants: 86 — 19th highest
> Total population in 2019: 5,758,736 — 21st highest
[in-text-ad]

Source: Dreamframer / Getty Images
23. Arizona
> All Dairy Queen restaurants per 100K people: 1.5
> Total Dairy Queen restaurants: 109 — 12th highest
> Total population in 2019: 7,278,717 — 14th highest

Source: f11photo / Getty Images
22. Pennsylvania
> All Dairy Queen restaurants per 100K people: 1.5
> Total Dairy Queen restaurants: 192 — 7th highest
> Total population in 2019: 12,801,989 — 5th highest

Source: SeanXu / Getty Images
21. Wyoming
> All Dairy Queen restaurants per 100K people: 1.6
> Total Dairy Queen restaurants: 9 — 5th lowest
> Total population in 2019: 578,759 — the lowest
[in-text-ad-2]

Source: ferrantraite / Getty Images
20. New Mexico
> All Dairy Queen restaurants per 100K people: 1.6
> Total Dairy Queen restaurants: 34 — 17th lowest
> Total population in 2019: 2,096,829 — 15th lowest

Source: pawel.gaul / Getty Images
19. Michigan
> All Dairy Queen restaurants per 100K people: 1.6
> Total Dairy Queen restaurants: 160 — 8th highest
> Total population in 2019: 9,986,857 — 10th highest
[in-text-ad]

Source: SeanPavonePhoto / Getty Images
18. Maine
> All Dairy Queen restaurants per 100K people: 1.7
> Total Dairy Queen restaurants: 23 — 9th lowest
> Total population in 2019: 1,344,212 — 9th lowest
 24/7 Wall St.
Source: f11photo / Getty Images
17. Missouri
> All Dairy Queen restaurants per 100K people: 1.7
> Total Dairy Queen restaurants: 104 — 13th highest
> Total population in 2019: 6,137,428 — 18th highest

Source: Sean Pavone / Getty Images
16. Georgia
> All Dairy Queen restaurants per 100K people: 2.0
> Total Dairy Queen restaurants: 212 — 5th highest
> Total population in 2019: 10,617,423 — 8th highest
[in-text-ad-2]

Source: Sean Pavone / Getty Images
15. Illinois
> All Dairy Queen restaurants per 100K people: 2.0
> Total Dairy Queen restaurants: 253 — 3rd highest
> Total population in 2019: 12,671,821 — 6th highest

Source: Sean Pavone / Getty Images
14. Texas
> All Dairy Queen restaurants per 100K people: 2.0
> Total Dairy Queen restaurants: 580 — the highest
> Total population in 2019: 28,995,881 — 2nd highest
[in-text-ad]

Source: Davel5957 / Getty Images
13. Kansas
> All Dairy Queen restaurants per 100K people: 2.2
> Total Dairy Queen restaurants: 64 — 24th highest
> Total population in 2019: 2,913,314 — 16th lowest

Source: Sean Pavone / Getty Images
12. Wisconsin
> All Dairy Queen restaurants per 100K people: 2.2
> Total Dairy Queen restaurants: 128 — 11th highest
> Total population in 2019: 5,822,434 — 20th highest

Source: Sean Pavone / Getty Images
11. Ohio
> All Dairy Queen restaurants per 100K people: 2.2
> Total Dairy Queen restaurants: 257 — 2nd highest
> Total population in 2019: 11,689,100 — 7th highest
[in-text-ad-2]

Source: 4nadia / Getty Images
10. Oregon
> All Dairy Queen restaurants per 100K people: 2.3
> Total Dairy Queen restaurants: 97 — 16th highest
> Total population in 2019: 4,217,737 — 24th lowest

Source: DenisTangneyJr / Getty Images
9. Nebraska
> All Dairy Queen restaurants per 100K people: 2.9
> Total Dairy Queen restaurants: 56 — 25th lowest
> Total population in 2019: 1,934,408 — 14th lowest
[in-text-ad]

Source: Davel5957 / Getty Images
8. Kentucky
> All Dairy Queen restaurants per 100K people: 3.1
> Total Dairy Queen restaurants: 138 — 10th highest
> Total population in 2019: 4,467,673 — 25th lowest

Source: Sean Pavone / Getty Images
7. Indiana
> All Dairy Queen restaurants per 100K people: 3.1
> Total Dairy Queen restaurants: 209 — 6th highest
> Total population in 2019: 6,732,219 — 17th highest

Source: KudicM / Getty Images
6. Iowa
> All Dairy Queen restaurants per 100K people: 3.3
> Total Dairy Queen restaurants: 104 — 14th highest
> Total population in 2019: 3,155,070 — 20th lowest
[in-text-ad-2]

Source: peeterv / Getty Images
5. Montana
> All Dairy Queen restaurants per 100K people: 3.4
> Total Dairy Queen restaurants: 36 — 19th lowest
> Total population in 2019: 1,068,778 — 8th lowest

Source: Sean Pavone / Getty Images
4. West Virginia
> All Dairy Queen restaurants per 100K people: 3.9
> Total Dairy Queen restaurants: 70 — 23rd highest
> Total population in 2019: 1,792,147 — 13th lowest
[in-text-ad]

Source: RudyBalasko / Getty Images
3. Minnesota
> All Dairy Queen restaurants per 100K people: 4.0
> Total Dairy Queen restaurants: 226 — 4th highest
> Total population in 2019: 5,639,632 — 22nd highest

Source: EunikaSopotnicka / Getty Images
2. South Dakota
> All Dairy Queen restaurants per 100K people: 4.5
> Total Dairy Queen restaurants: 40 — 24th lowest
> Total population in 2019: 884,659 — 5th lowest

Source: DenisTangneyJr / Getty Images
1. North Dakota
> All Dairy Queen restaurants per 100K people: 5.0
> Total Dairy Queen restaurants: 38 — 21st lowest
> Total population in 2019: 762,062 — 4th lowest
Take This Retirement Quiz To Get Matched With A Financial Advisor (Sponsored)
Take the quiz below to get matched with a financial advisor today.
Each advisor has been vetted by SmartAsset and is held to a fiduciary standard to act in your best interests.
Here’s how it works:
1. Answer SmartAsset advisor match quiz
2. Review your pre-screened matches at your leisure. Check out the
advisors’ profiles.
3. Speak with advisors at no cost to you. Have an introductory call on the phone or introduction in person and choose whom to work with in the future
Take the retirement quiz right here.
Thank you for reading! Have some feedback for us?
Contact the 24/7 Wall St. editorial team.
Editors' Picks