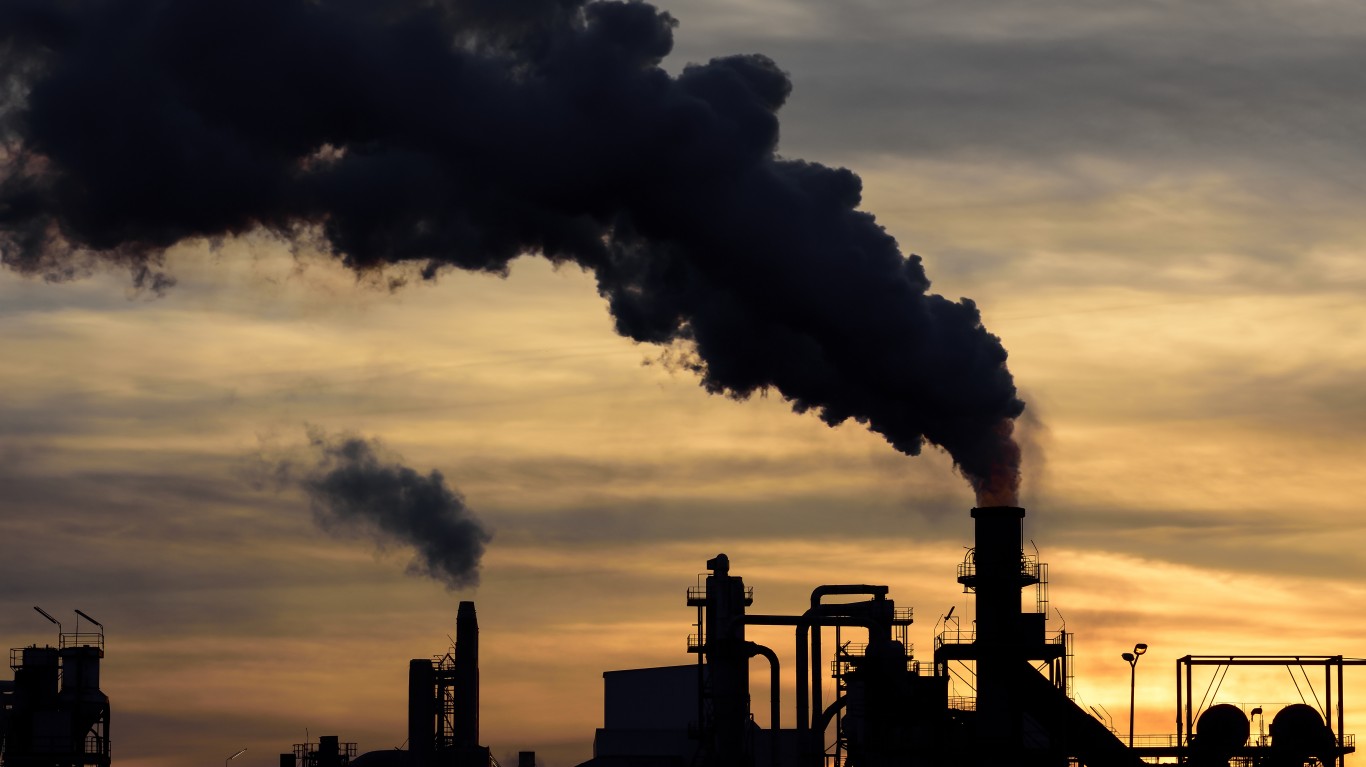
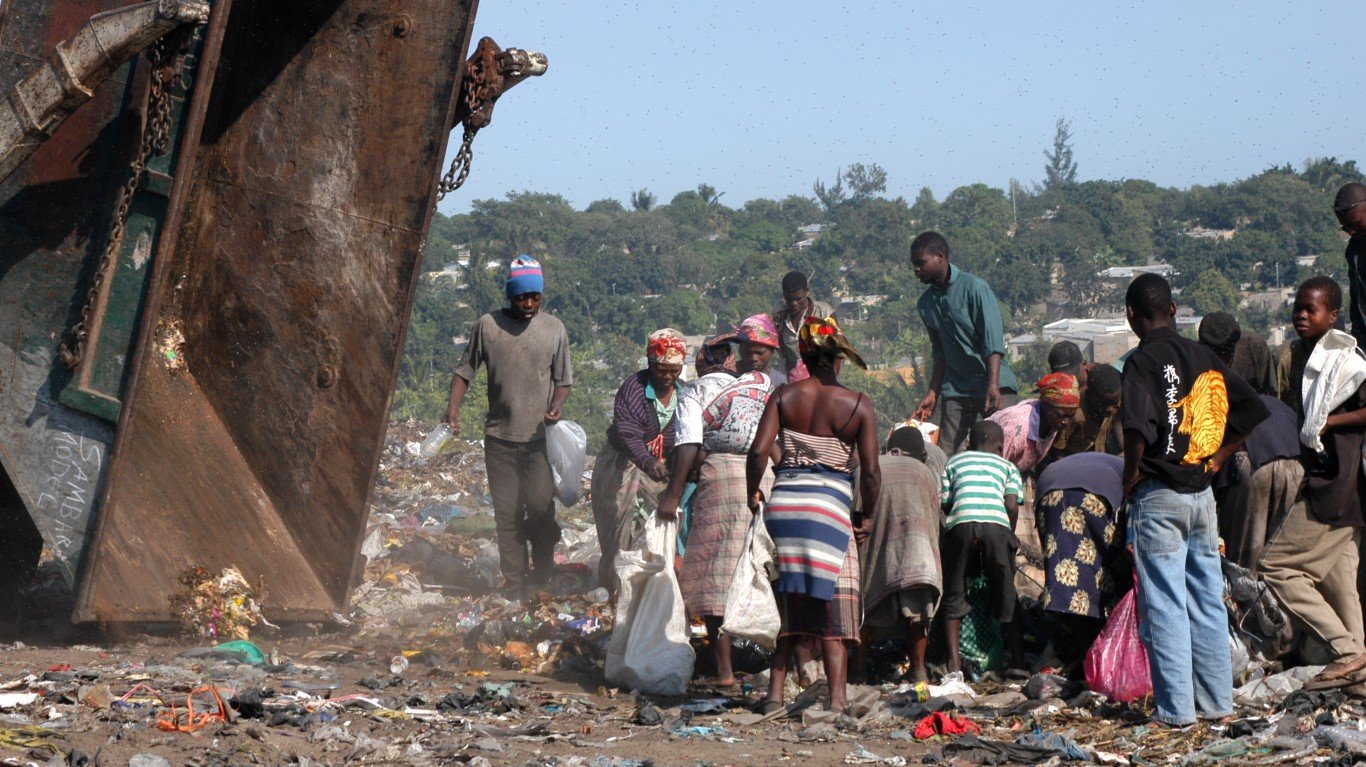
The rewards of economic development are many: an increase in living standards, higher literacy rates, technological advances, longer lifespans, and greater wealth, among other benefits.
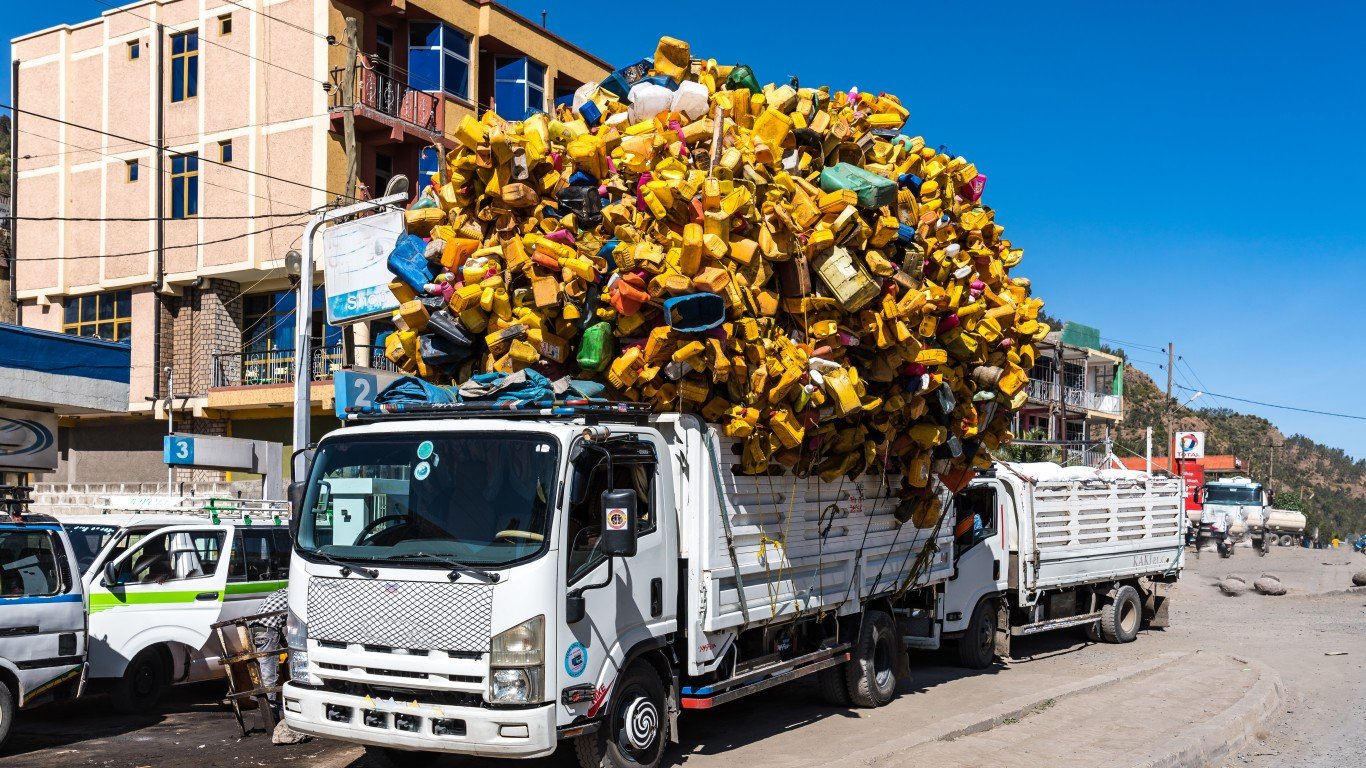
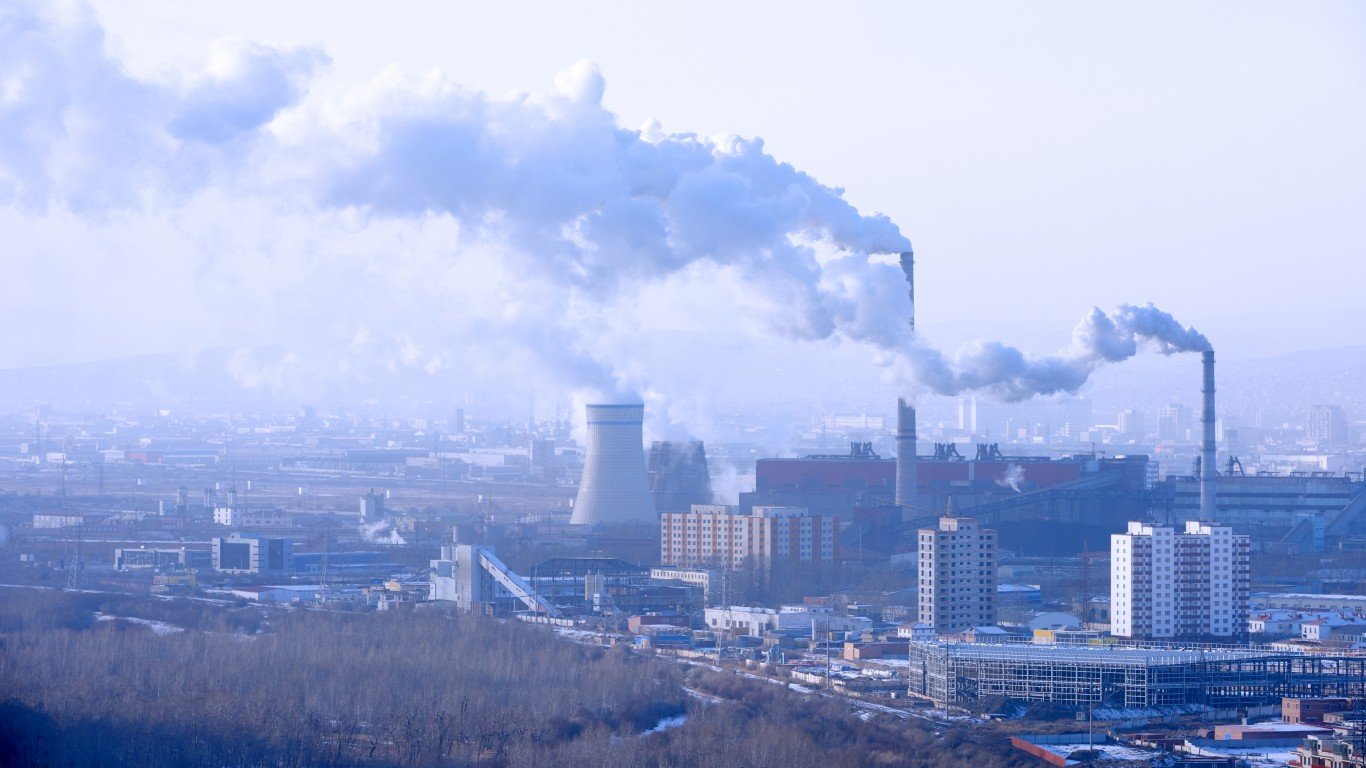
Historically, the fastest way to improve people’s lives is through the use of fossil fuels such as coal, natural gas, and petroleum, accessed through mining and drilling. Harnessing the power of these fuels accelerated with the advent of the Industrial Revolution, converting many of the world’s economies into industrial powerhouses from largely agrarian societies. It is only within the last century, with the rise of the environmental movement, that we have been made aware of the threat fossil fuels pose to the future of our planet. (These are 26 countries that consume more energy than they produce.)
Many countries, most of them developed nations, have taken steps to switch to cleaner energy sources. But some have not and continue to use fossil fuels to raise their standard of living.
To determine the 25 countries increasing emissions the fastest, 24/7 Wall St. reviewed data from two sources: the 2021 Global Carbon Budget published annually by the Integrated Carbon Observation System, a community of more than 500 scientists and 80 universities and institutes studying greenhouse gas concentrations and carbon fluxes worldwide; and the International Energy Agency’s Greenhouse Gas Emissions from Energy 2021 Edition report.
We ranked 25 countries, lowest to highest, on the percentage of their change in CO2 emissions from 2010 to 2020, using data from the Global Carbon Project. Data on CO2 emissions change from 1971 to 2020 and total emissions by country is also from the same source. Data on each country’s change in CO2 emissions per capita and GHG emissions are from the IEA report.
Of the 25 countries on our list, all but one is in either Asia or Africa. The lone exception is Guatemala in Central America. (On a more local basis, these are the cities that emit the most carbon dioxide in the world.)
Click here to see the 25 countries increasing emissions the fastest
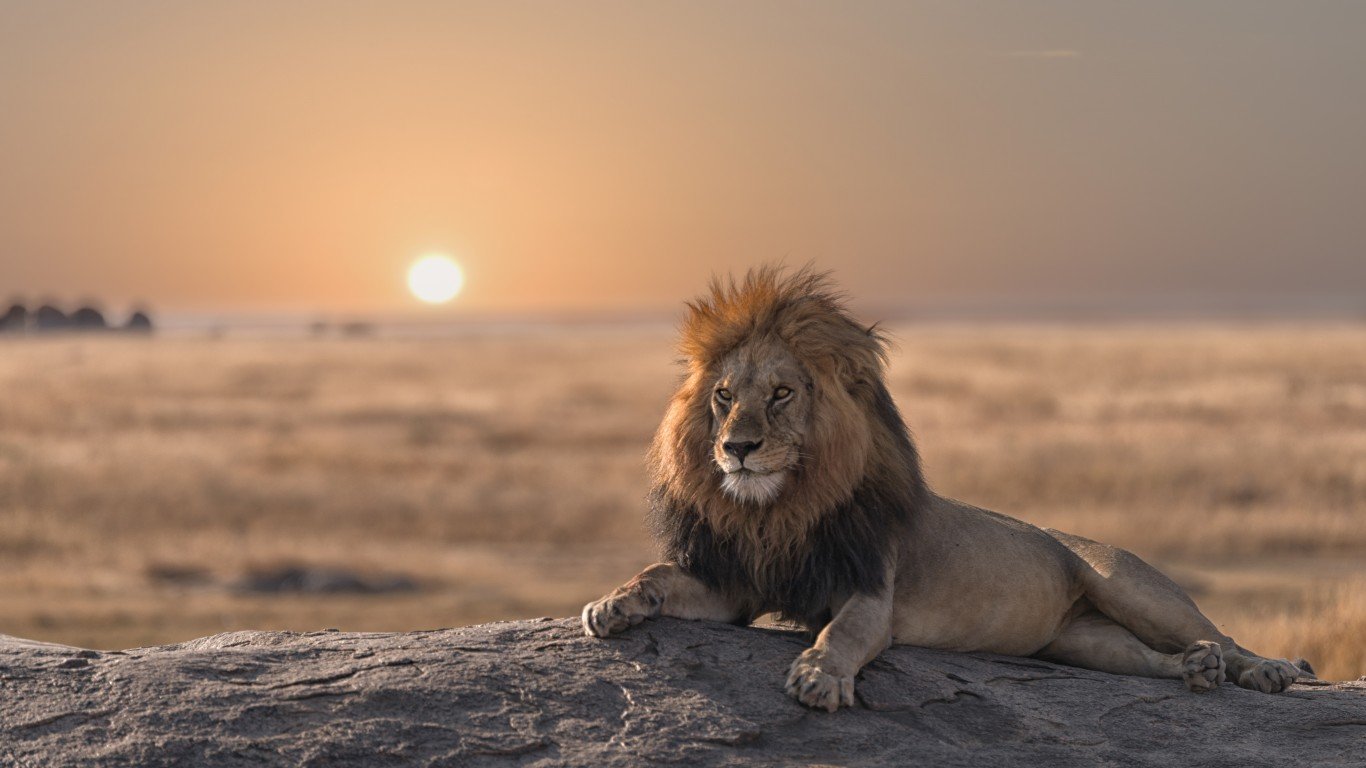
Virtually all of them have some of the fastest-growing economies in the world. For many, like Equatorial Guinea and the Republic of Congo, development has depended on drilling for oil. It has also sometimes meant unfettered deforestation, an issue especially in nations such as Mongolia, where environmental laws and institutions are weak.
Most of the nations on this list are signatories to the Paris Agreement on climate change. Many have action plans to address sustainability and combat climate change. Their challenge is raising the economic well-being of their citizens while being guardians of the health of the planet.

Source: DancingMan / iStock via Getty Images
25. Equatorial Guinea
> Total CO2 emissions change 2010-2020: 50.87%
> Total CO2 emissions change 1971-2020: 15,464.76% — #1 largest increase of 145 countries
> Total CO2 emissions 2020 in million tons: 10.27 — #104 largest of 145 countries
> CO2 emissions per capita change 2010-2019: -57.90% — #2 largest decline of 144 countries
> Total GHG emissions change 2010-2019: -33.45% — #7 largest decline of 88 countries
A former Spanish colony on Africa’s Atlantic coast, Equatorial Guinea has become one of the sub-Sahara’s largest oil producers since oil was discovered there in 1995. The nation saw the biggest increase in total CO2 emissions from 1971 to 2020, more than 15,000%. Recent data is
more favorable: Equatorial Guinea had the world’s second-largest decline in CO2 emissions per capita from 2010 to 2019, at 57.90%.
[in-text-ad]
Source: Umar Kashif Thanvi / iStock via Getty Images
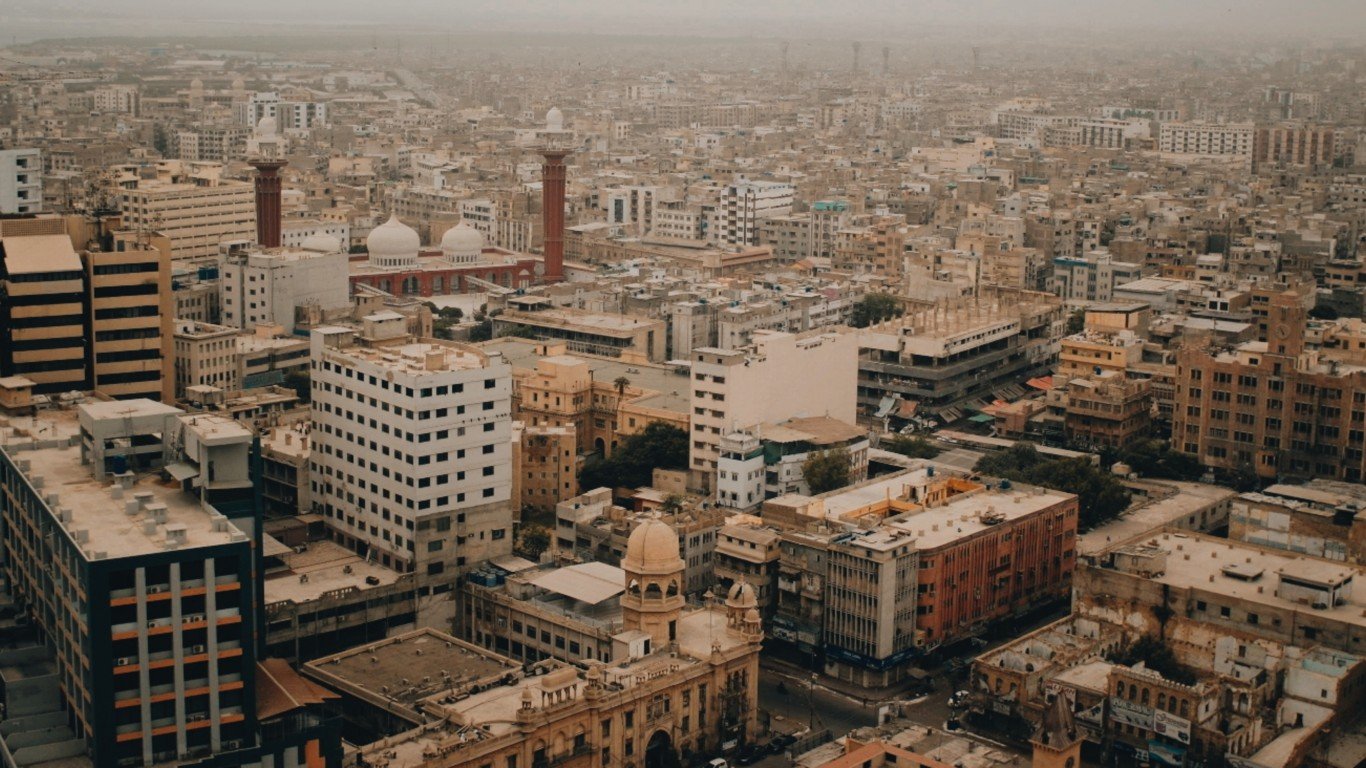
24. Pakistan
> Total CO2 emissions change 2010-2020: 52.29%
> Total CO2 emissions change 1971-2020: 1,107.54% — #14 largest increase of 145 countries
> Total CO2 emissions 2020 in million tons: 234.93 — #26 largest of 145 countries
> CO2 emissions per capita change 2010-2019: 11.94% — #51 largest increase of 144 countries
> Total GHG emissions change 2010-2019: 31.55% — #27 largest increase of 88 countries
Pakistan’s accelerating and unplanned urbanization is causing a significant increase in greenhouse gases, threatening to melt the glaciers in the northern part of the country. The Pakistan Journal of Meteorology reported in 2017 that the nation’s greenhouse-gas emissions were rising at an annual rate of 6%.
 24/7 Wall St.
Source: atosan / Getty Images
23. Senegal
> Total CO2 emissions change 2010-2020: 52.30%
> Total CO2 emissions change 1971-2020: 673.57% — #32 largest increase of 145 countries
> Total CO2 emissions 2020 in million tons: 10.46 — #103 largest of 145 countries
> CO2 emissions per capita change 2010-2019: 21.35% — #38 largest increase of 144 countries
> Total GHG emissions change 2010-2019: 51.03% — #16 largest increase of 88 countries
The majority of Senegal’s greenhouse-gas emissions are from its agricultural sector. In recent years, the country’s CO2 emissions per capita fluctuated substantially, but the overall trend has been increasing during the 1971-2020 period, with 0.58 tons of CO2 per capita in 2020.
Source: MrRuj / iStock via Getty Images
22. United Republic of Tanzania
> Total CO2 emissions change 2010-2020: 57.92%
> Total CO2 emissions change 1971-2020: 344.39% — #54 largest increase of 145 countries
> Total CO2 emissions 2020 in million tons: 10.95 — #99 largest of 145 countries
> CO2 emissions per capita change 2010-2019: 36.03% — #25 largest increase of 144 countries
> Total GHG emissions change 2010-2019: 47.06% — #18 largest increase of 88 countries
Tanzania’s energy emissions climbed 171% from 1990 to 2014. Much of its greenhouse-gas emissions are from deforestation due to such factors as forest and bush fires. The population depends on wood and charcoal for energy.
[in-text-ad-2]
Source: Photocech / Getty Images
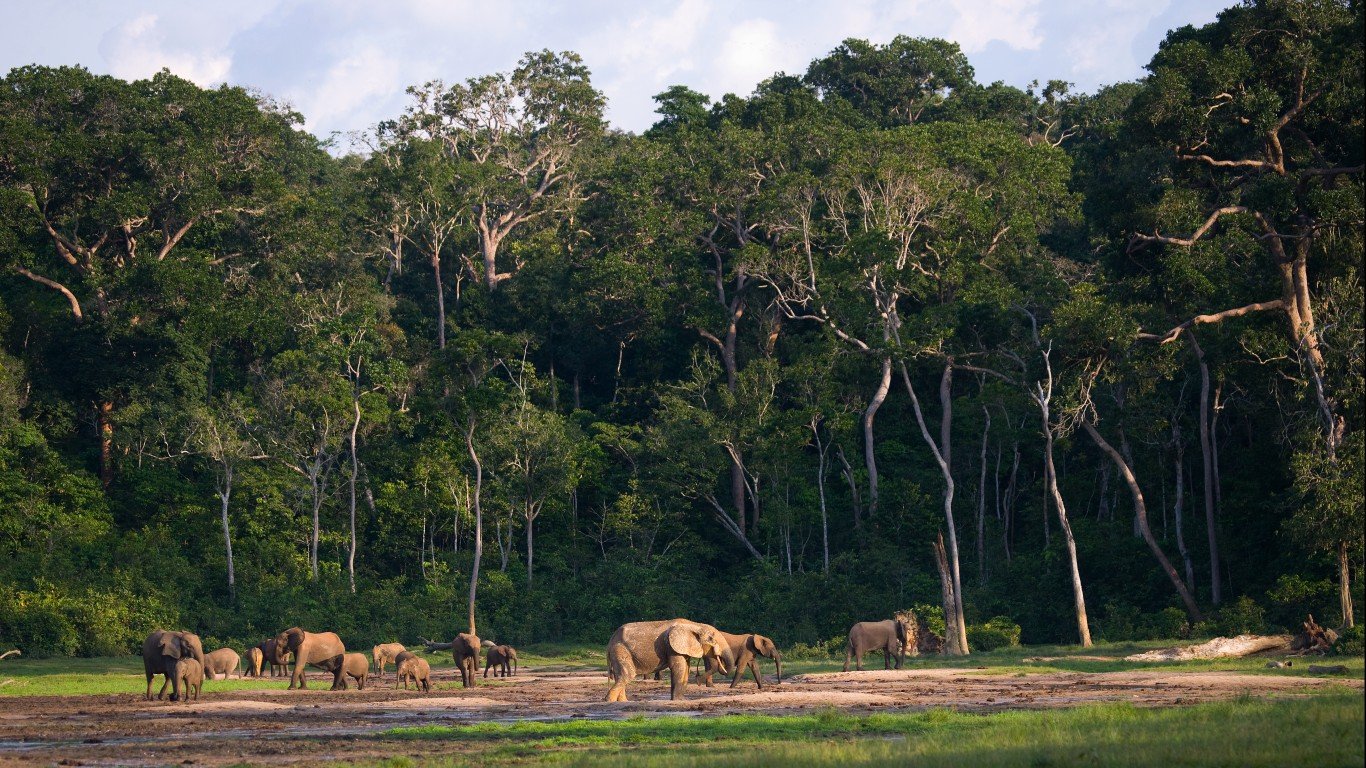
20. Democratic Republic of Congo
> Total CO2 emissions change 2010-2020: 58.87%
> Total CO2 emissions change 1971-2020: 354.89% — #52 largest increase of 145 countries
> Total CO2 emissions 2020 in million tons: 3.12 — #134 largest of 145 countries
> CO2 emissions per capita change 2010-2019: -13.79% — #35 largest decline of 144 countries
> Total GHG emissions change 2010-2019: 0.80% — #57 largest increase of 88 countries
The Democratic Republic of Congo faces a quandary. The west-central African nation has some of the world’s largest reserves of peat, which is dried and burned for fuel. This energy source would help boost the nation’s economy. However, peat emits a lot of carbon, and it is estimated that conversion of peatland into farm use over the centuries has sent more than 250 billion tons of CO2 into the atmosphere.
Source: ANDREYGUDKOV / Getty Images
20. Republic of the Congo
> Total CO2 emissions change 2010-2020: 58.87%
> Total CO2 emissions change 1971-2020: 354.89% — #52 largest increase of 145 countries
> Total CO2 emissions 2020 in million tons: 3.12 — #134 largest of 145 countries
> CO2 emissions per capita change 2010-2019: 58.28% — #14 largest increase of 144 countries
> Total GHG emissions change 2010-2019: 15.48% — #42 largest increase of 88 countries
The production of oil is a pillar of this central African nation’s economy. UUnfortunately, its total CO2 emissions soared more than 354% from 1971 to 2020.
[in-text-ad]
Source: vvvita / Getty Images
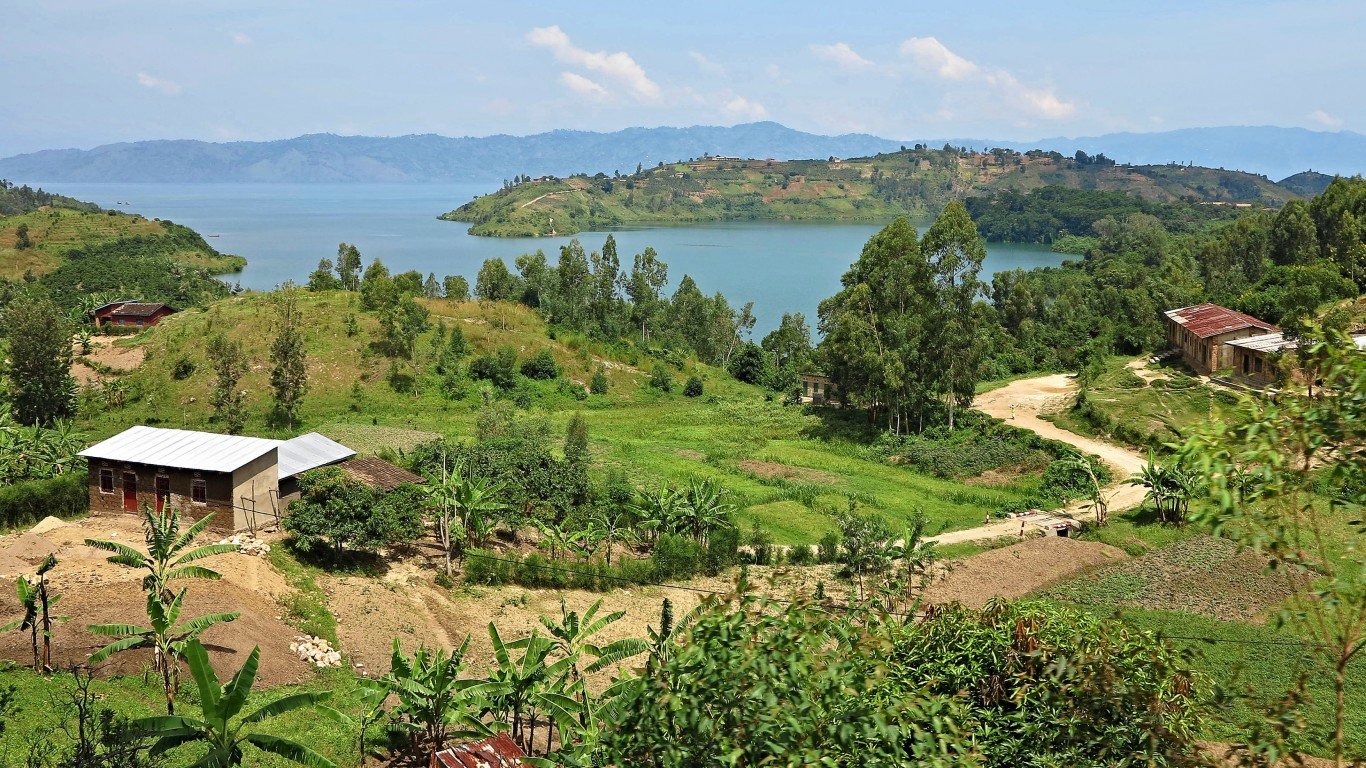
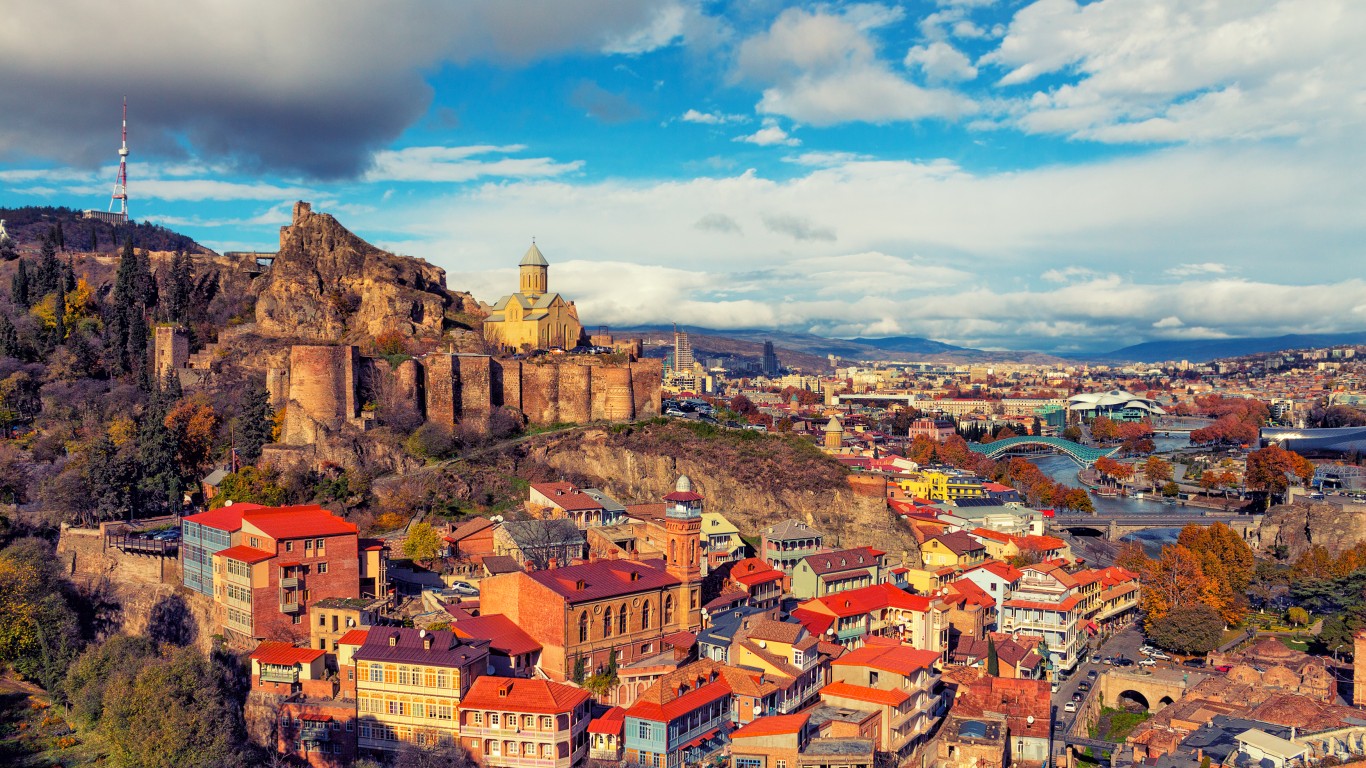
19. Georgia
> Total CO2 emissions change 2010-2020: 60.57%
> Total CO2 emissions change 1971-2020: -2.64% — #29 largest decline of 145 countries
> Total CO2 emissions 2020 in million tons: 9.98 — #107 largest of 145 countries
> CO2 emissions per capita change 2010-2019: 89.84% — #11 largest increase of 144 countries
> Total GHG emissions change 2010-2019: No data
The nation of Georgia is located on the eastern coast of the Black Sea between Russia and Turkey. The country’s energy sector accounts for 71% of emissions. The government provides subsidies for the electricity and gas segments. Georgia’s economy is growing and is considered among the freest in the world, according to the Heritage Foundation’s 2021 Index of Economic Freedom.

Source: danilovi / iStock via Getty Images
18. Sri Lanka
> Total CO2 emissions change 2010-2020: 61.72%
> Total CO2 emissions change 1971-2020: 560.92% — #45 largest increase of 145 countries
> Total CO2 emissions 2020 in million tons: 21.12 — #85 largest of 145 countries
> CO2 emissions per capita change 2010-2019: 70.10% — #12 largest increase of 144 countries
> Total GHG emissions change 2010-2019: No data
This Asian island nation of 21 million people posted the 12th-largest increase in CO2 emissions per capita from 2010 to 2019, or 70%. Based on World Health Organization guidelines, the air quality in Sri Lanka is moderately unsafe. Vehicle emissions, waste burning, and petroleum refining are among the causes of unsafe air quality.
Source: gionnixxx / Getty Images
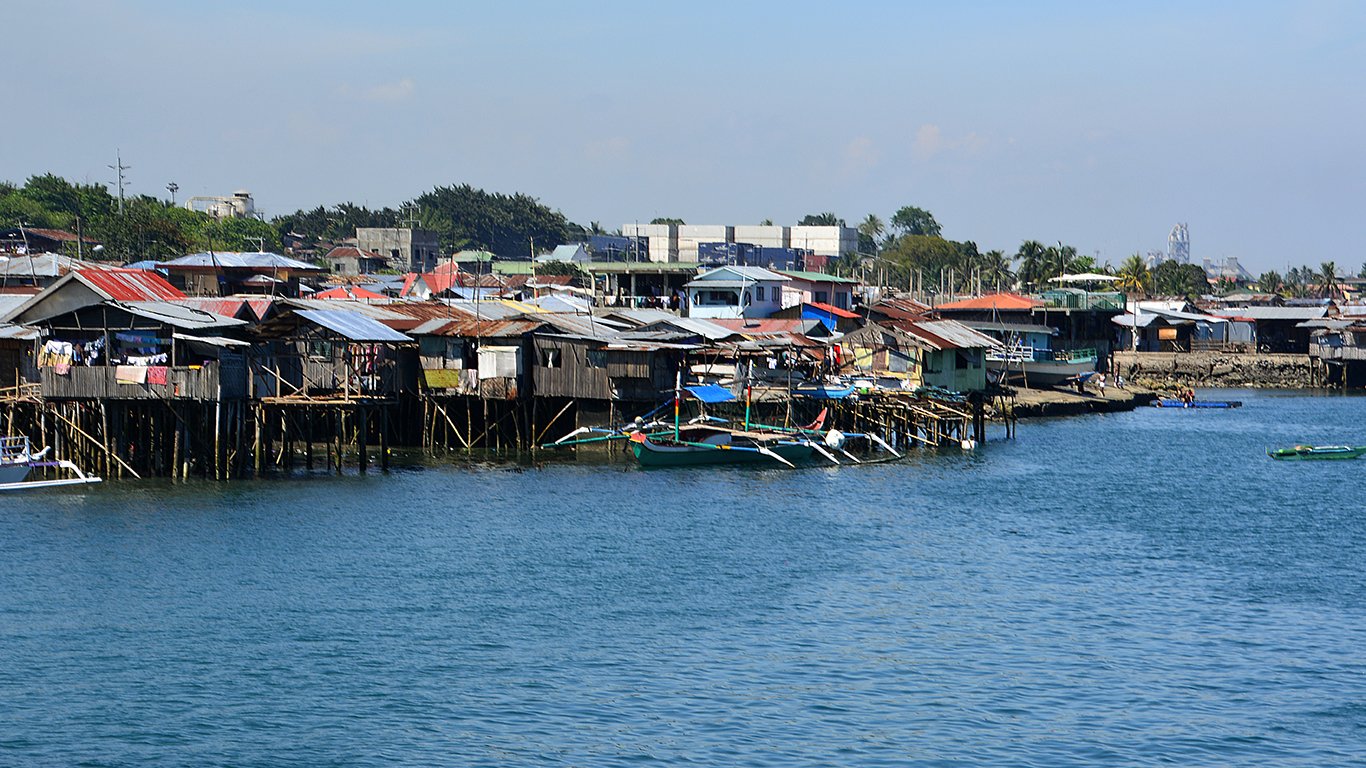
17. Philippines
> Total CO2 emissions change 2010-2020: 63.97%
> Total CO2 emissions change 1971-2020: 393.68% — #49 largest increase of 145 countries
> Total CO2 emissions 2020 in million tons: 136.12 — #35 largest of 145 countries
> CO2 emissions per capita change 2010-2019: 55.21% — #15 largest increase of 144 countries
> Total GHG emissions change 2010-2019: 75.99% — #5 largest increase of 88 countries
The economy of the Asian archipelago increased on average more than 6% from 2015 to 2019 and is one of the most robust economies in Asia. The Philippines also posted the fifth-largest increase in total greenhouse-gas emissions â almost 76% â from 2010 to 2019.
[in-text-ad-2]
Source: aroundtheworld.photography / iStock via Getty Images
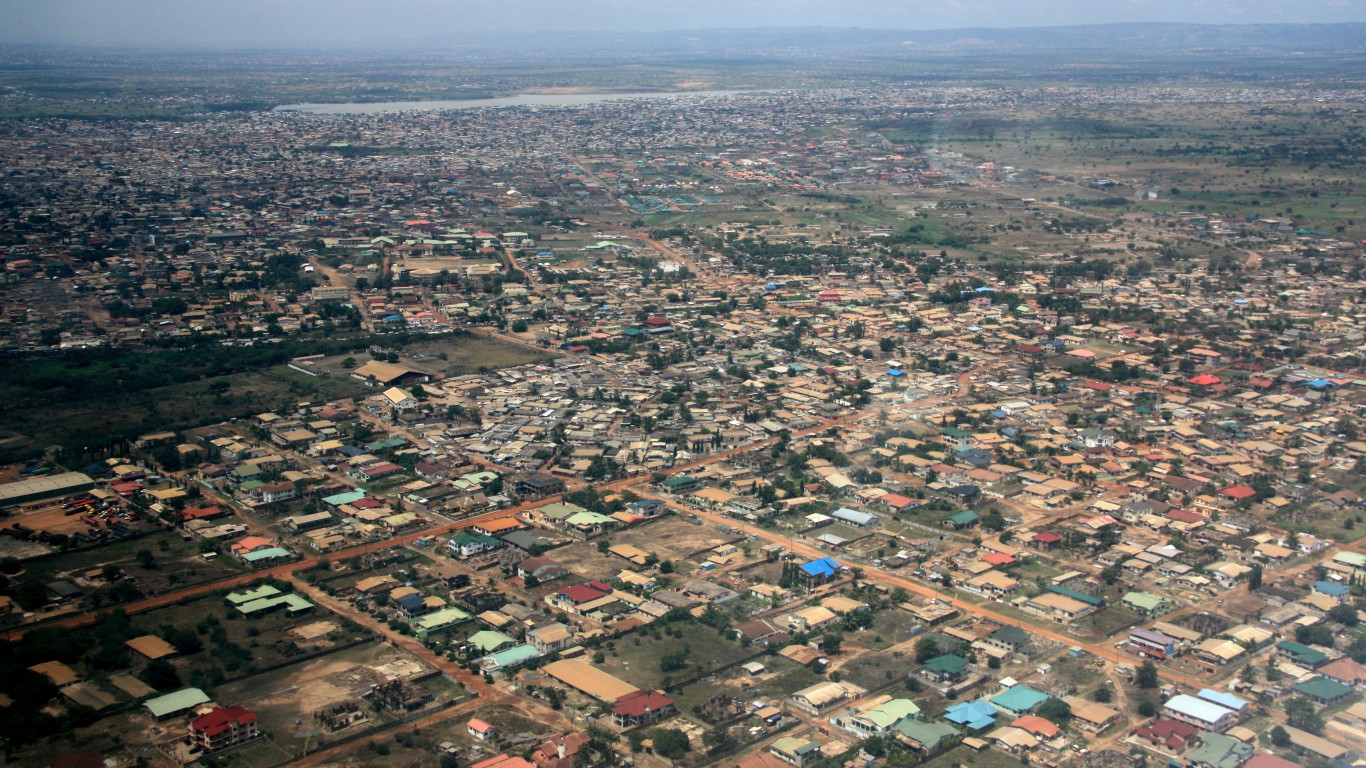
16. Ghana
> Total CO2 emissions change 2010-2020: 64.80%
> Total CO2 emissions change 1971-2020: 598.28% — #41 largest increase of 145 countries
> Total CO2 emissions 2020 in million tons: 16.01 — #93 largest of 145 countries
> CO2 emissions per capita change 2010-2019: 43.17% — #20 largest increase of 144 countries
> Total GHG emissions change 2010-2019: 97.09% — #4 largest increase of 88 countries
Most of this African country’s greenhouse-gas emissions come from land-use change and forestry. Ghana aims to cut emissions 15% by 2030. It had the fourth-largest increase of total emissions from 2010 to 2019, at 97%.
Source: brendanvanson / Getty Images
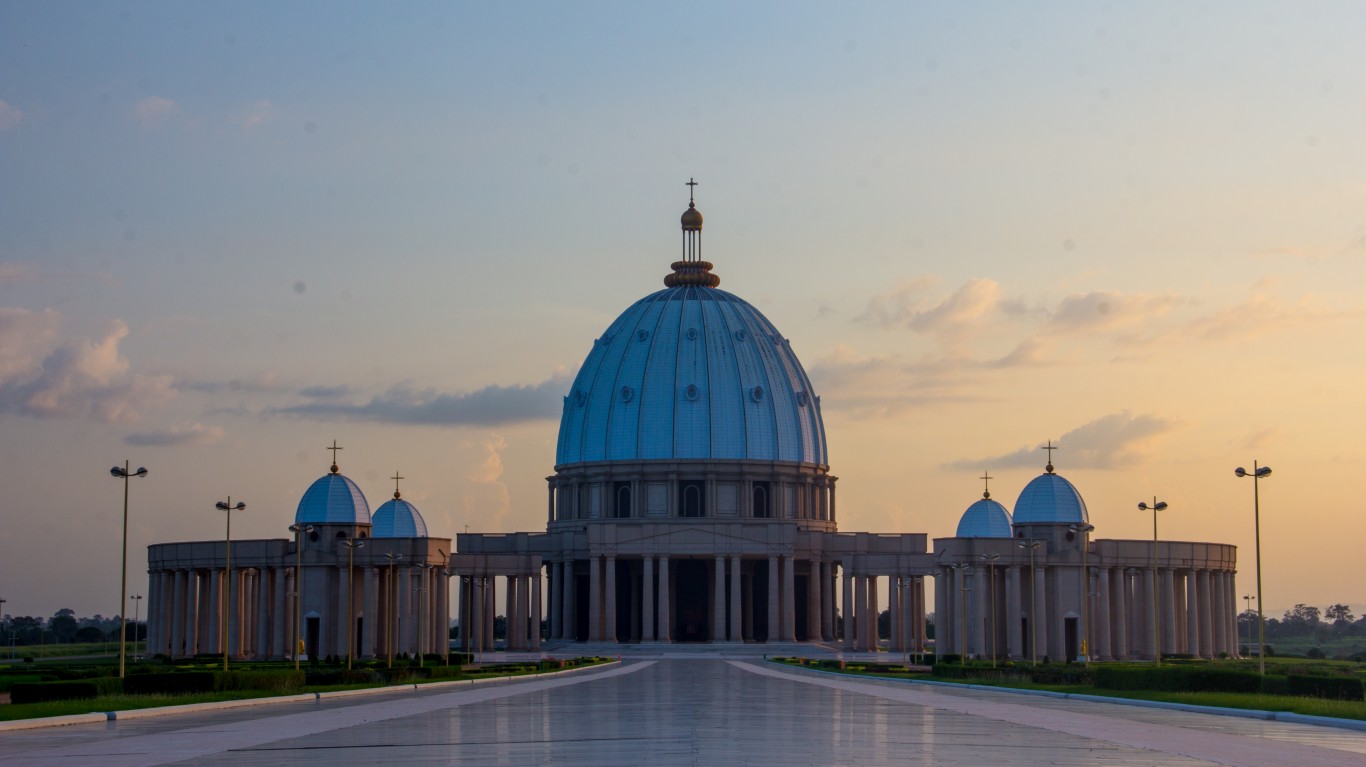
15. Côte d’Ivoire
> Total CO2 emissions change 2010-2020: 66.08%
> Total CO2 emissions change 1971-2020: 310.23% — #59 largest increase of 145 countries
> Total CO2 emissions 2020 in million tons: 10.08 — #106 largest of 145 countries
> CO2 emissions per capita change 2010-2019: 38.41% — #24 largest increase of 144 countries
> Total GHG emissions change 2010-2019: 54.13% — #14 largest increase of 88 countries
Climate change threatens the agricultural sector of Côte d’Ivoire, or Ivory Coast. The nation is a low emitter of greenhouse gases. The West African nation, a signatory to the Paris Agreement in 2015, is embarking on projects that reduce greenhouse-gas emissions in the agriculture sector.
[in-text-ad]
Source: ByronOrtizA / iStock via Getty Images
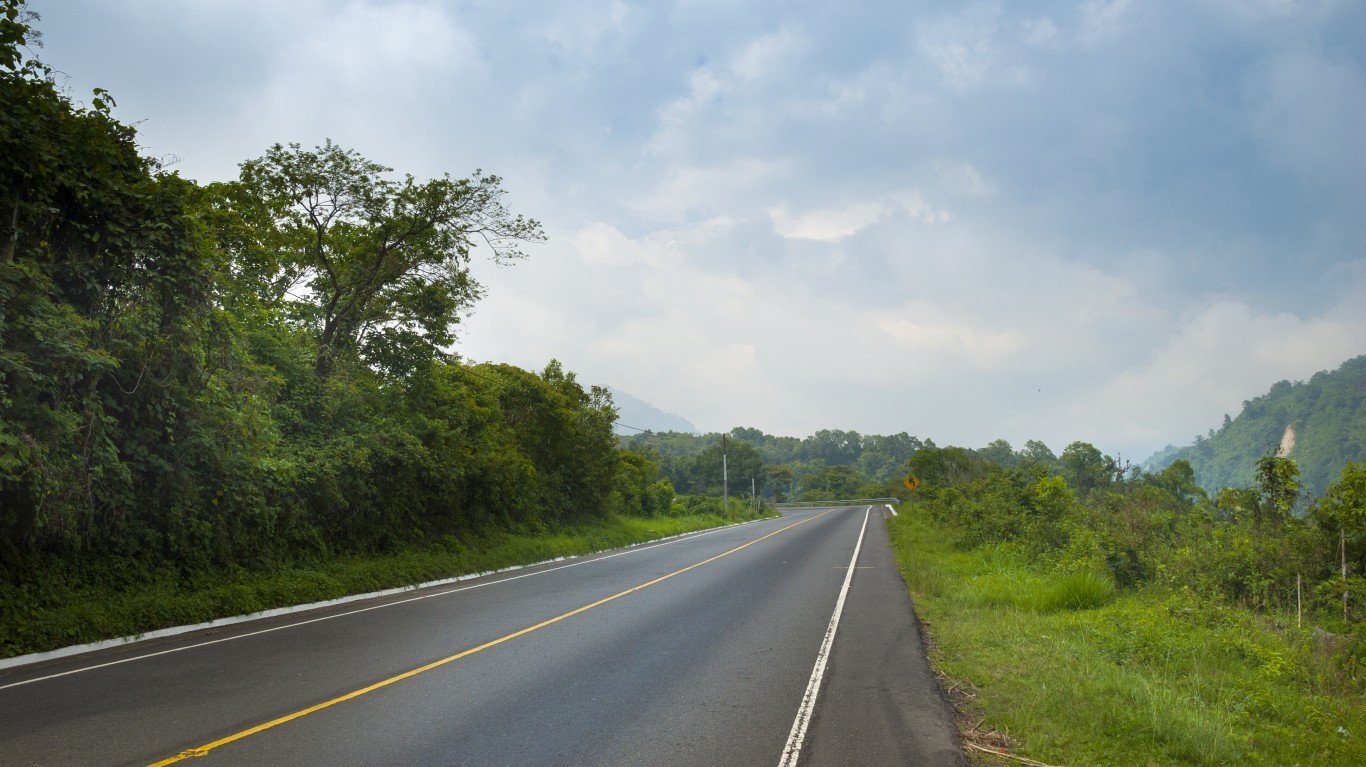
14. Guatemala
> Total CO2 emissions change 2010-2020: 70.65%
> Total CO2 emissions change 1971-2020: 676.37% — #31 largest increase of 145 countries
> Total CO2 emissions 2020 in million tons: 18.95 — #88 largest of 145 countries
> CO2 emissions per capita change 2010-2019: 48.14% — #17 largest increase of 144 countries
> Total GHG emissions change 2010-2019: No data
This Central American nation has vowed to cut greenhouse-gas emissions by11.2% by 2030. Guatemala is the largest economy in Central America and is largely dependent on agriculture. Deforestation contributes to pollution.
Source: nicolasdecorte / iStock via Getty Images
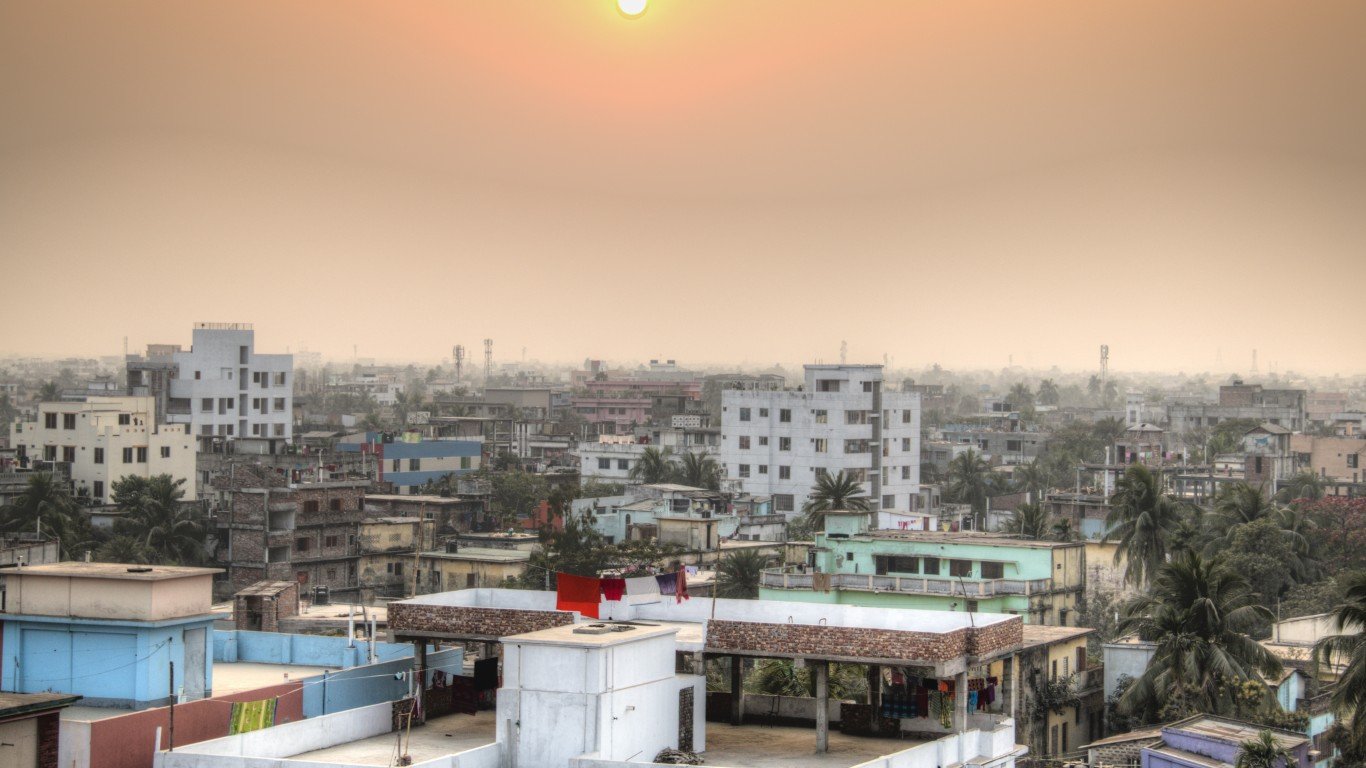
13. Bangladesh
> Total CO2 emissions change 2010-2020: 71.96%
> Total CO2 emissions change 1971-2020: 2,474.76% — #7 largest increase of 145 countries
> Total CO2 emissions 2020 in million tons: 92.91 — #39 largest of 145 countries
> CO2 emissions per capita change 2010-2019: 61.83% — #13 largest increase of 144 countries
> Total GHG emissions change 2010-2019: 69.22% — #8 largest increase of 88 countries
This neighbor of India had the seventh-largest increase â more than 2,400% â of total CO2 emissions from 1971 to 2020, and the eight-biggest total greenhouse-gas emissions, or over 69%, from 2010 to 2019. According to the World Bank, Bangladesh had a faster urbanization rate than South Asia as a whole from 2000 to 2010.

12. Kyrgyzstan
> Total CO2 emissions change 2010-2020: 82.26%
> Total CO2 emissions change 1971-2020: -21.89% — #24 largest decline of 145 countries
> Total CO2 emissions 2020 in million tons: 11.52 — #98 largest of 145 countries
> CO2 emissions per capita change 2010-2019: 29.76% — #30 largest increase of 144 countries
> Total GHG emissions change 2010-2019: No data
The former member of the Soviet Union in Central Asia is becoming urbanized rapidly, at a rate of 2.05% a year. Most of its air pollution is because of increased vehicle traffic. At the Glasgow climate summit, Kyrgyzstan president Sadyr Japarov said the nation would cut greenhouse-gas emissions by 44% by 2030, but a Kyrgyzstan climate center leader said the country would need $10 billion to reach that goal.
[in-text-ad-2]
Source: SamuelBrownNG / iStock via Getty Images
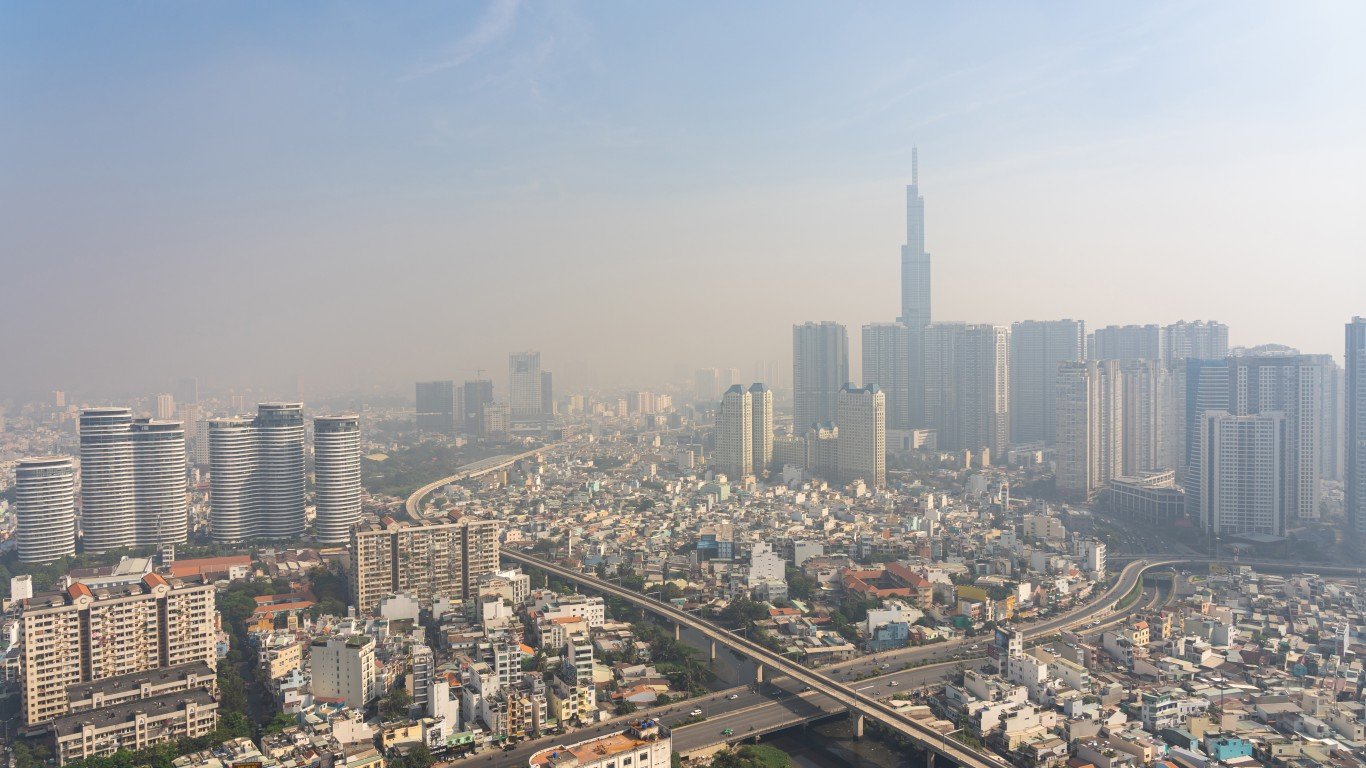
11. Vietnam
> Total CO2 emissions change 2010-2020: 83.50%
> Total CO2 emissions change 1971-2020: 937.82% — #20 largest increase of 145 countries
> Total CO2 emissions 2020 in million tons: 254.49 — #25 largest of 145 countries
> CO2 emissions per capita change 2010-2019: 103.19% — #7 largest increase of 144 countries
> Total GHG emissions change 2010-2019: 105.09% — #3 largest increase of 88 countries
Vietnam has emerged from decades of war to become an economic powerhouse. With that has come increasing urbanization and its attendant problems such as more vehicles and pollution. This Southeast Asian country experienced the third-largest increase in total greenhouse-gas emissions from 2010 to 2019 of any country on the list, more than 105%. It also had a 103% change in CO2 emissions per capita from 2010 to 2019, seventh-highest of any nation.
Source: Phototreat / iStock via Getty Images
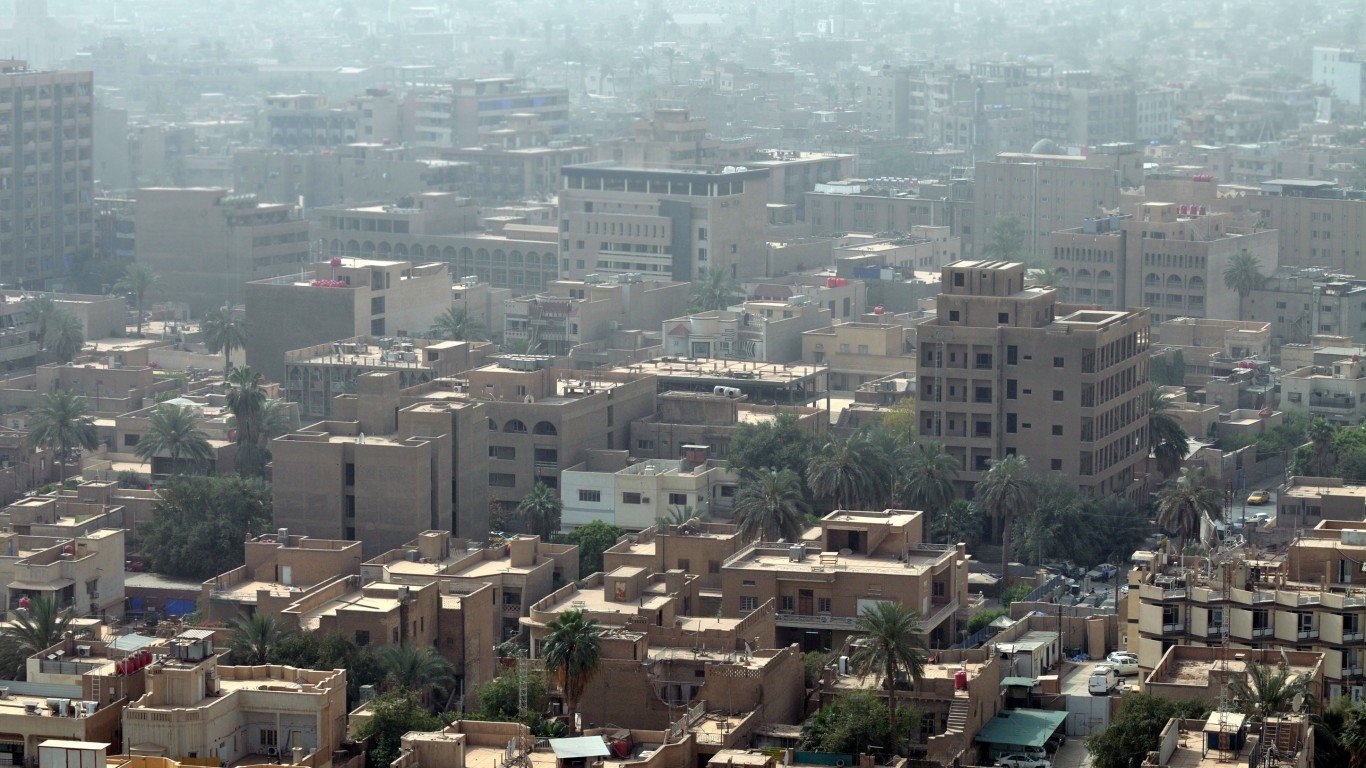
10. Iraq
> Total CO2 emissions change 2010-2020: 91.55%
> Total CO2 emissions change 1971-2020: 631.24% — #36 largest increase of 145 countries
> Total CO2 emissions 2020 in million tons: 210.98 — #29 largest of 145 countries
> CO2 emissions per capita change 2010-2019: 17.24% — #45 largest increase of 144 countries
> Total GHG emissions change 2010-2019: 74.02% — #6 largest increase of 88 countries
Iraq, rebuilding from years of armed conflict, registered the sixth-largest increase of total greenhouse-gas emissions from 2010 to 2019, or 74%. The temperature in Iraq is increasing by seven times the worldwide average, according to data from the Astrophysics Data System that is operated by the Smithsonian Astrophysical Observatory.
[in-text-ad]
Source: Sisoje / Getty Images
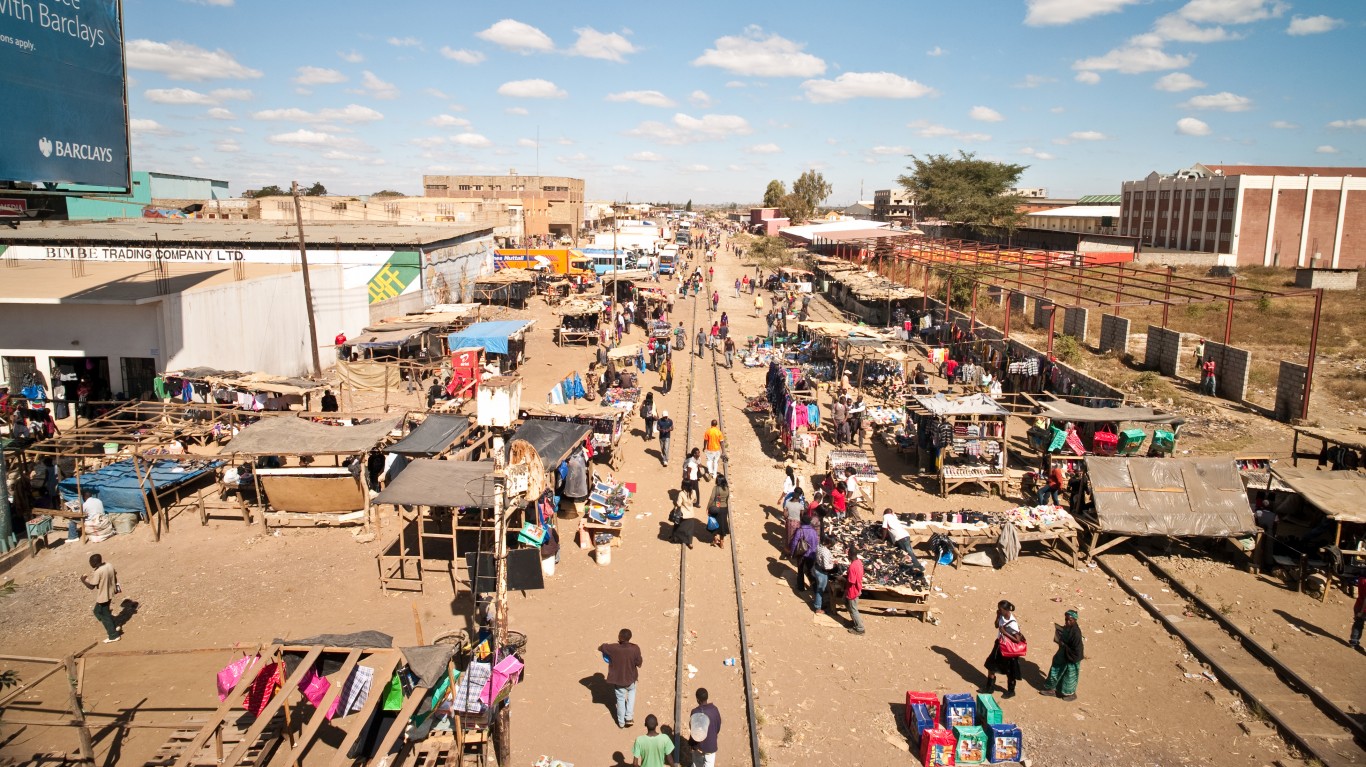
9. Zambia
> Total CO2 emissions change 2010-2020: 110.65%
> Total CO2 emissions change 1971-2020: 73.58% — #88 largest increase of 145 countries
> Total CO2 emissions 2020 in million tons: 6.58 — #120 largest of 145 countries
> CO2 emissions per capita change 2010-2019: 96.93% — #9 largest increase of 144 countries
> Total GHG emissions change 2010-2019: No data
This south-central African nation had the ninth-biggest increase of CO2 emissions per capita from 2010 to 2019, at more than 96%. Deforestation and other land uses are responsible for most of Zambia’s greenhouse-gas emissions. The government has focused on the forestry sector to reduce emissions resulting from forest degradation.
Source: Rudolf Ernst / iStock via Getty Images
8. Ethiopia
> Total CO2 emissions change 2010-2020: 131.42%
> Total CO2 emissions change 1971-2020: 692.92% — #28 largest increase of 145 countries
> Total CO2 emissions 2020 in million tons: 14.68 — #95 largest of 145 countries
> CO2 emissions per capita change 2010-2019: 97.01% — #8 largest increase of 144 countries
> Total GHG emissions change 2010-2019: 70.65% — #7 largest increase of 88 countries
This eastern African nation posted the seventh-largest increase in total greenhouse-gas emission from 2010 to 2019 of any country on the list, more than 70%. Africa’s second-most populous country, it also had the eighth-biggest jump in CO2 emissions per capita from 2010 to 2019 of 97%. A signatory to the Kyoto Protocol on climate change, Ethiopia faces environmental issues including deforestation, desertification, and industrial pollution.
Source: africa924 / iStock Editorial via Getty Images
7. Mozambique
> Total CO2 emissions change 2010-2020: 149.41%
> Total CO2 emissions change 1971-2020: 81.97% — #85 largest increase of 145 countries
> Total CO2 emissions 2020 in million tons: 6.58 — #121 largest of 145 countries
> CO2 emissions per capita change 2010-2019: 118.18% — #6 largest increase of 144 countries
> Total GHG emissions change 2010-2019: 144 countries.36% — #1 largest increase of 88 countries
The African island nation had the biggest increase in total greenhouse-gas emissions over the 2010 to 2019 period out of 144 countries at over 118%. Like many developing nations, Mozambique has experienced migration to urban and coastal areas that have impacted the environment.
[in-text-ad-2]

Source: fulcrumsf / iStock Editorial via Getty Images
6. Myanmar
> Total CO2 emissions change 2010-2020: 177.66%
> Total CO2 emissions change 1971-2020: 612.34% — #39 largest increase of 145 countries
> Total CO2 emissions 2020 in million tons: 36.35 — #66 largest of 145 countries
> CO2 emissions per capita change 2010-2019: 314.01% — #2 largest increase of 144 countries
> Total GHG emissions change 2010-2019: No data
Myanmar, once known as Burma, had the second-biggest increase in CO2 emissions per capita over the 2010 to 2019 period, 144 countries%. It is developing rapidly, leading to deforestation and air and water pollution.
Source: Igor Sokolov / iStock via Getty Images
5. Cambodia
> Total CO2 emissions change 2010-2020: 200.48%
> Total CO2 emissions change 1971-2020: 6,871.26% — #4 largest increase of 145 countries
> Total CO2 emissions 2020 in million tons: 15.34 — #94 largest of 145 countries
> CO2 emissions per capita change 2010-2019: 134.23% — #4 largest increase of 144 countries
> Total GHG emissions change 2010-2019: No data
Cambodia had the fourth-highest increase in total CO2 emissions from 1971 to 2020, more than 6,800%, and the fourth-biggest increase in CO2 emissions per capita from 2010 to 2019. The nation has a “road map” for sustainable development. Like many Asian economies, Cambodia’s is growing rapidly. Its average annual growth rate of 7.7% from 1998 to 2019 makes it among the fastest growing in the world.
[in-text-ad]
Source: jankovoy / iStock via Getty Images
4. Nepal
> Total CO2 emissions change 2010-2020: 251.50%
> Total CO2 emissions change 1971-2020: 8,470.71% — #2 largest increase of 145 countries
> Total CO2 emissions 2020 in million tons: 16.97 — #91 largest of 145 countries
> CO2 emissions per capita change 2010-2019: 128.76% — #5 largest increase of 144 countries
> Total GHG emissions change 2010-2019: No data
The Himalayan nation had the second-highest increase in total CO2 emissions from 1971 to 2020 of any country on the list at more than 8,400%. The nation’s Act of Nepal includes environmental safeguards and imposes penalties on businesses not doing enough to protect the environment. Air pollution has become a serious threat to the storied city of Kathmandu, known for its historic temples.
Source: Gfed / iStock via Getty Images
3. Tajikistan
> Total CO2 emissions change 2010-2020: 272.48%
> Total CO2 emissions change 1971-2020: 10.92% — #107 largest increase of 145 countries
> Total CO2 emissions 2020 in million tons: 9.45 — #110 largest of 145 countries
> CO2 emissions per capita change 2010-2019: 164.38% — #3 largest increase of 144 countries
> Total GHG emissions change 2010-2019: No data
Tajikistan, a landlocked country in Central Asia, posted the third-highest level of CO2 emissions per capita from 2010 to 2019, at more than 164%. Motor vehicles and industry are the main causes of air pollution. Rising exports of precious metals have helped lift the economy.
Source: tanukiphoto / iStock via Getty Images
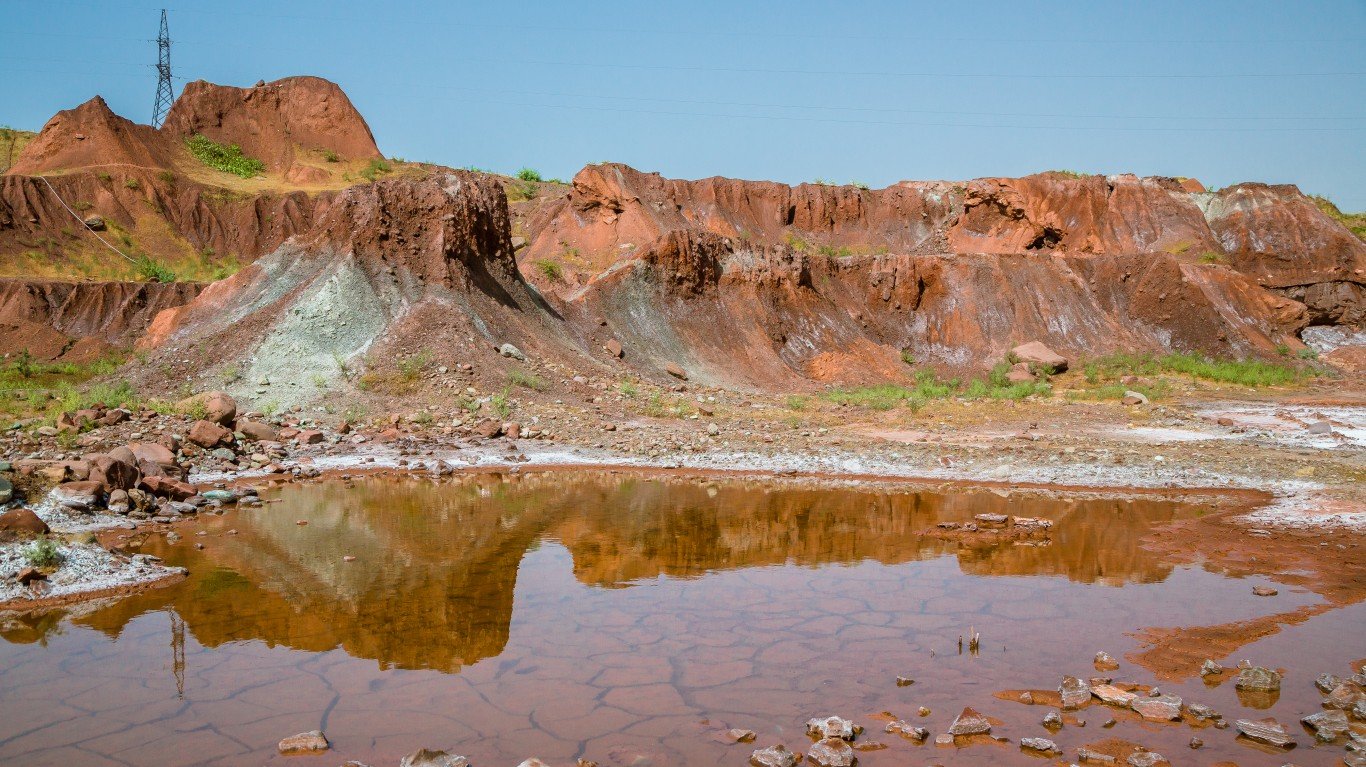
2. Mongolia
> Total CO2 emissions change 2010-2020: 539.96%
> Total CO2 emissions change 1971-2020: 2,816.52% — #6 largest increase of 145 countries
> Total CO2 emissions 2020 in million tons: 88.51 — #42 largest of 145 countries
> CO2 emissions per capita change 2010-2019: 35.17% — #26 largest increase of 144 countries
> Total GHG emissions change 2010-2019: No data
Mongolia had the sixth-largest increase of total CO2 emissions from 1971 to 2020, at more than 2,800%. A rugged, landlocked country between China and Russia, Mongolia has many coal-burning power plants and weak environmental laws. Deforestation and desertification also are environmental issues.
[in-text-ad-2]
Source: fightbegin / iStock via Getty Images
1. Lao People’s Democratic Republic
> Total CO2 emissions change 2010-2020: 1,026.53%
> Total CO2 emissions change 1971-2020: 7,932.76% — #3 largest increase of 145 countries
> Total CO2 emissions 2020 in million tons: 33.87 — #69 largest of 145 countries
> CO2 emissions per capita change 2010-2019: 519.38% — #1 largest increase of 144 countries
> Total GHG emissions change 2010-2019: No data
The Lao People’s Democratic Republic, formerly called Laos, had the largest increase in emissions of any country on the list. It posted the greatest surge in CO2 emissions per capita from 2010-2019, at more than 519%, and the third-largest increase in total CO2 emissions from 1971 to 2020, at more than 7,900%. The country is the only Far Eastern landlocked country and among the most sparsely populated.
Take This Retirement Quiz To Get Matched With A Financial Advisor (Sponsored)
Take the quiz below to get matched with a financial advisor today.
Each advisor has been vetted by SmartAsset and is held to a fiduciary standard to act in your best interests.
Here’s how it works:
1. Answer SmartAsset advisor match quiz
2. Review your pre-screened matches at your leisure. Check out the
advisors’ profiles.
3. Speak with advisors at no cost to you. Have an introductory call on the phone or introduction in person and choose whom to work with in the future
Take the retirement quiz right here.
Thank you for reading! Have some feedback for us?
Contact the 24/7 Wall St. editorial team.
Editors' Picks