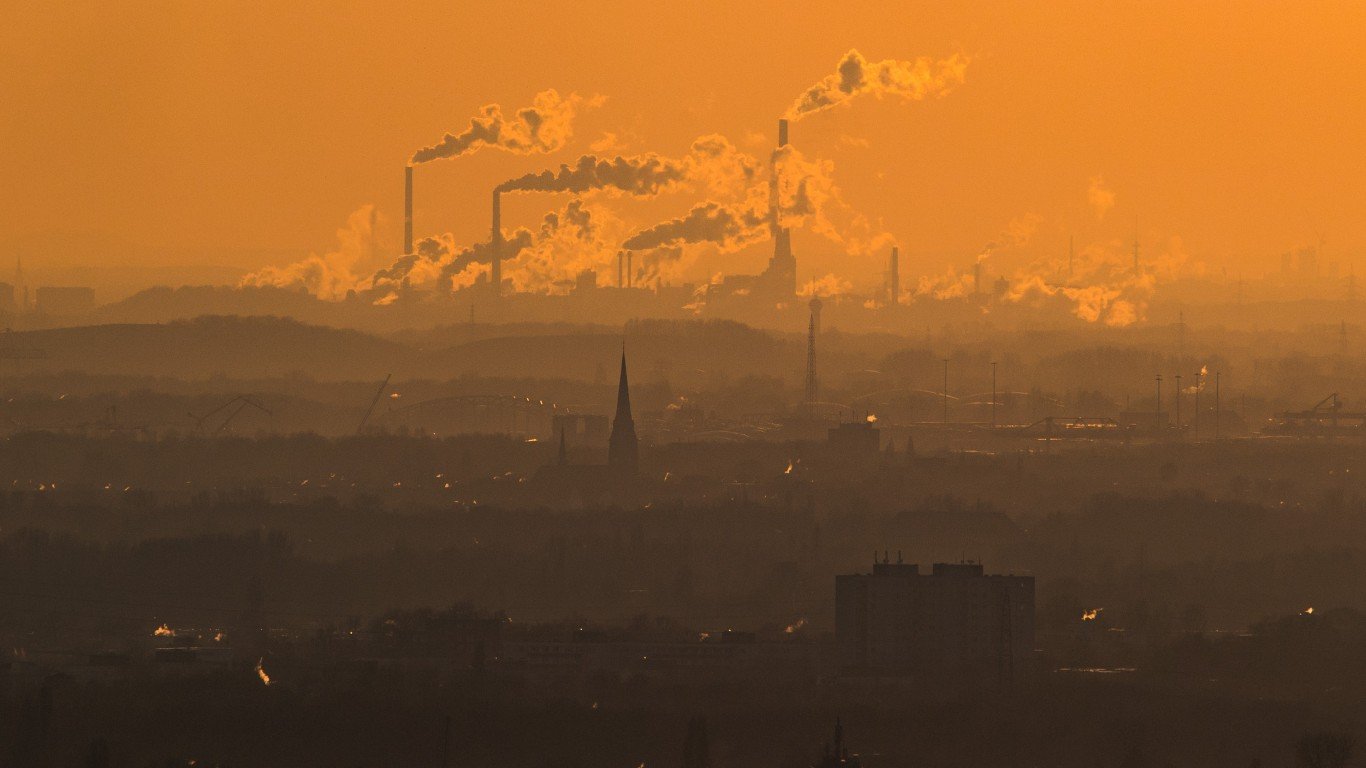
When it comes to the impact certain foods have on the environment, it’s not surprising that meat and dairy products top the list. But you might be surprised that foods we’ve been told are good for us may not necessarily be good for the environment.
To find the foods with the worst environmental impact, 24/7 Wall St. reviewed data from the research article, “Reducing food’s environmental impacts through producers and consumers,” published in Science magazine in 2018. Foods are ranked by greenhouse gas emissions in kilograms of carbon dioxide equivalents per kilogram of food product.
Impacts from food production include water use and water pollution, depletion of natural resources, greenhouse gas emissions, and environmental pollutants.
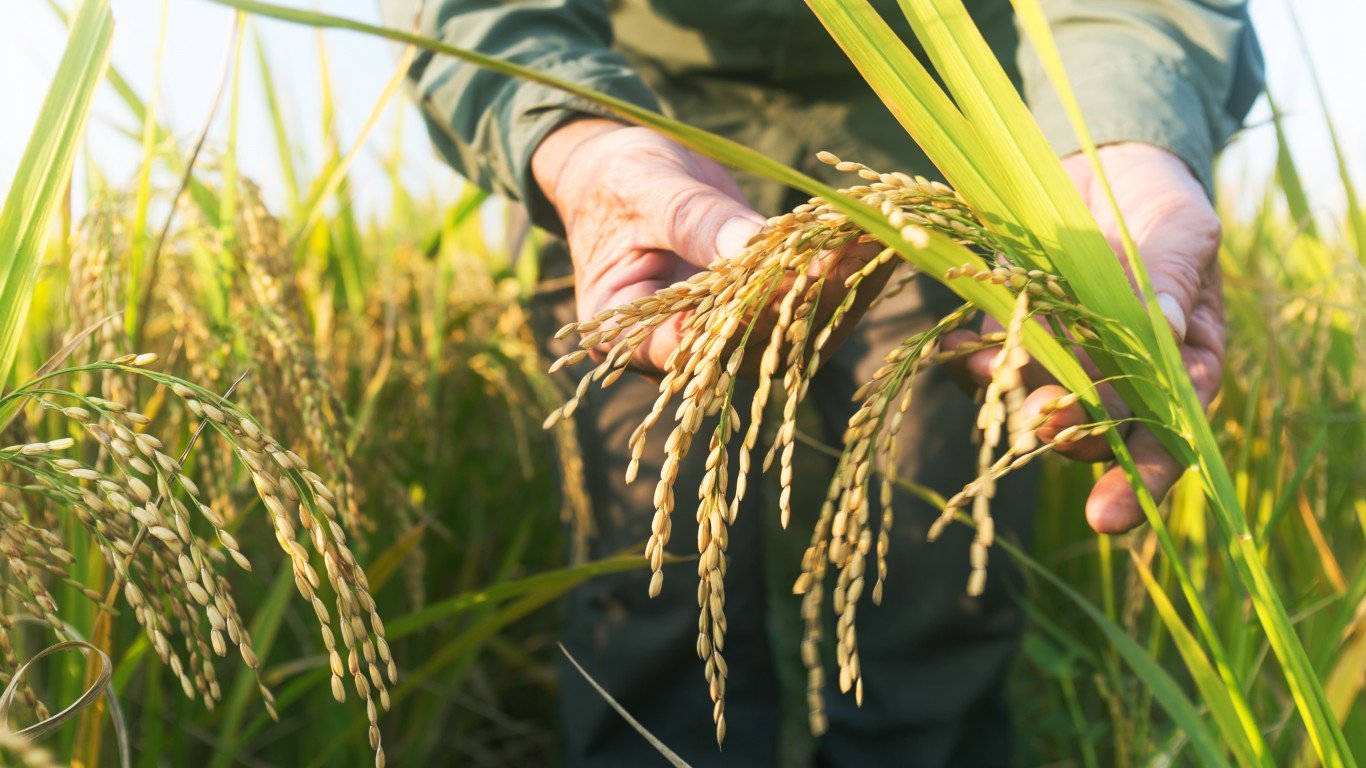
Rice, for example, provides 20% of the world’s calories intake, according to the Food and Agriculture Organization of the United Nations. Brown rice also has certain beneficial nutrients, according to Cleveland Clinic. But rice production generates methane emissions and uses a lot of water during its production. Microbes in flooded rice paddies produce methane, and some of that is emitted into the atmosphere. Per nutritional unit, 1,000 kcal, rice has a much lower environmental impact. (These are the 20 countries responsible for nearly all global emissions.)
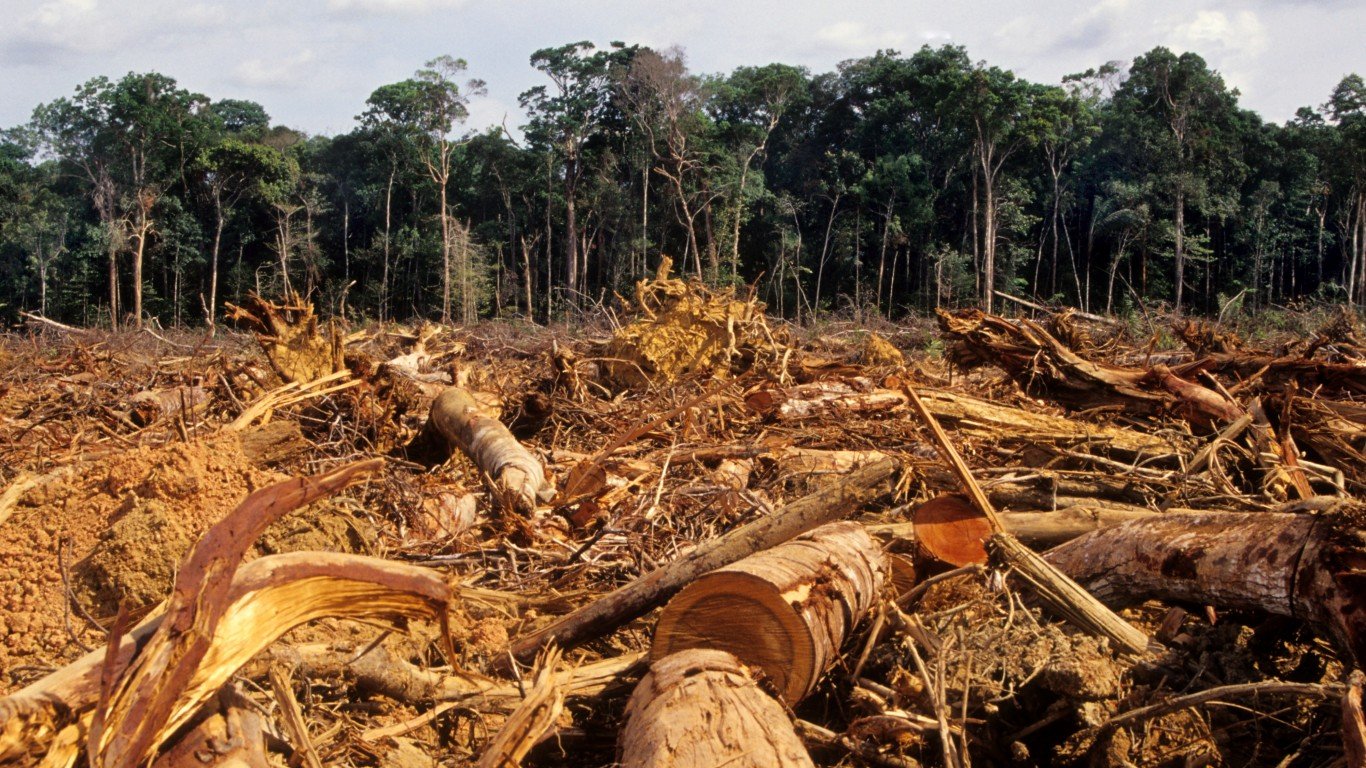
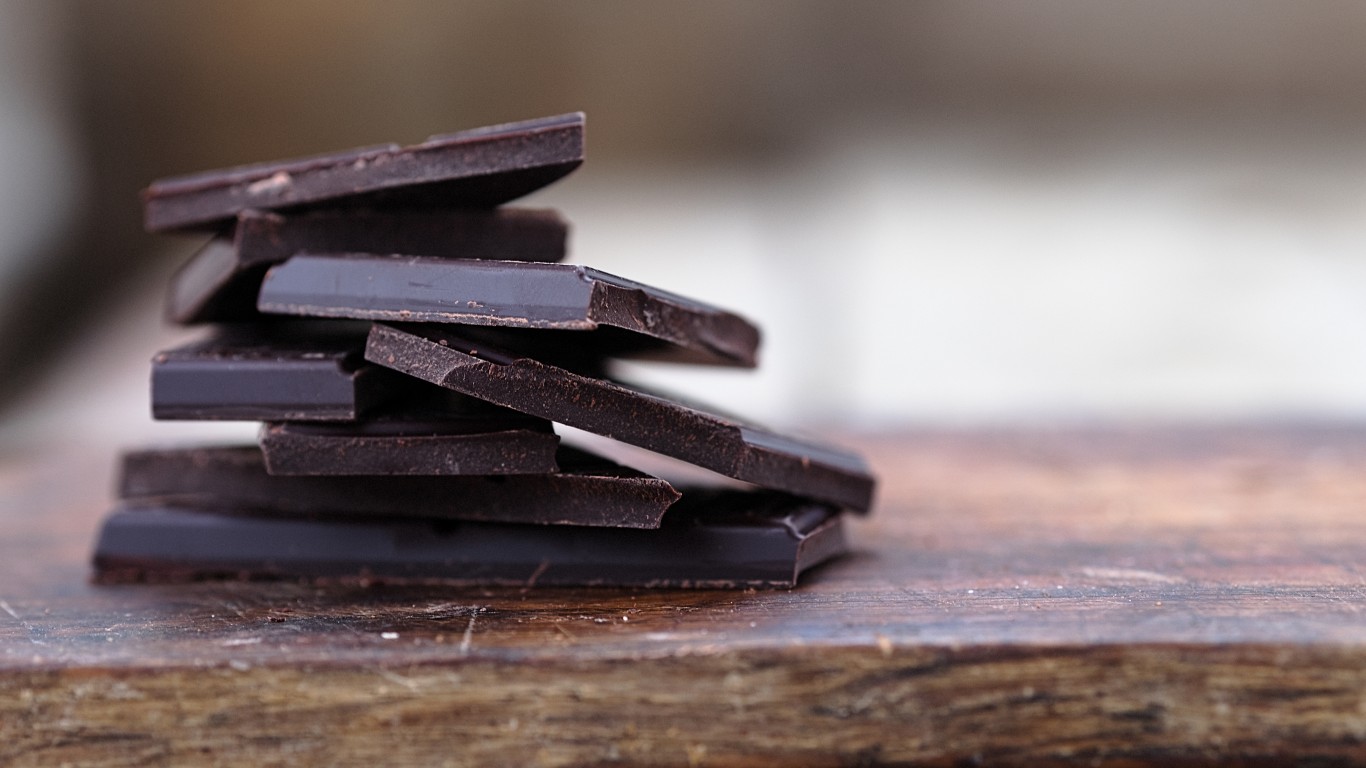
Dark chocolate contains antioxidants, and tofu is a source of iron and calcium. However, the production of both of these products often causes deforestation. According to World Wildlife Magazine, the practice of cocoa farmers clearing tropical forests to plant new cocoa trees rather than reusing the same land in West Africa is responsible for 70% of the country’s illegal deforestation. Dark chocolate ranks second highest on the list for greenhouse gas emissions per 1 kg of food. Tofu ranks 20th.
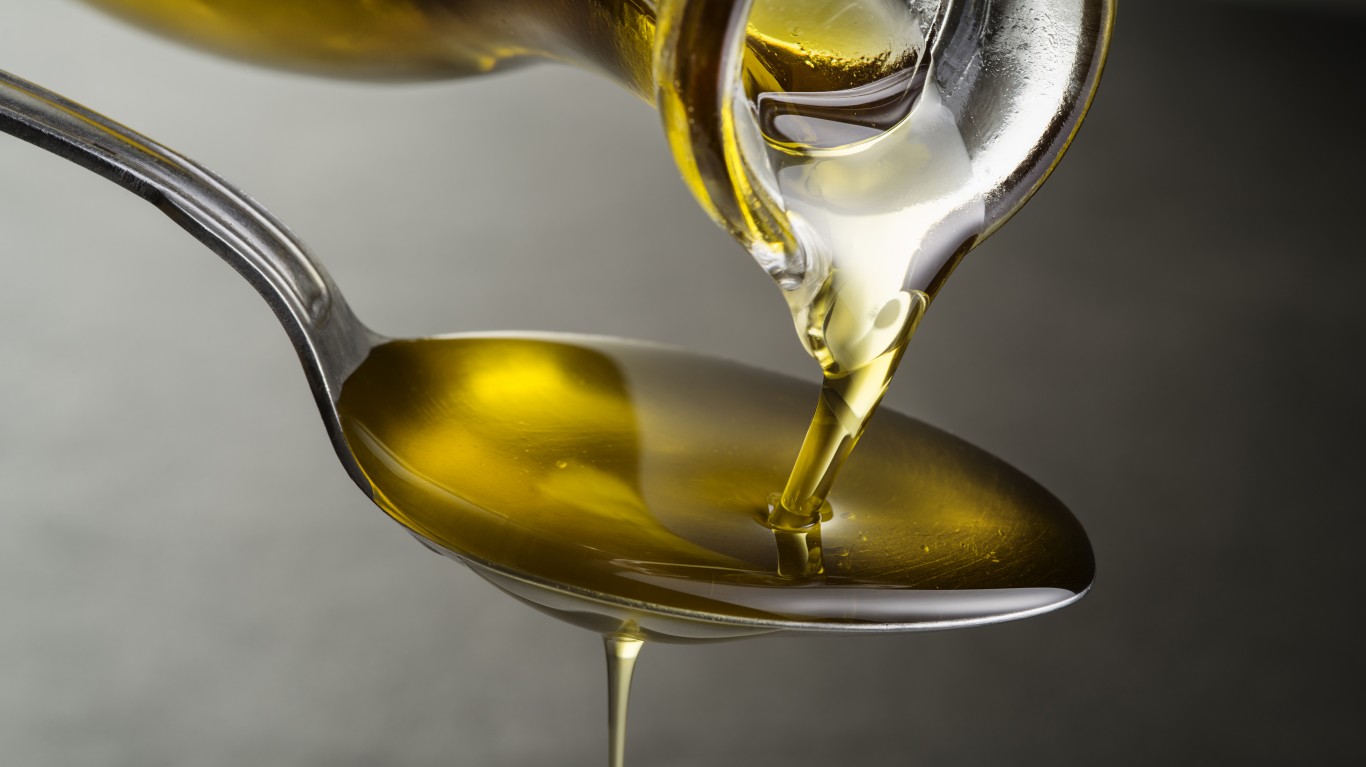
Olive oil is an essential part of the Mediterranean diet and is good for heart health. However, its production can cause negative environmental impacts such as depletion of resources, degradation of land, and waste generation.
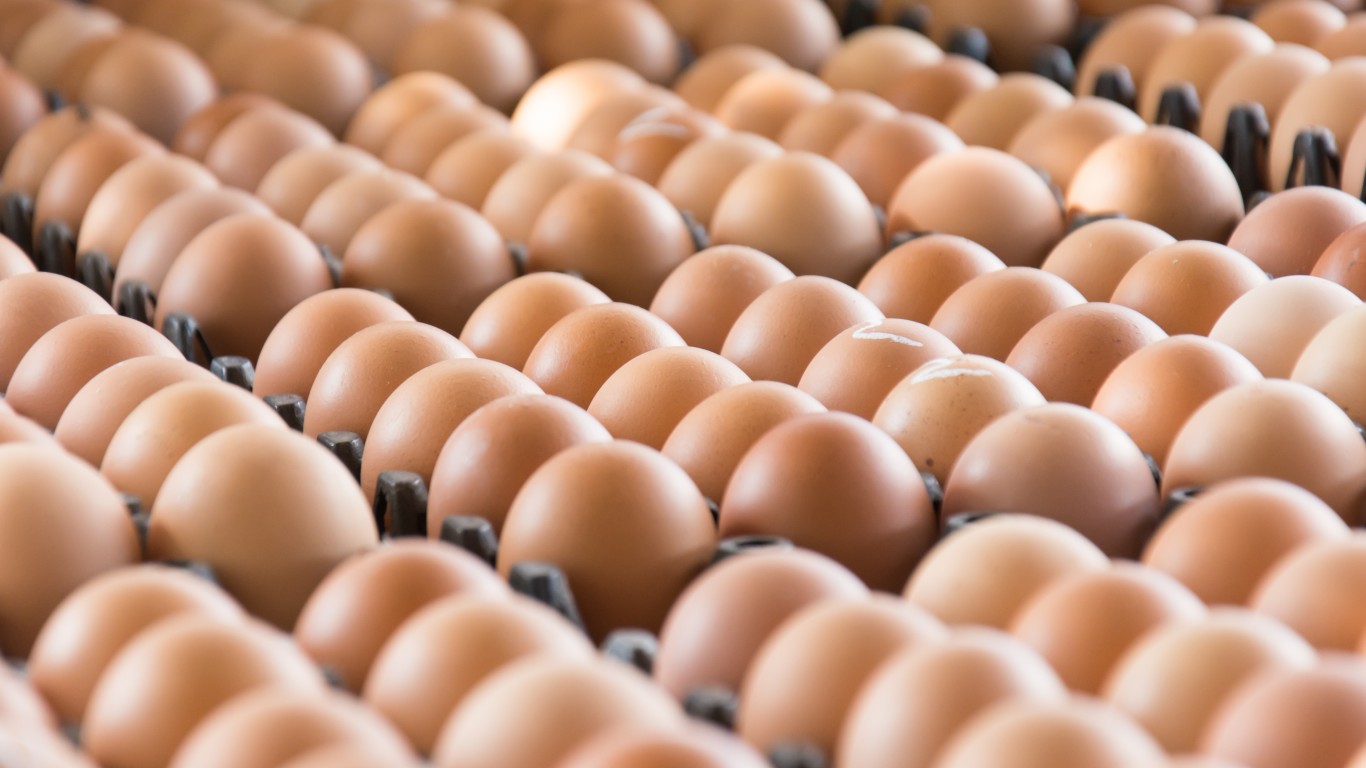
The production of nutrient-rich eggs hurts the environment via the emission of greenhouse gasses and the contamination of soil and water.
Aquaculture, including crustacean and fish farms, have helped address food insecurity in areas where the population is growing rapidly. The negative environmental impacts include nutrient buildup when there is concentration of fish in one area. This can lead to excessive levels of fish waste that deplete the water of oxygen, creating algae blooms. (Another pollutant of water is plastic. These are plastic waste generation values across countries.)
Click here to see the foods with the worst environmental impact
Click here to read our detailed methodology
Source: oticki / iStock via Getty Images
20. Tofu
> GHG emissions in kg of CO2 equivalents per 1 kg of food: 3.2
> GHG emissions in kg of CO2 equivalents per nutritional unit: 2.0 per 100 g protein (19th highest)
> Land use in sq meters per 1 kg of food: 3.5 (16th lowest)
> Freshwater withdrawal in liters per 1 kg of food: 148.6 (14th lowest)
[in-text-ad]
Source: Kosal Hor / iStock via Getty Images
19. Cane Sugar
> GHG emissions in kg of CO2 equivalents per 1 kg of food: 3.2
> GHG emissions in kg of CO2 equivalents per nutritional unit: 3.2 per 1 kg (15th highest)
> Land use in sq meters per 1 kg of food: 2.0 (15th lowest)
> Freshwater withdrawal in liters per 1 kg of food: 620.1 (16th highest)

18. Groundnuts
> GHG emissions in kg of CO2 equivalents per 1 kg of food: 3.2
> GHG emissions in kg of CO2 equivalents per nutritional unit: 1.2 per 100 g protein (21st lowest)
> Land use in sq meters per 1 kg of food: 9.1 (15th highest)
> Freshwater withdrawal in liters per 1 kg of food: 1,852.3 (8th highest)
Source: dulezidar / iStock via Getty Images
17. Sunflower Oil
> GHG emissions in kg of CO2 equivalents per 1 kg of food: 3.6
> GHG emissions in kg of CO2 equivalents per nutritional unit: 3.6 per 1 liter refined/filtered (14th highest)
> Land use in sq meters per 1 kg of food: 17.7 (8th highest)
> Freshwater withdrawal in liters per 1 kg of food: 1,007.9 (12th highest)
[in-text-ad-2]
Source: catolla / Getty Images
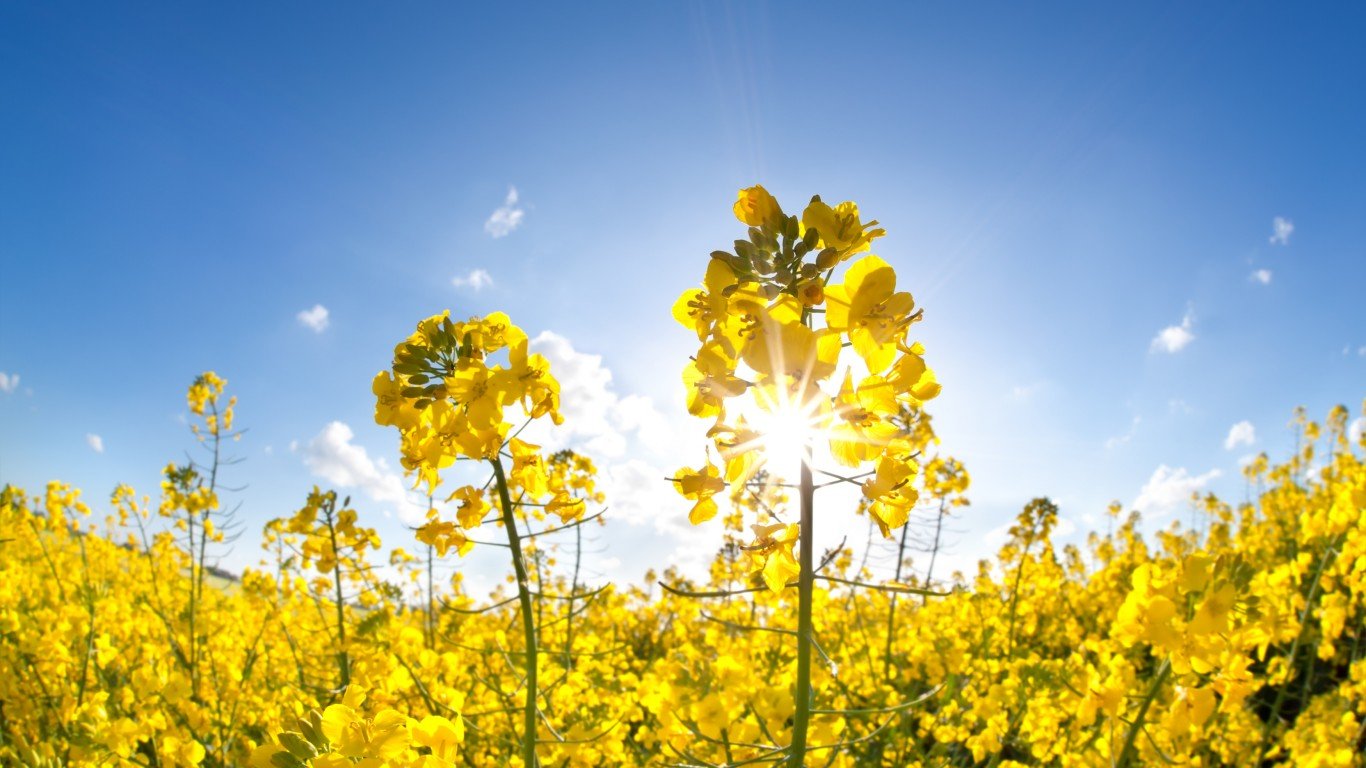
16. Rapeseed Oil
> GHG emissions in kg of CO2 equivalents per 1 kg of food: 3.8
> GHG emissions in kg of CO2 equivalents per nutritional unit: 3.8 per 1 liter refined/filtered (13th highest)
> Land use in sq meters per 1 kg of food: 10.6 (13th highest)
> Freshwater withdrawal in liters per 1 kg of food: 237.7 (19th lowest)
Source: jxfzsy / E+ via Getty Images
15. Rice
> GHG emissions in kg of CO2 equivalents per 1 kg of food: 4.5
> GHG emissions in kg of CO2 equivalents per nutritional unit: 1.2 per 1000 kcal (20th lowest)
> Land use in sq meters per 1 kg of food: 2.8 (20th lowest)
> Freshwater withdrawal in liters per 1 kg of food: 2,248.4 (6th highest)
[in-text-ad]
Source: Tevarak / iStock via Getty Images
14. Eggs
> GHG emissions in kg of CO2 equivalents per 1 kg of food: 4.7
> GHG emissions in kg of CO2 equivalents per nutritional unit: 4.2 per 100 g protein (12th highest)
> Land use in sq meters per 1 kg of food: 6.3 (20th highest)
> Freshwater withdrawal in liters per 1 kg of food: 577.7 (17th highest)
 24/7 Wall St.
Source: Mindaugas Dulinskas / iStock via Getty Images
13. Olive Oil
> GHG emissions in kg of CO2 equivalents per 1 kg of food: 5.4
> GHG emissions in kg of CO2 equivalents per nutritional unit: 5.4 per 1 liter refined/filtered (11th highest)
> Land use in sq meters per 1 kg of food: 26.3 (6th highest)
> Freshwater withdrawal in liters per 1 kg of food: 2,141.8 (7th highest)
Source: inewsistock / iStock via Getty Images
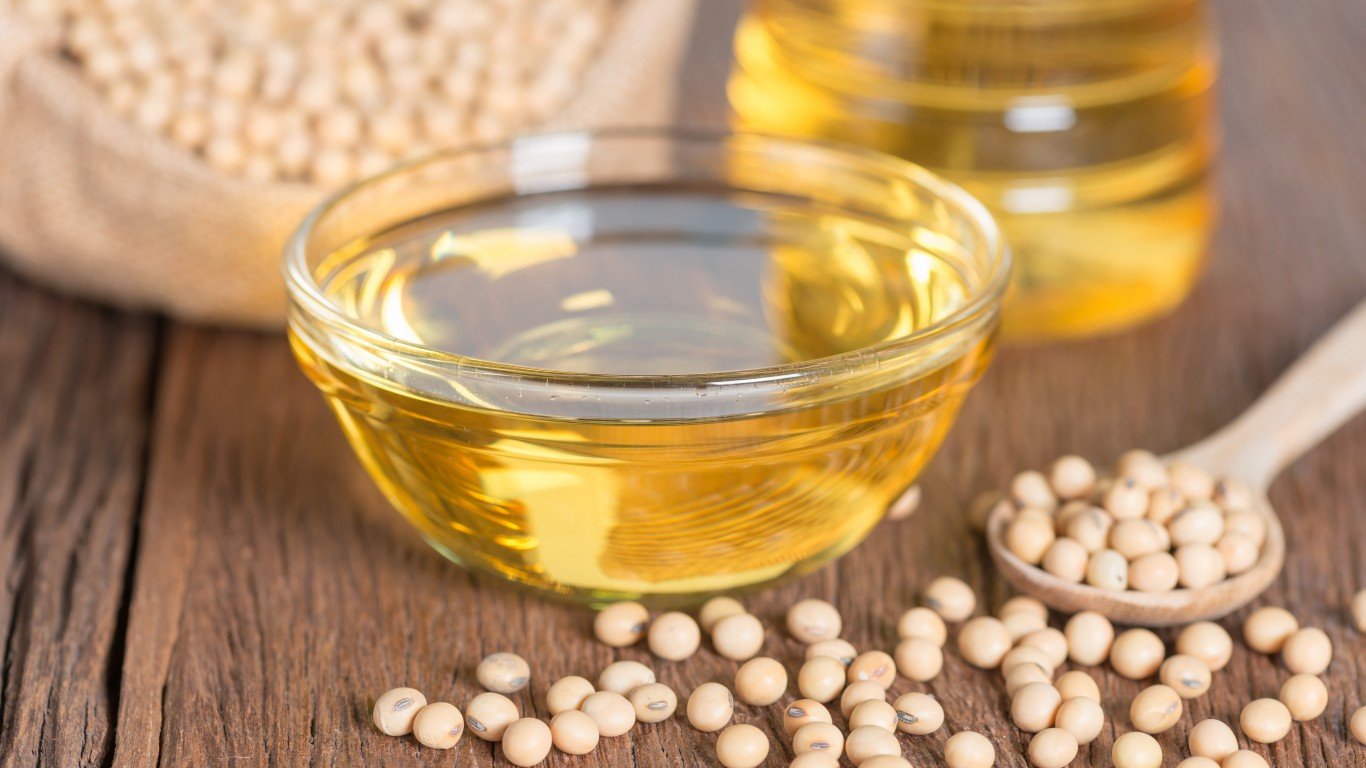
12. Soybean Oil
> GHG emissions in kg of CO2 equivalents per 1 kg of food: 6.3
> GHG emissions in kg of CO2 equivalents per nutritional unit: 6.3 per 1 liter refined/filtered (8th highest)
> Land use in sq meters per 1 kg of food: 10.5 (14th highest)
> Freshwater withdrawal in liters per 1 kg of food: 414.6 (22nd lowest)
[in-text-ad-2]
Source: whyframestudio / Getty Images
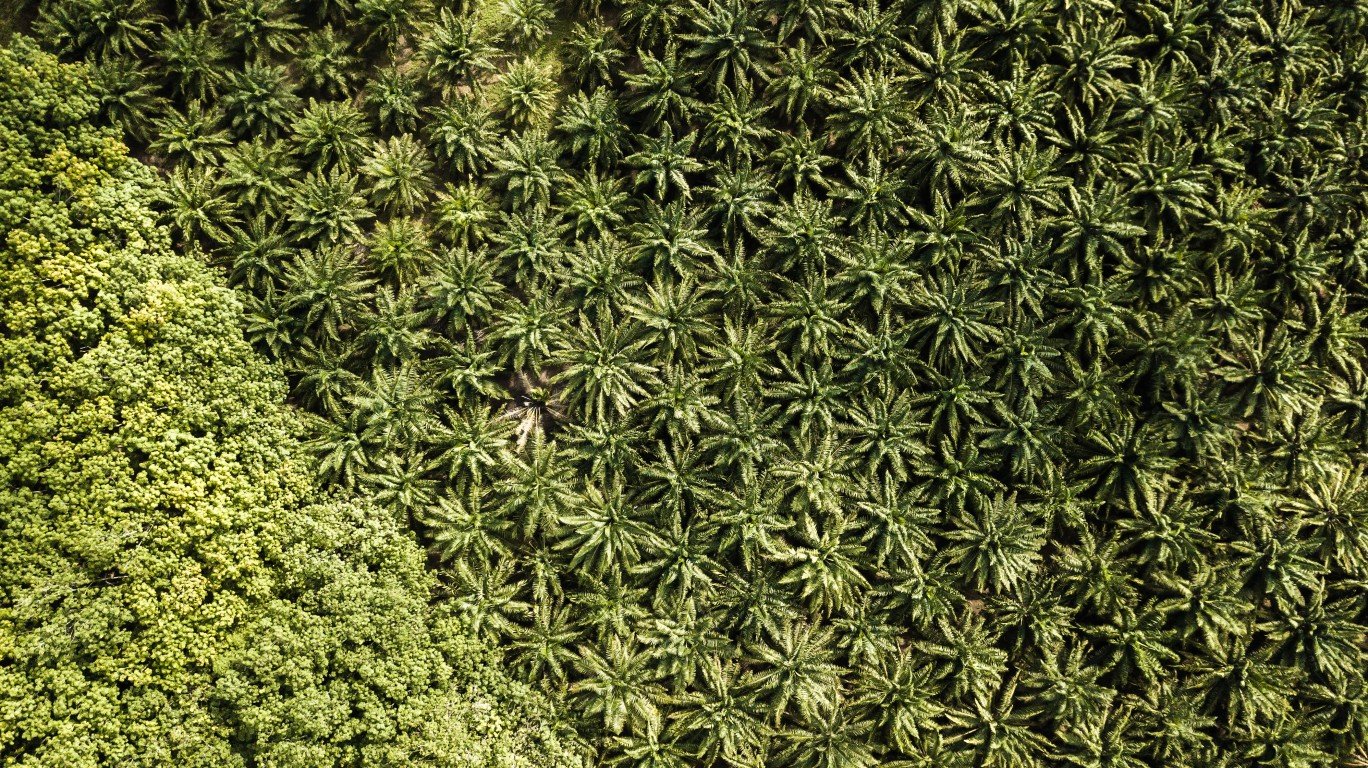
11. Palm Oil
> GHG emissions in kg of CO2 equivalents per 1 kg of food: 7.3
> GHG emissions in kg of CO2 equivalents per nutritional unit: 7.3 per 1 liter refined/filtered (7th highest)
> Land use in sq meters per 1 kg of food: 2.4 (12th lowest)
> Freshwater withdrawal in liters per 1 kg of food: 6.4 (2nd lowest)
Source: wikoski / iStock via Getty Images
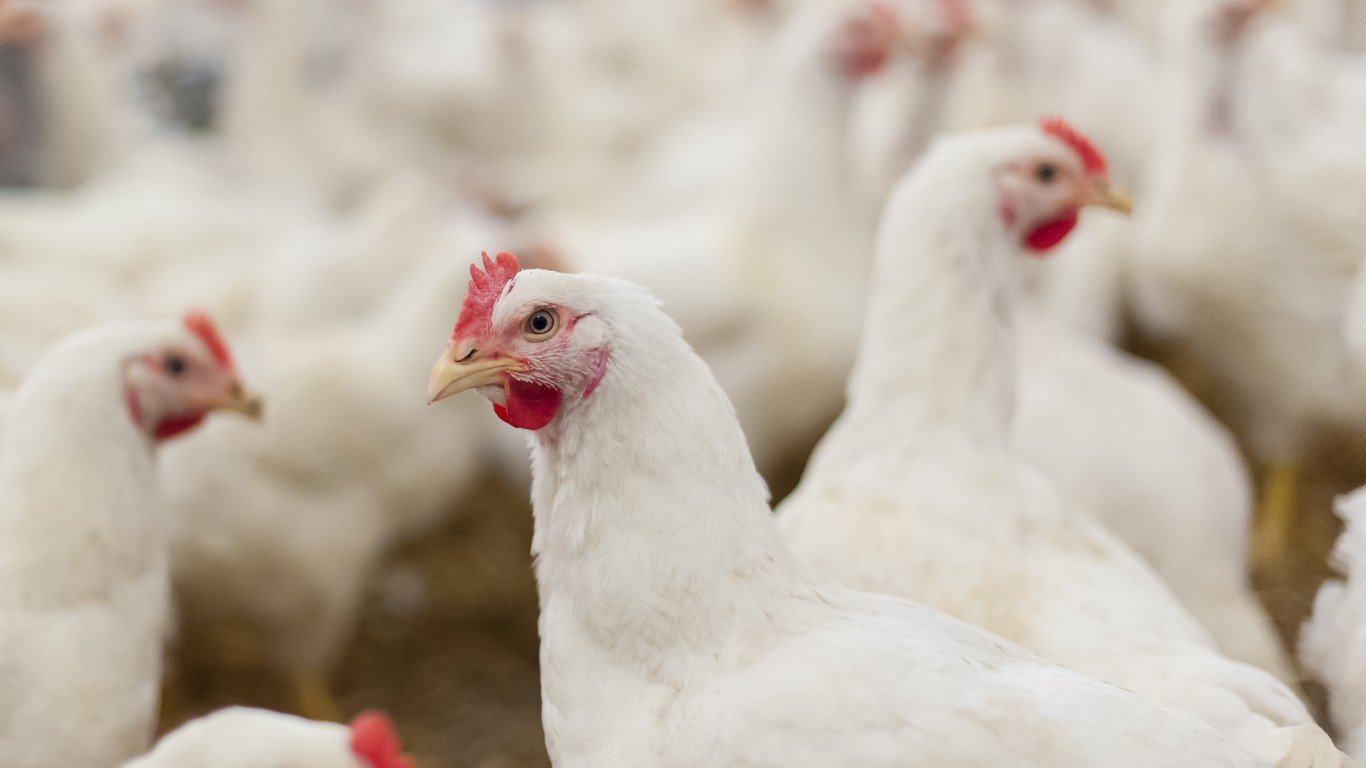
10. Poultry Meat
> GHG emissions in kg of CO2 equivalents per 1 kg of food: 9.9
> GHG emissions in kg of CO2 equivalents per nutritional unit: 5.7 per 100 g protein (10th highest)
> Land use in sq meters per 1 kg of food: 12.2 (12th highest)
> Freshwater withdrawal in liters per 1 kg of food: 660.0 (13th highest)
[in-text-ad]
Source: Odairson Antonello / iStock via Getty Images
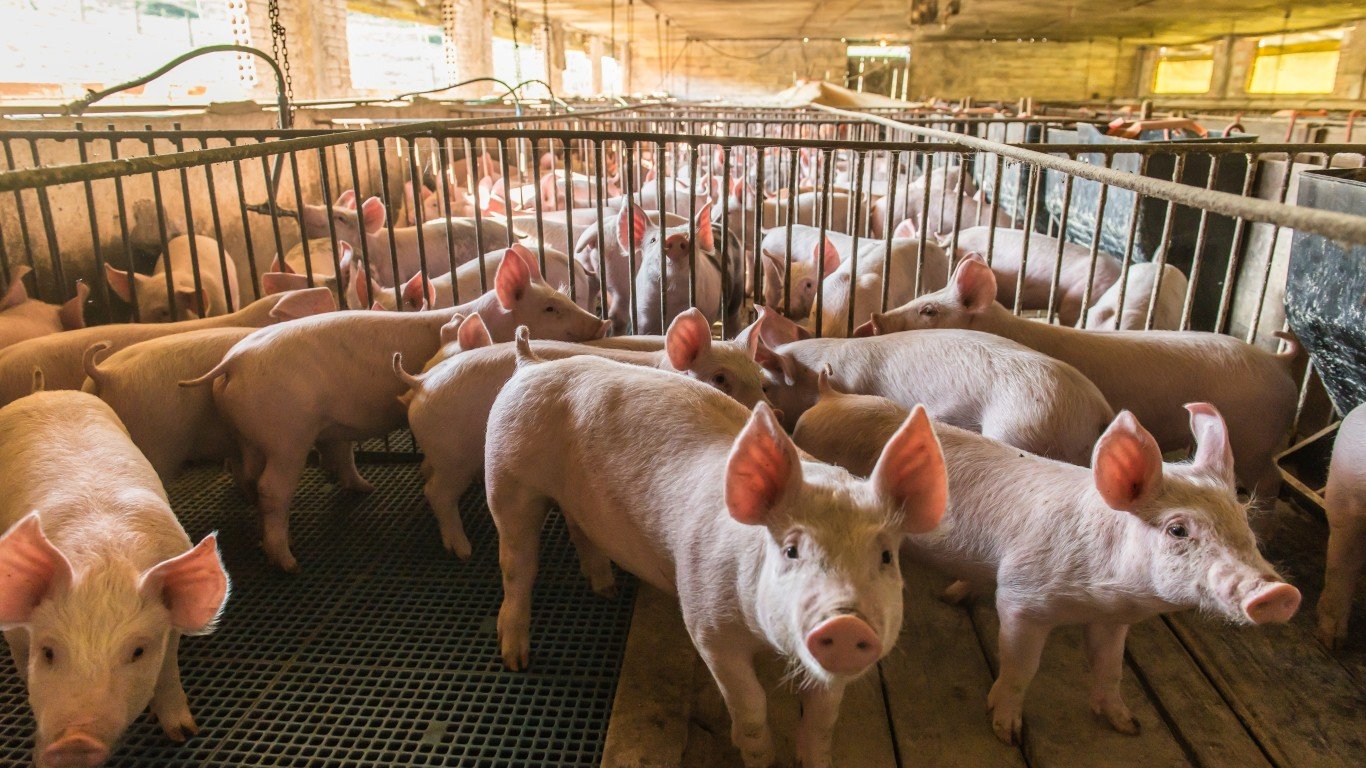
9. Pig Meat
> GHG emissions in kg of CO2 equivalents per 1 kg of food: 12.3
> GHG emissions in kg of CO2 equivalents per nutritional unit: 7.6 per 100 g protein (6th highest)
> Land use in sq meters per 1 kg of food: 17.4 (9th highest)
> Freshwater withdrawal in liters per 1 kg of food: 1,795.8 (10th highest)
 24/7 Wall St.
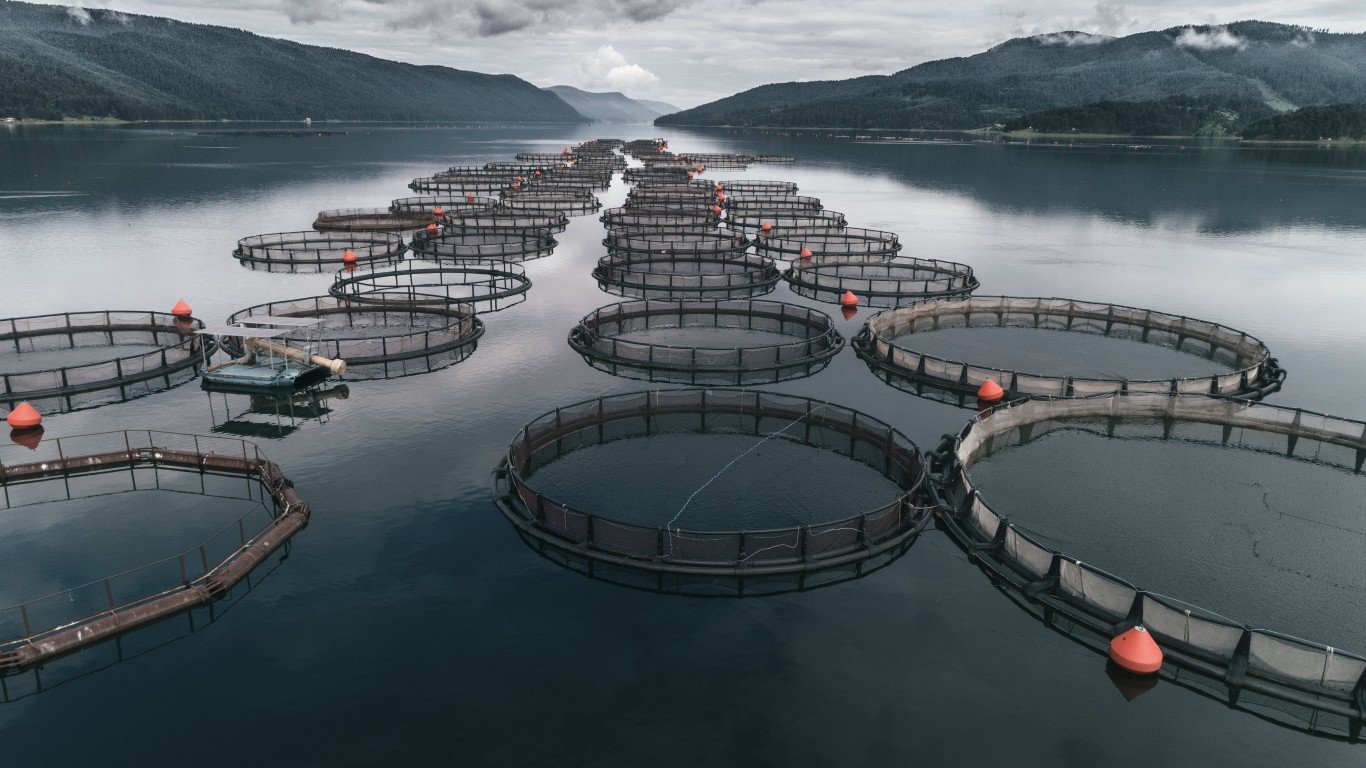
Source: Daniel Balakov / E+ via Getty Images
8. Fish (farmed)
> GHG emissions in kg of CO2 equivalents per 1 kg of food: 13.6
> GHG emissions in kg of CO2 equivalents per nutritional unit: 6.0 per 100 g protein (9th highest)
> Land use in sq meters per 1 kg of food: 8.4 (17th highest)
> Freshwater withdrawal in liters per 1 kg of food: 3,691.3 (3rd highest)

Source: 20fifteen / iStock via Getty Images
7. Cheese
> GHG emissions in kg of CO2 equivalents per 1 kg of food: 23.9
> GHG emissions in kg of CO2 equivalents per nutritional unit: 10.8 per 100 g protein (5th highest)
> Land use in sq meters per 1 kg of food: 87.8 (3rd highest)
> Freshwater withdrawal in liters per 1 kg of food: 5,605.2 (the highest)
[in-text-ad-2]
Source: WoodysPhotos / iStock via Getty Images
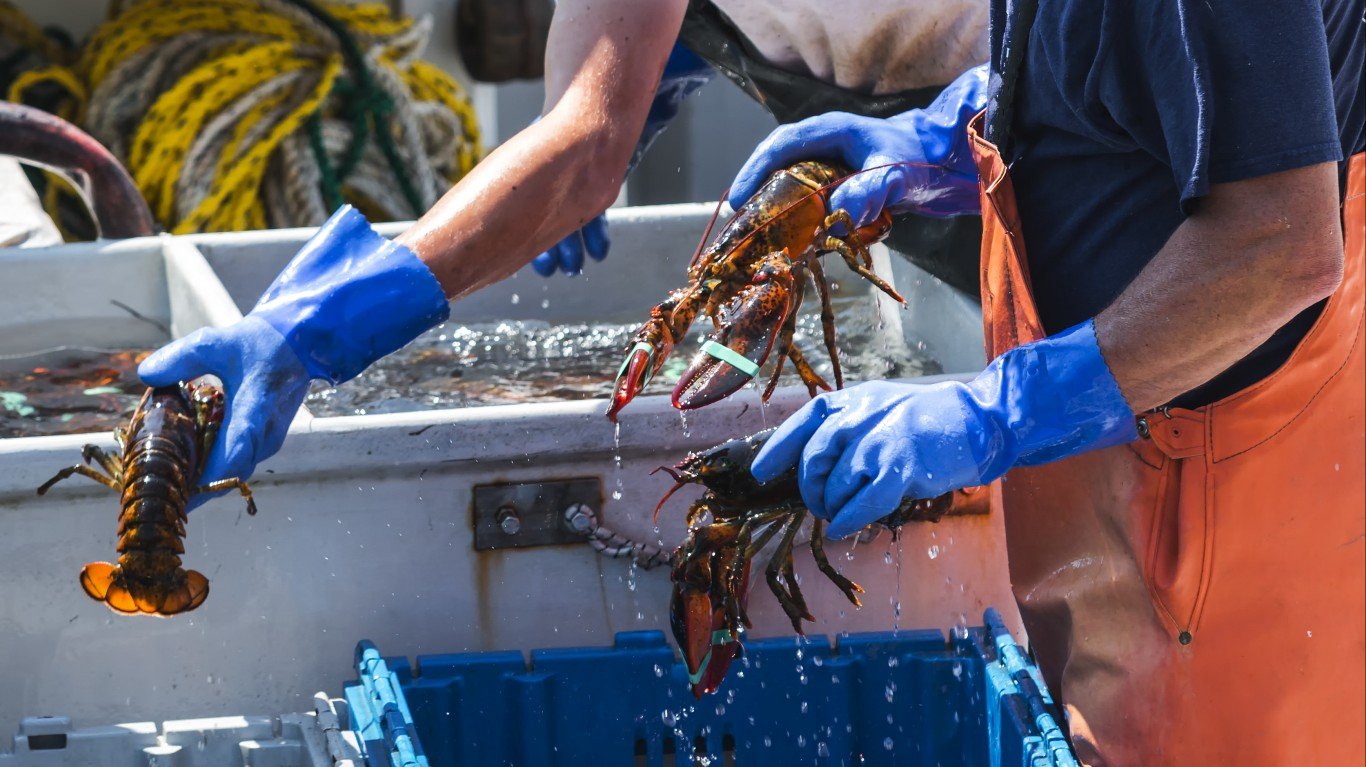
6. Crustaceans (farmed)
> GHG emissions in kg of CO2 equivalents per 1 kg of food: 26.9
> GHG emissions in kg of CO2 equivalents per nutritional unit: 18.2 per 100 g protein (3rd highest)
> Land use in sq meters per 1 kg of food: 3.0 (7th lowest)
> Freshwater withdrawal in liters per 1 kg of food: 3,515.4 (4th highest)

Source: andresr / Getty Images
5. Coffee
> GHG emissions in kg of CO2 equivalents per 1 kg of food: 28.5
> GHG emissions in kg of CO2 equivalents per nutritional unit: 0.4 per 1 kg (6th lowest)
> Land use in sq meters per 1 kg of food: 21.6 (7th highest)
> Freshwater withdrawal in liters per 1 kg of food: 25.9 (5th lowest)
[in-text-ad]

Source: FOTOGRAFIA INC. / E+ via Getty Images
4. Bovine Meat (dairy herd)
> GHG emissions in kg of CO2 equivalents per 1 kg of food: 33.3
> GHG emissions in kg of CO2 equivalents per nutritional unit: 16.9 per 100 g protein (4th highest)
> Land use in sq meters per 1 kg of food: 43.2 (5th highest)
> Freshwater withdrawal in liters per 1 kg of food: 2,714.3 (5th highest)
Source: dmbaker / iStock / Getty Images Plus via Getty Images
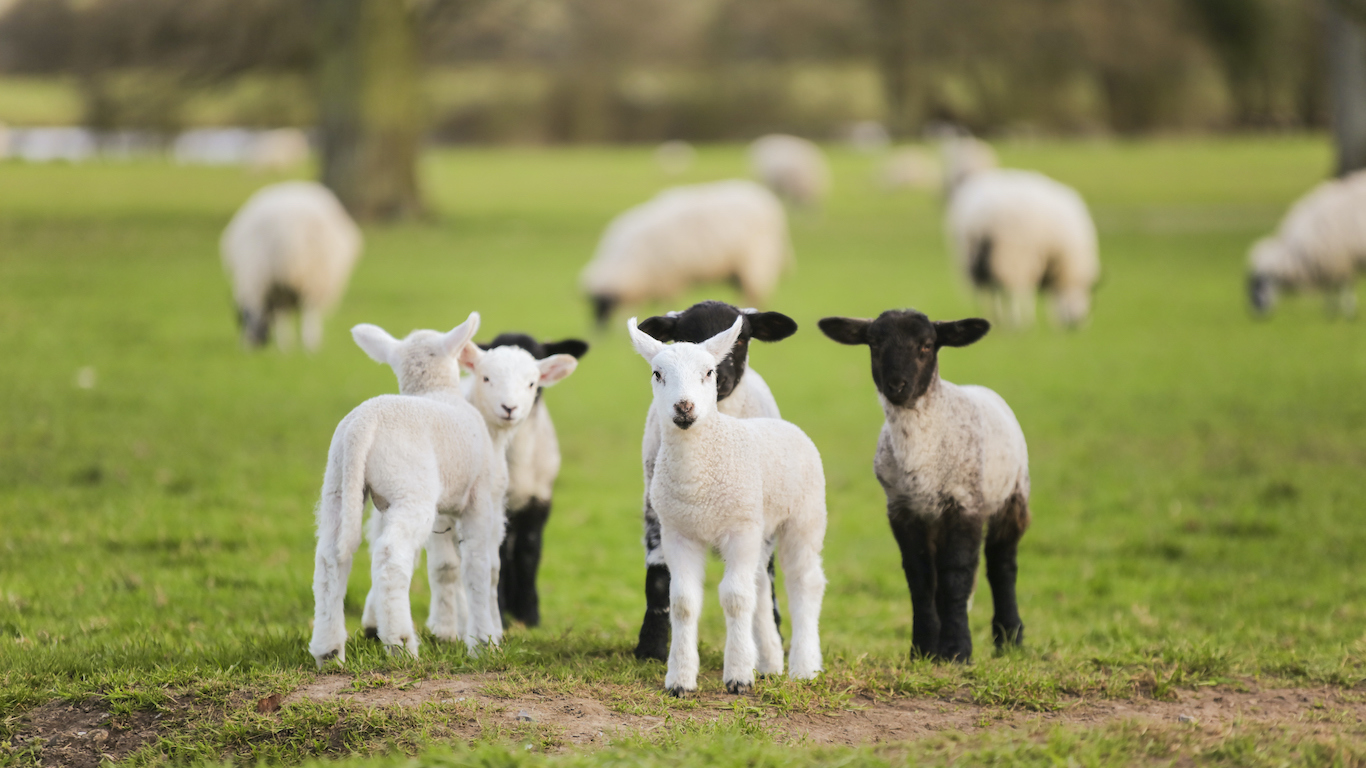
3. Lamb & Mutton
> GHG emissions in kg of CO2 equivalents per 1 kg of food: 39.7
> GHG emissions in kg of CO2 equivalents per nutritional unit: 19.9 per 100 g protein (2nd highest)
> Land use in sq meters per 1 kg of food: 369.8 (the highest)
> Freshwater withdrawal in liters per 1 kg of food: 1,802.8 (9th highest)
Source: JulyProkopiv / iStock via Getty Images
2. Dark Chocolate
> GHG emissions in kg of CO2 equivalents per 1 kg of food: 46.7
> GHG emissions in kg of CO2 equivalents per nutritional unit: 2.3 per 1000 kcal (17th highest)
> Land use in sq meters per 1 kg of food: 69.0 (4th highest)
> Freshwater withdrawal in liters per 1 kg of food: 540.6 (18th highest)
[in-text-ad-2]
Source: nickalbi / iStock via Getty Images
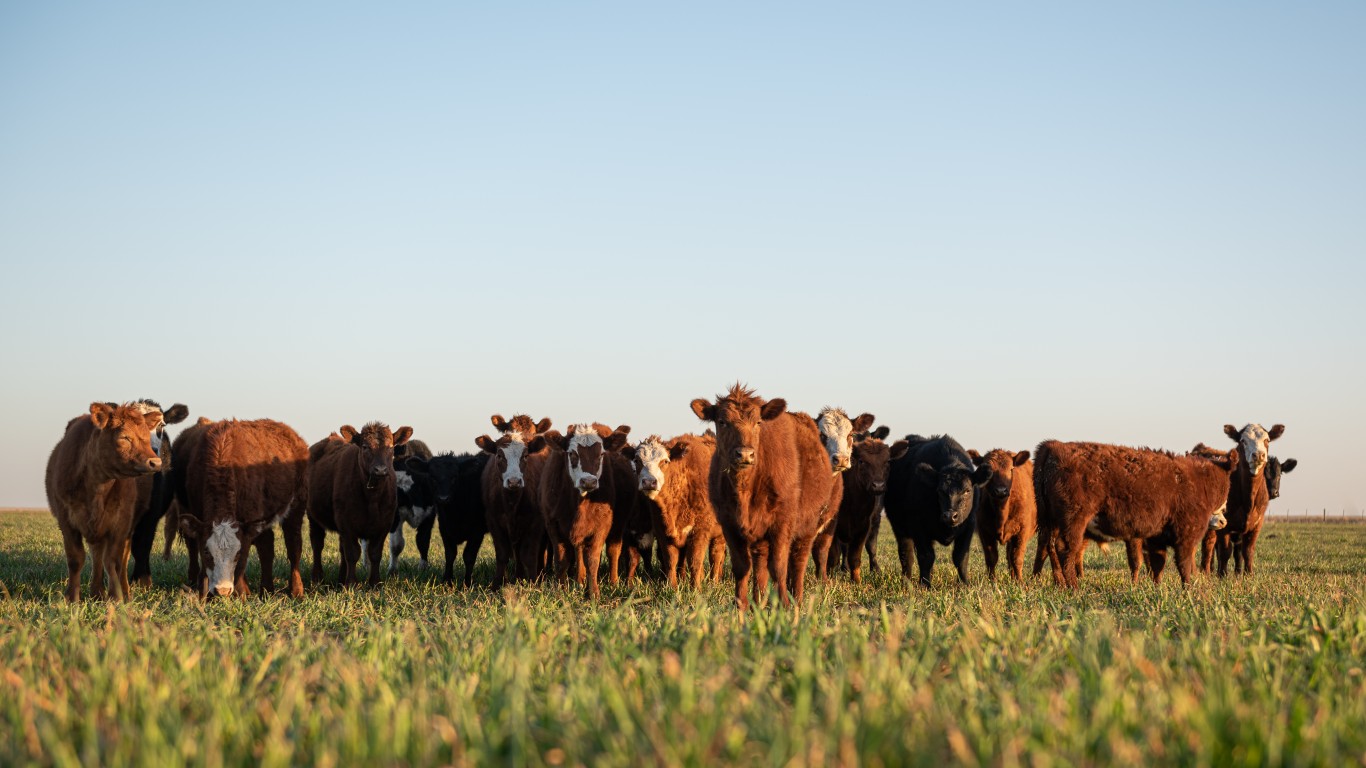
1. Bovine Meat (beef herd)
> GHG emissions in kg of CO2 equivalents per 1 kg of food: 99.5
> GHG emissions in kg of CO2 equivalents per nutritional unit: 49.9 per 100 g protein (the highest)
> Land use in sq meters per 1 kg of food: 326.2 (2nd highest)
> Freshwater withdrawal in liters per 1 kg of food: 1,451.2 (11th highest)
Methodology
To find the foods with the worst environmental impact, 24/7 Wall St. reviewed data from the research article, “Reducing food’s environmental impacts through producers and consumers,” published in Science magazine in 2018. Researchers covered only 43 food products and data is for 2013. Foods are ranked by greenhouse gas emissions in kilograms of carbon dioxide equivalents per kilogram of food product.
We also added from the research GHG emissions per nutritional unit as noted (100 g protein, 1000 kcal, etc.). Land use is the area occupied to produce 1 kg of product, in meter squared a year. Freshwater withdrawals include several sources and are measured in liters per 1 kg of food product.
Sponsored: Want to Retire Early? Here’s a Great First Step
Want retirement to come a few years earlier than you’d planned? Or are you ready to retire now, but want an extra set of eyes on your finances?
Now you can speak with up to 3 financial experts in your area for FREE. By simply clicking here you can begin to match with financial professionals who can help you build your plan to retire early. And the best part? The first conversation with them is free.
Click here to match with up to 3 financial pros who would be excited to help you make financial decisions.
Thank you for reading! Have some feedback for us?
Contact the 24/7 Wall St. editorial team.
Editors' Picks