
The number of initial public offerings – private companies that offer shares of stock to the public by listing their shares on stock exchanges – rose in U.S. stock markets to a record of 1,058 IPOs in 2021. This was well over double the number of IPOs in 2020, the previous record.
Over the past decade, a majority of IPOs ended the day higher than on debut – nearly 70% from 2008 to 2020. How much higher, of course, differed from stock to stock and by year. In 2020, the average return at the end of the first day, also referred to as “IPO pop” was 38%, but it was a much lower 8% in 2010, according to Nasdaq data. (Is IPO investing among the things to do if you want to retire early?)
On rare occasions, the value of the stock at the end of its first trading day can be multiples higher than the price at the start of the day. This is known as a runup.
To determine the biggest IPO runups of the last 50 years, 24/7 Wall St. reviewed the report “Big IPO Runups of 1975-2022, as of January 18, 2022,” prepared by Professor Jay R. Ritter of the University of Florida’s Warrington College of Business. The report lists the over 300 IPOs – common stock offerings, unit offerings, and those with an offer price of less than $5.00 and proceeds of less than $5 million of non-ADR operating companies – that more than doubled on their first day of trading from 1975 through Nov. 24 2021.
One of the more telling details about this list of companies that have had the biggest IPO runups on record is that many of these IPOs took place during the dot-com bubble that burst after March 2000. At the time, the internet was new and investors were jumping on anything that sounded like the Next Big Thing. Nineteen of the 25 companies on this list had their huge runups in 1999 or 2000. (These are the 20 best performing hedge funds of all time.)
Some of the companies on this list have since been acquired, such as MarketWatch.com. The financial news site was purchased by Dow Jones & Co. in 2007 for $528 million, or $18 per share – just $1 more than its 1999 IPO offer price and well below the closing price that day of $232.
This list of IPO runup leaders also includes Priceline.com, which still exists today as largely the same company it was when it went public in 1999, albeit its stock is sold under its parent company Booking Holdings. There’s also a noticeable bust in social networking site theGlobe.com, which went belly up in 2008, a decade after its IPO — theGlobe.com’s shares closed their first day seven times higher than the stock’s initial offer price.
The more recent IPO runup leaders include Esports Technologies, which develops platforms for competitive video gaming, and Chinese financial services provider Sentage Holdings.
Click here to see the biggest IPO runups of the last 50 years

25. Neoforma.com
> First-day share price increase: 302.9% (+$39.38)
> Offer price: $13.00
> Price at market close: $52.38
> Offer date: Jan. 25, 2000
> Ticker symbol: NEOF
[in-text-ad]

24. Wireless Facilities
> First-day share price increase: 313.3% (+$47.00)
> Offer price: $15.00
> Price at market close: $62.00
> Offer date: Nov. 5, 1999
> Ticker symbol: WFII

23. Asiainfo Holdings
> First-day share price increase: 314.8% (+$75.56)
> Offer price: $24.00
> Price at market close: $99.56
> Offer date: March 3, 2000
> Ticker symbol: ASIA

22. Priceline.com
> First-day share price increase: 331.3% (+$53.00)
> Offer price: $16.00
> Price at market close: $69.00
> Offer date: March 30, 1999
> Ticker symbol: PCLN
[in-text-ad-2]

21. Crossroads Systems
> First-day share price increase: 337.3% (+$60.72)
> Offer price: $18.00
> Price at market close: $78.72
> Offer date: Oct. 20, 1999
> Ticker symbol: CRDS

20. Firepond
> First-day share price increase: 355.7% (+$78.25)
> Offer price: $22.00
> Price at market close: $100.25
> Offer date: Feb. 4, 2000
> Ticker symbol: FIRE
[in-text-ad]

19. Finisar
> First-day share price increase: 357.2% (+$67.88)
> Offer price: $19.00
> Price at market close: $86.88
> Offer date: Nov. 12, 1999
> Ticker symbol: FNSR
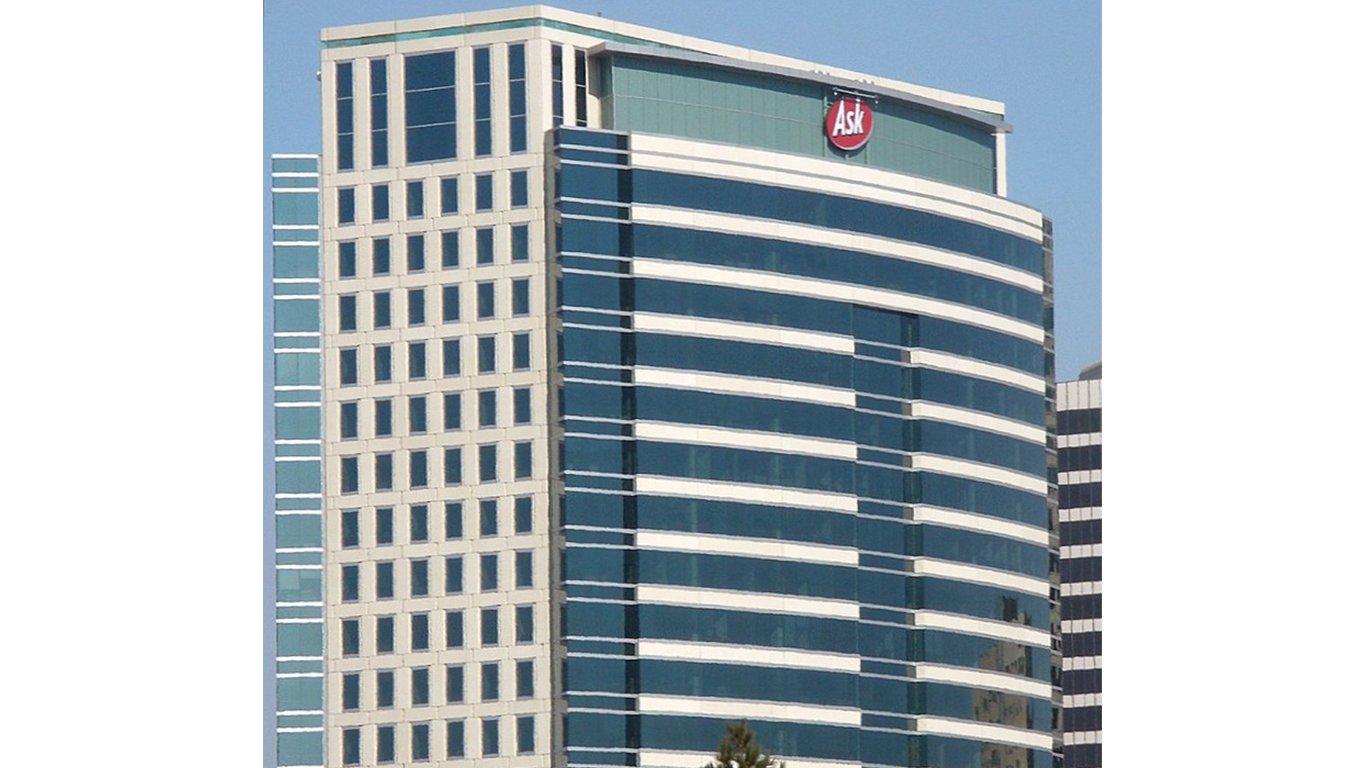
18. Ask Jeeves
> First-day share price increase: 363.8% (+$50.94)
> Offer price: $14.00
> Price at market close: $64.94
> Offer date: July 1, 1999
> Ticker symbol: ASKJ

17. Selectica
> First-day share price increase: 370.8% (+$111.23)
> Offer price: $30.00
> Price at market close: $141.23
> Offer date: March 10, 2000
> Ticker symbol: SLTC
[in-text-ad-2]

16. Avanex corporation
> First-day share price increase: 377.8% (+$136.00)
> Offer price: $36.00
> Price at market close: $172.00
> Offer date: Feb. 4, 2000
> Ticker symbol: AVNX

15. Sycamore Networks
> First-day share price increase: 386.2% (+$146.75)
> Offer price: $38.00
> Price at market close: $184.75
> Offer date: Oct. 22, 1999
> Ticker symbol: SCMR
[in-text-ad]

14. Pop Culture Group Ltd
> First-day share price increase: 405.0% (+$24.30)
> Offer price: $6.00
> Price at market close: $30.30
> Offer date: June 30, 2021
> Ticker symbol: CPOP

13. Cacheflow
> First-day share price increase: 426.6% (+$102.38)
> Offer price: $24.00
> Price at market close: $126.38
> Offer date: Nov. 19, 1999
> Ticker symbol: CFLO

12. Society Pass
> First-day share price increase: 436.7% (+$39.30)
> Offer price: $9.00
> Price at market close: $48.30
> Offer date: Nov. 9, 2021
> Ticker symbol: SOPA
[in-text-ad-2]
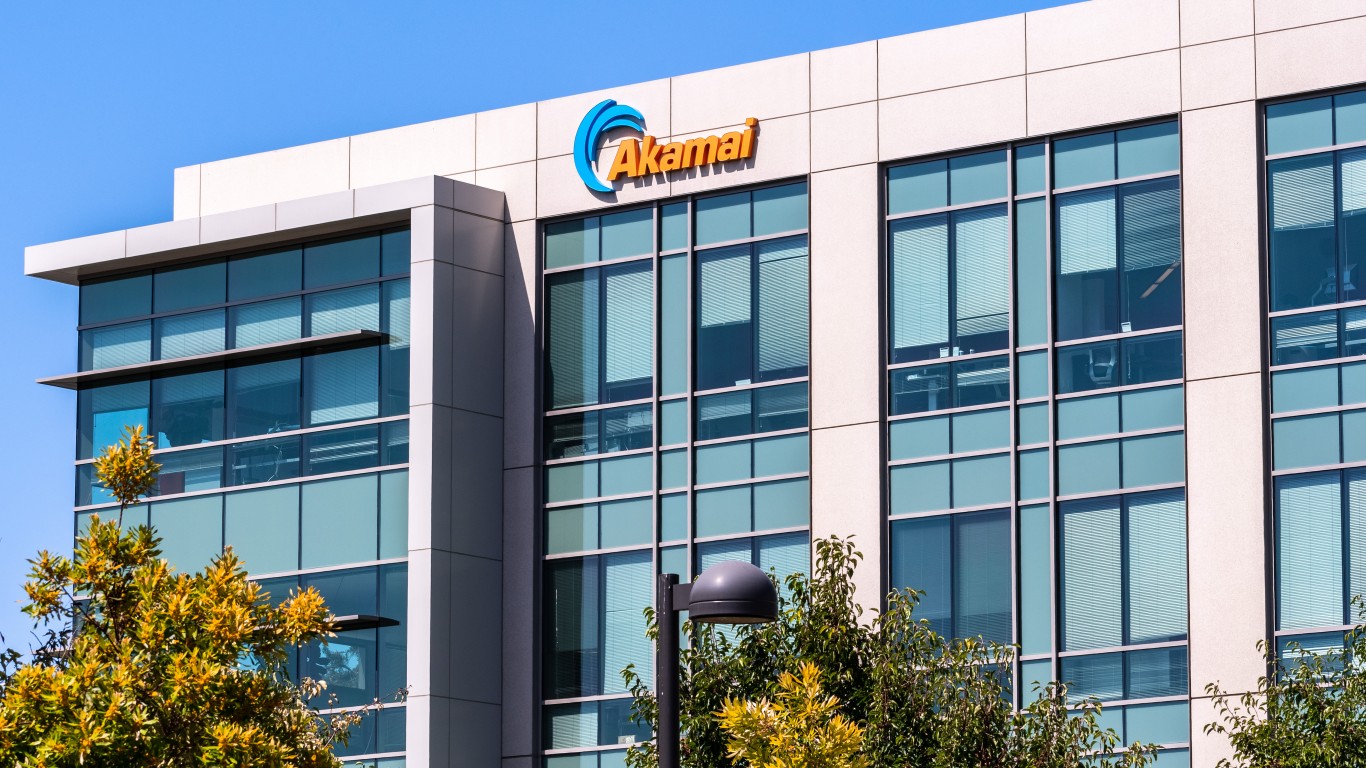
11. Akamai Technologies
> First-day share price increase: 458.4% (+$119.19)
> Offer price: $26.00
> Price at market close: $145.19
> Offer date: Oct. 29, 1999
> Ticker symbol: AKAM
10. Marketwatch.com
> First-day share price increase: 473.5% (+$80.50)
> Offer price: $17.00
> Price at market close: $97.50
> Offer date: Jan. 15, 1999
> Ticker symbol: MKTW
[in-text-ad]
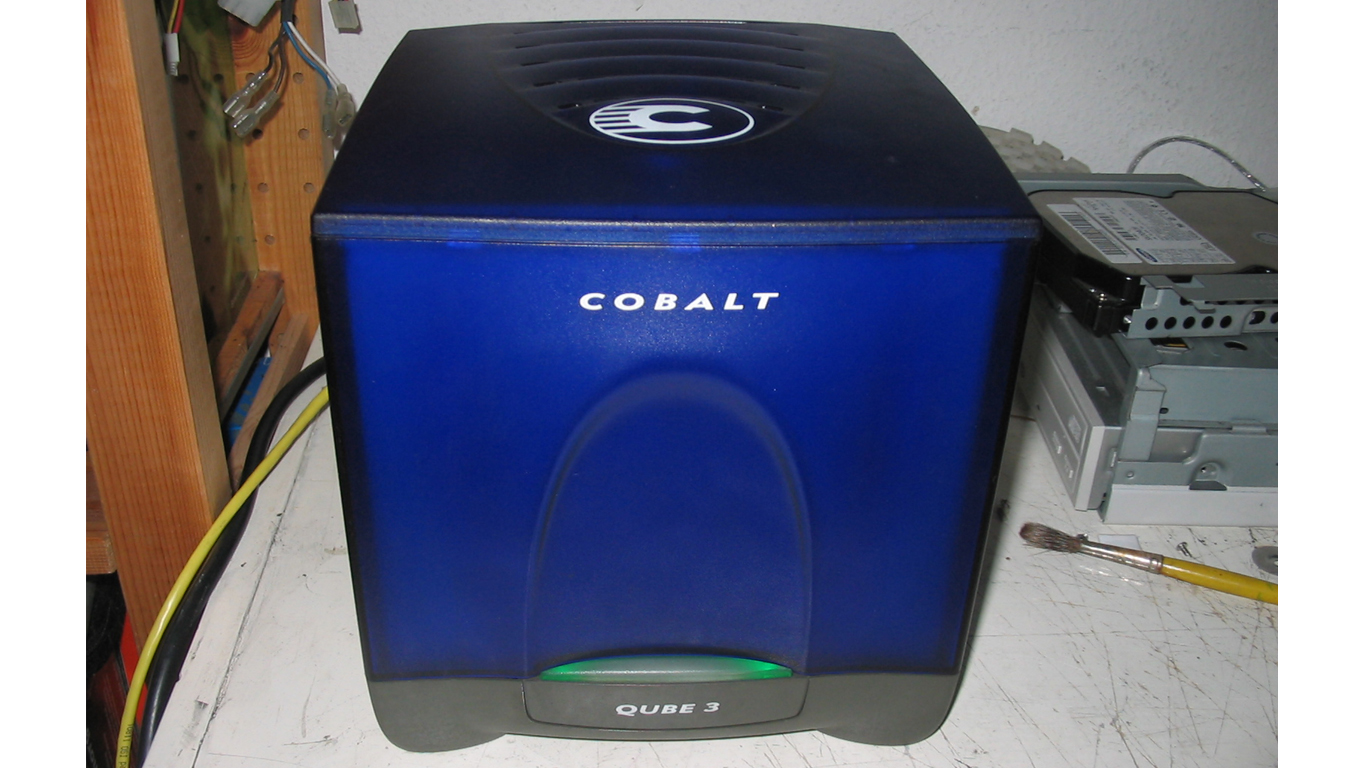
9. Cobalt Networks
> First-day share price increase: 482.4% (+$106.13)
> Offer price: $22.00
> Price at market close: $128.13
> Offer date: Nov. 5, 1999
> Ticker symbol: COBT

8. Free Markets
> First-day share price increase: 483.3% (+$232.00)
> Offer price: $48.00
> Price at market close: $280.00
> Offer date: Dec. 10, 1999
> Ticker symbol: FMKT
7. Esports
> First-day share price increase: 507.0% (+$30.42)
> Offer price: $6.00
> Price at market close: $36.42
> Offer date: April 15, 2021
> Ticker symbol: EBET
[in-text-ad-2]
6. Webmethods
> First-day share price increase: 507.5% (+$177.62)
> Offer price: $35.00
> Price at market close: $212.62
> Offer date: Feb. 11, 2000
> Ticker symbol: WEBM
5. Foundry Networks
> First-day share price increase: 525.0% (+$131.25)
> Offer price: $25.00
> Price at market close: $156.25
> Offer date: Sept. 28, 1999
> Ticker symbol: FDRY
[in-text-ad]

4. Sentage Holdings
> First-day share price increase: 597.8% (+$29.89)
> Offer price: $5.00
> Price at market close: $34.89
> Offer date: July 9, 2021
> Ticker symbol: SNTG

3. theglobe.com
> First-day share price increase: 605.6% (+$54.50)
> Offer price: $9.00
> Price at market close: $63.50
> Offer date: Nov. 13, 1998
> Ticker symbol: TGLO

2. AeroClean Technologies
> First-day share price increase: 689.4% (+$68.94)
> Offer price: $10.00
> Price at market close: $78.94
> Offer date: Nov. 24, 2021
> Ticker symbol: AERC
[in-text-ad-2]
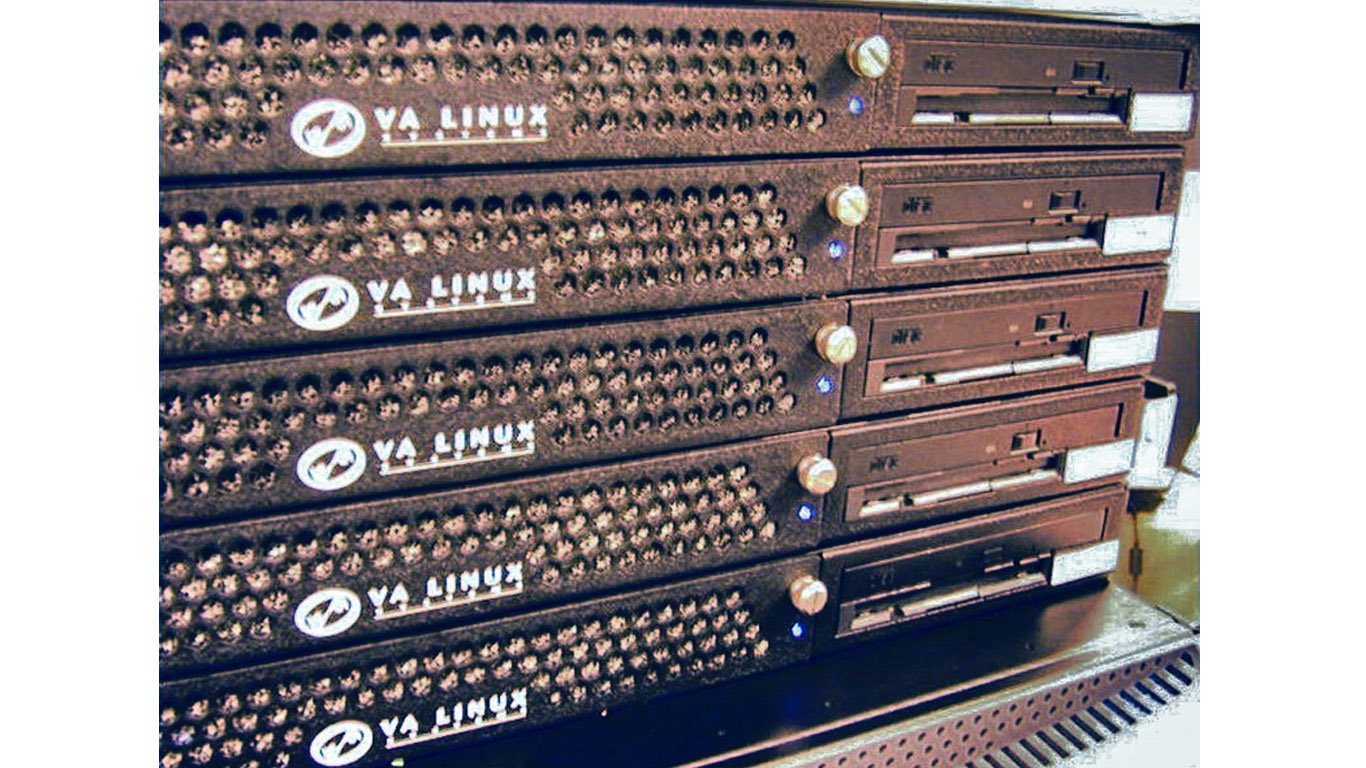
1. VA Linux
> First-day share price increase: 697.5% (+$209.25)
> Offer price: $30.00
> Price at market close: $239.25
> Offer date: Dec. 9, 1999
> Ticker symbol: LNUX
Sponsored: Find a Qualified Financial Advisor
Finding a qualified financial advisor doesn’t have to be hard. SmartAsset’s free tool matches you with up to 3 fiduciary financial advisors in your area in 5 minutes. Each advisor has been vetted by SmartAsset and is held to a fiduciary standard to act in your best interests. If you’re ready to be matched with local advisors that can help you achieve your financial goals, get started now.
Thank you for reading! Have some feedback for us?
Contact the 24/7 Wall St. editorial team.
 24/7 Wall St.
 24/7 Wall St.
 24/7 Wall St.