
It will soon be two years since the pandemic disrupted life in the United States, causing some people to reconsider where they live and how they work. One major consequence of the outbreak has been the relocation of people, mostly out of densely populated urban areas to parts of the country where it is much easier to social distance. There are political consequences to population changes. States gaining people may end up with more seats in the House of Representatives. (See how the population of every state has changed in the last 100 years.)
To identify the states that have grown the most since the pandemic, 24/7 Wall St. looked at the 1-year population change from July 1, 2020 to July 1, 2021 according to the US Census Bureau. The average number of new COVID-19 cases in the past seven days comes from 24/7 Wall St.’s own COVID calculator for state totals.
Some states where the population increased during the pandemic were growing anyway as the result of the longtime trend of Americans moving out of Rust Belt states like Michigan and Ohio and Northeastern states like New York and heading to warmer climates (and places with lower taxes) such as Florida, Arizona, and Texas. In addition, some people chose new states where COVID mandates were non-existent or less severe – for instance, South Dakota as well as Florida and Texas.
People also left more densely populated states of New Jersey, Rhode Island, and Maryland for less densely populated locations like Nevada, Idaho, Montana, and Utah. All of these have a population density of fewer than 30 residents per square mile, and all experienced the largest population increases over the period we tracked, growing by more than 1%. (By population, these are currently the largest states in America.)
Click here to see the states that have grown most since the pandemic began
Delaware was an outlier. The nation’s first state is also the fifth-most densely populated, at 512 people per square mile – yet the state experienced a population surge significant enough to push it over the 1 million mark. A possible reason might be an outflow of people fleeing Washington, D.C.

Source: Ron_Thomas / Getty Images
31. Wisconsin
> 1-year change in population: 0.1%
> Population estimate (July 1, 2020) 5,892,323
> Population estimate (July 1, 2021) 5,895,908
> Avg. new COVID cases, past 7 days 6,602.29
[in-text-ad]

Source: ChrisBoswell / Getty Images
30. Oregon
> 1-year change in population: 0.1%
> Population estimate (July 1, 2020) 4,241,544
> Population estimate (July 1, 2021) 4,246,155
> Avg. new COVID cases, past 7 days 6,229.43
Source: wellesenterprises / iStock via Getty Images
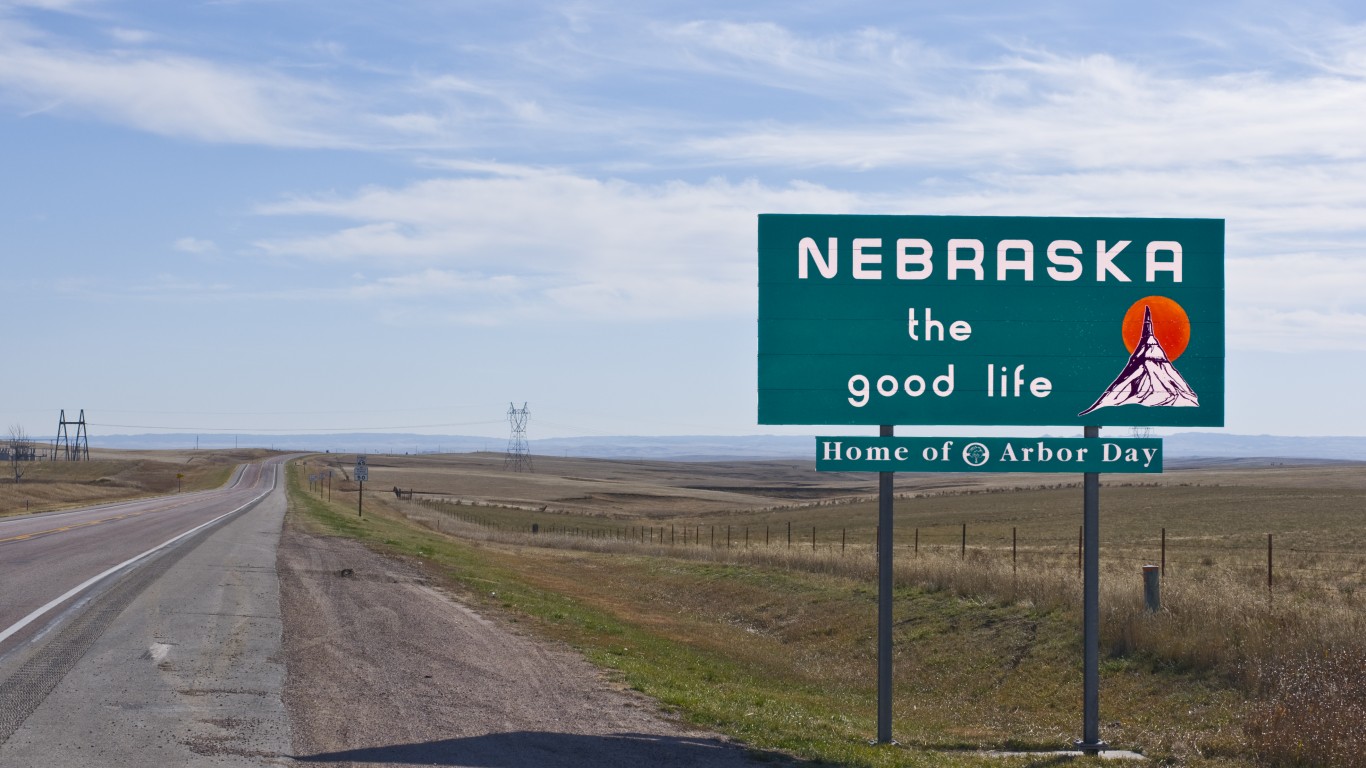
29. Nebraska
> 1-year change in population: 0.1%
> Population estimate (July 1, 2020) 1,961,455
> Population estimate (July 1, 2021) 1,963,692
> Avg. new COVID cases, past 7 days 2,263.71

Source: SeanPavonePhoto / Getty Images
28. Virginia
> 1-year change in population: 0.1%
> Population estimate (July 1, 2020) 8,632,044
> Population estimate (July 1, 2021) 8,642,274
> Avg. new COVID cases, past 7 days 8,530.14
[in-text-ad-2]

Source: alexeys / iStock via Getty Images
27. Kentucky
> 1-year change in population: 0.1%
> Population estimate (July 1, 2020) 4,503,958
> Population estimate (July 1, 2021) 4,509,394
> Avg. new COVID cases, past 7 days 10,786.71
Source: Dirk DBQ / Flickr
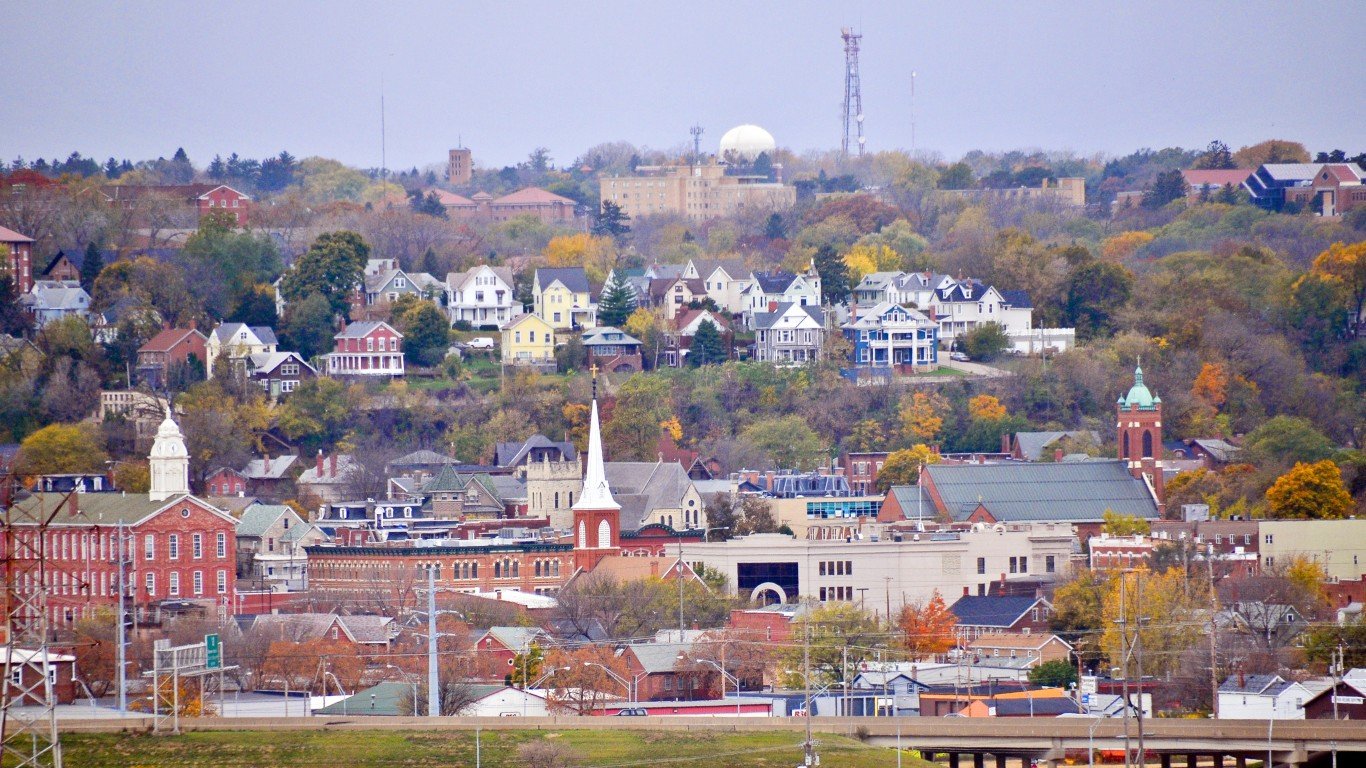
26. Iowa
> 1-year change in population: 0.1%
> Population estimate (July 1, 2020) 3,188,669
> Population estimate (July 1, 2021) 3,193,079
> Avg. new COVID cases, past 7 days 3,684.14
[in-text-ad]

Source: SeanPavonePhoto / Getty Images
25. Connecticut
> 1-year change in population: 0.1%
> Population estimate (July 1, 2020) 3,600,260
> Population estimate (July 1, 2021) 3,605,597
> Avg. new COVID cases, past 7 days 2,238.43

Source: f11photo / Getty Images
24. Missouri
> 1-year change in population: 0.2%
> Population estimate (July 1, 2020) 6,154,481
> Population estimate (July 1, 2021) 6,168,187
> Avg. new COVID cases, past 7 days 7,755.00

Source: Pung / Shutterstock.com
23. Washington
> 1-year change in population: 0.3%
> Population estimate (July 1, 2020) 7,718,785
> Population estimate (July 1, 2021) 7,738,692
> Avg. new COVID cases, past 7 days 19,490.29
[in-text-ad-2]
Source: Brian Evans / iStock via Getty Images
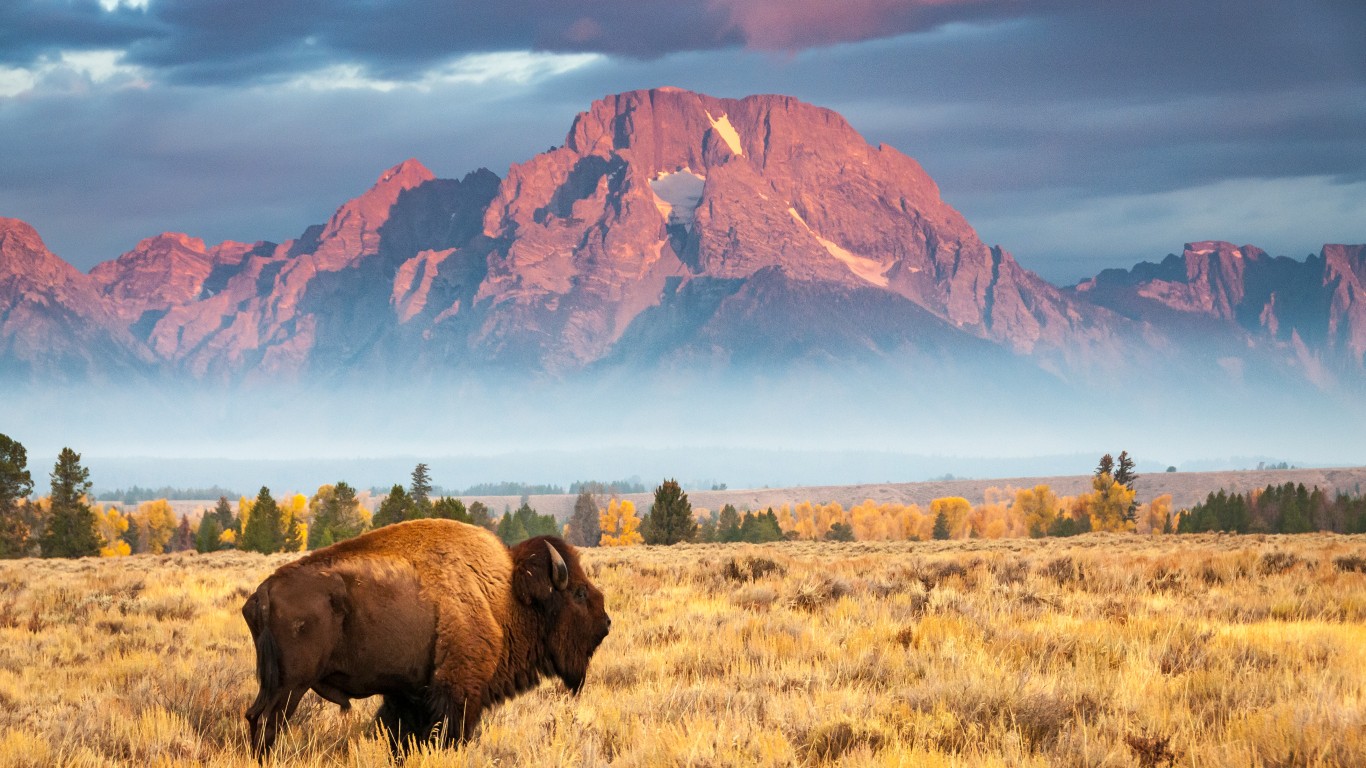
22. Wyoming
> 1-year change in population: 0.3%
> Population estimate (July 1, 2020) 577,267
> Population estimate (July 1, 2021) 578,803
> Avg. new COVID cases, past 7 days 1,233.14

Source: f11photo / Getty Images
21. Indiana
> 1-year change in population: 0.3%
> Population estimate (July 1, 2020) 6,785,644
> Population estimate (July 1, 2021) 6,805,985
> Avg. new COVID cases, past 7 days 9,046.00
[in-text-ad]
Source: Allard1 / Getty Images
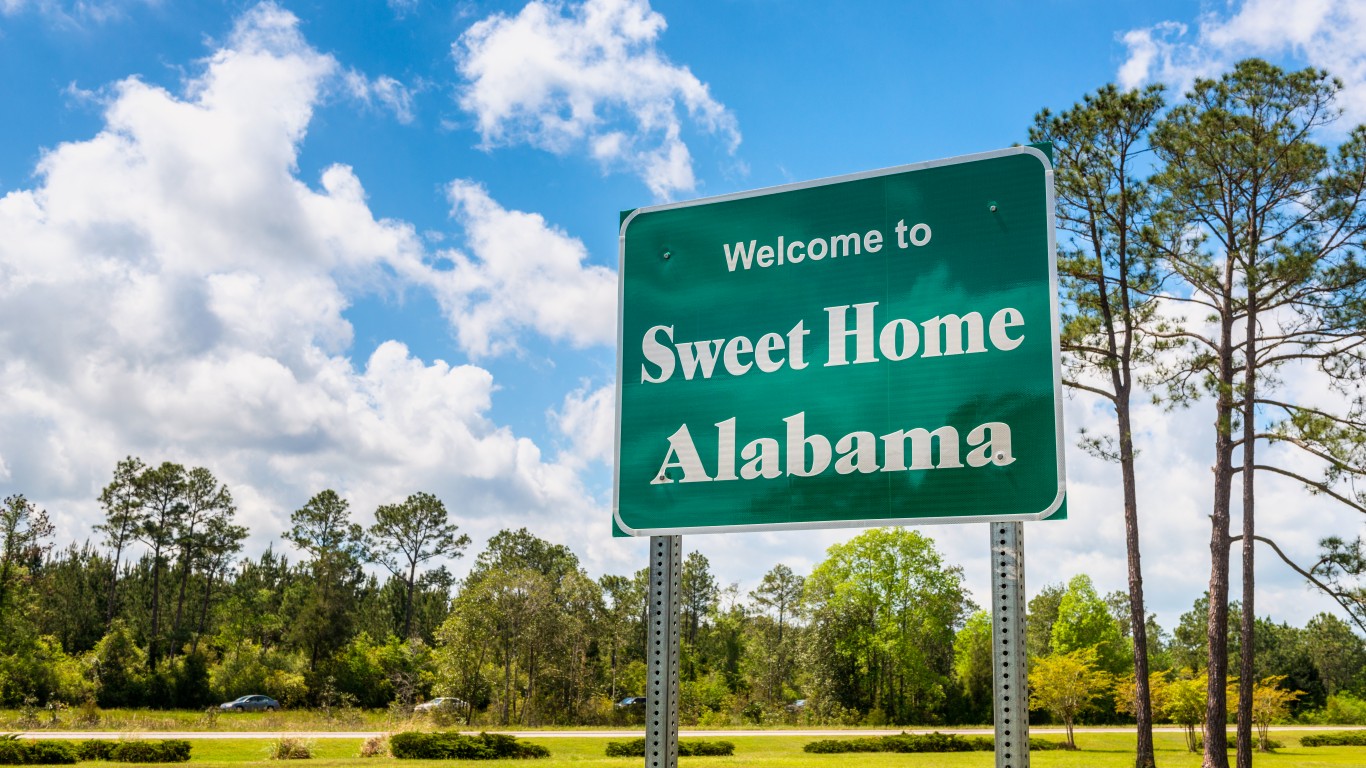
20. Alabama
> 1-year change in population: 0.3%
> Population estimate (July 1, 2020) 5,024,803
> Population estimate (July 1, 2021) 5,039,877
> Avg. new COVID cases, past 7 days 8,848.57

Source: BlazenImages / Getty Images
19. Arkansas
> 1-year change in population: 0.5%
> Population estimate (July 1, 2020) 3,012,232
> Population estimate (July 1, 2021) 3,025,891
> Avg. new COVID cases, past 7 days 4,982.57

Source: DenisTangneyJr / Getty Images
18. Vermont
> 1-year change in population: 0.5%
> Population estimate (July 1, 2020) 642,495
> Population estimate (July 1, 2021) 645,570
> Avg. new COVID cases, past 7 days 646.57
[in-text-ad-2]

Source: f11photo / Getty Images
17. Colorado
> 1-year change in population: 0.5%
> Population estimate (July 1, 2020) 5,784,308
> Population estimate (July 1, 2021) 5,812,069
> Avg. new COVID cases, past 7 days 6,424.29

Source: DenisTangneyJr / Getty Images
16. Oklahoma
> 1-year change in population: 0.6%
> Population estimate (July 1, 2020) 3,962,031
> Population estimate (July 1, 2021) 3,986,639
> Avg. new COVID cases, past 7 days 8,067.86
[in-text-ad]

Source: Sean Pavone / Getty Images
15. Georgia
> 1-year change in population: 0.7%
> Population estimate (July 1, 2020) 10,725,800
> Population estimate (July 1, 2021) 10,799,566
> Avg. new COVID cases, past 7 days 13,655.86
 24/7 Wall St.
Source: SeanPavonePhoto / Getty Images
14. Maine
> 1-year change in population: 0.7%
> Population estimate (July 1, 2020) 1,362,280
> Population estimate (July 1, 2021) 1,372,247
> Avg. new COVID cases, past 7 days 1,040.71

Source: Sean Pavone / Getty Images
13. Tennessee
> 1-year change in population: 0.8%
> Population estimate (July 1, 2020) 6,920,119
> Population estimate (July 1, 2021) 6,975,218
> Avg. new COVID cases, past 7 days 13,113.57
[in-text-ad-2]

Source: DenisTangneyJr / Getty Images
12. New Hampshire
> 1-year change in population: 0.8%
> Population estimate (July 1, 2020) 1,377,848
> Population estimate (July 1, 2021) 1,388,992
> Avg. new COVID cases, past 7 days 1,673.71

Source: Kruck20 / iStock via Getty Images
11. North Carolina
> 1-year change in population: 0.9%
> Population estimate (July 1, 2020) 10,457,177
> Population estimate (July 1, 2021) 10,551,162
> Avg. new COVID cases, past 7 days 18,802.86
[in-text-ad]
Source: peeterv / iStock via Getty Images
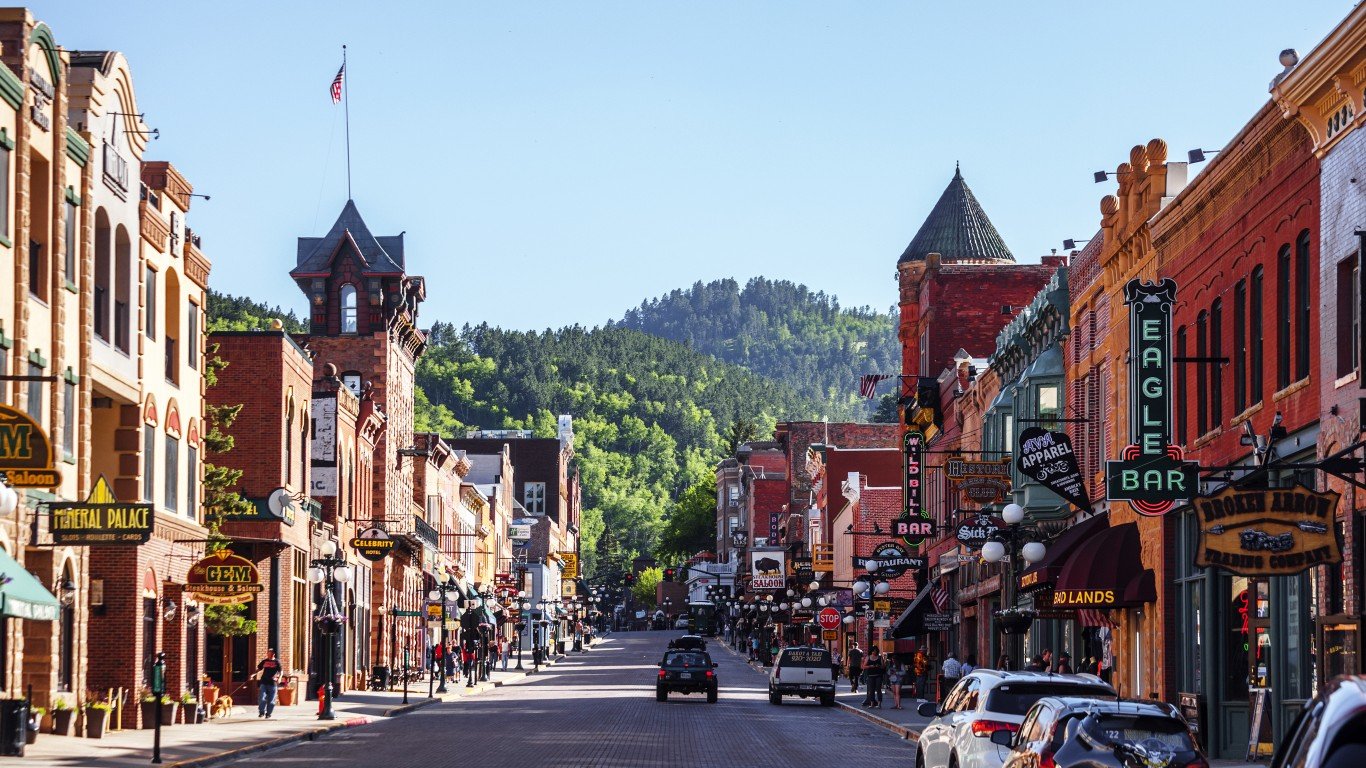
10. South Dakota
> 1-year change in population: 0.9%
> Population estimate (July 1, 2020) 887,099
> Population estimate (July 1, 2021) 895,376
> Avg. new COVID cases, past 7 days 1,124.29

Source: 4kodiak / Getty Images
9. Nevada
> 1-year change in population: 1.0%
> Population estimate (July 1, 2020) 3,114,071
> Population estimate (July 1, 2021) 3,143,991
> Avg. new COVID cases, past 7 days 3,793.57

Source: marchello74 / Getty Images
8. Florida
> 1-year change in population: 1.0%
> Population estimate (July 1, 2020) 21,569,932
> Population estimate (July 1, 2021) 21,781,128
> Avg. new COVID cases, past 7 days 24,682.86
[in-text-ad-2]
Source: Barbara Smyers / iStock via Getty Images
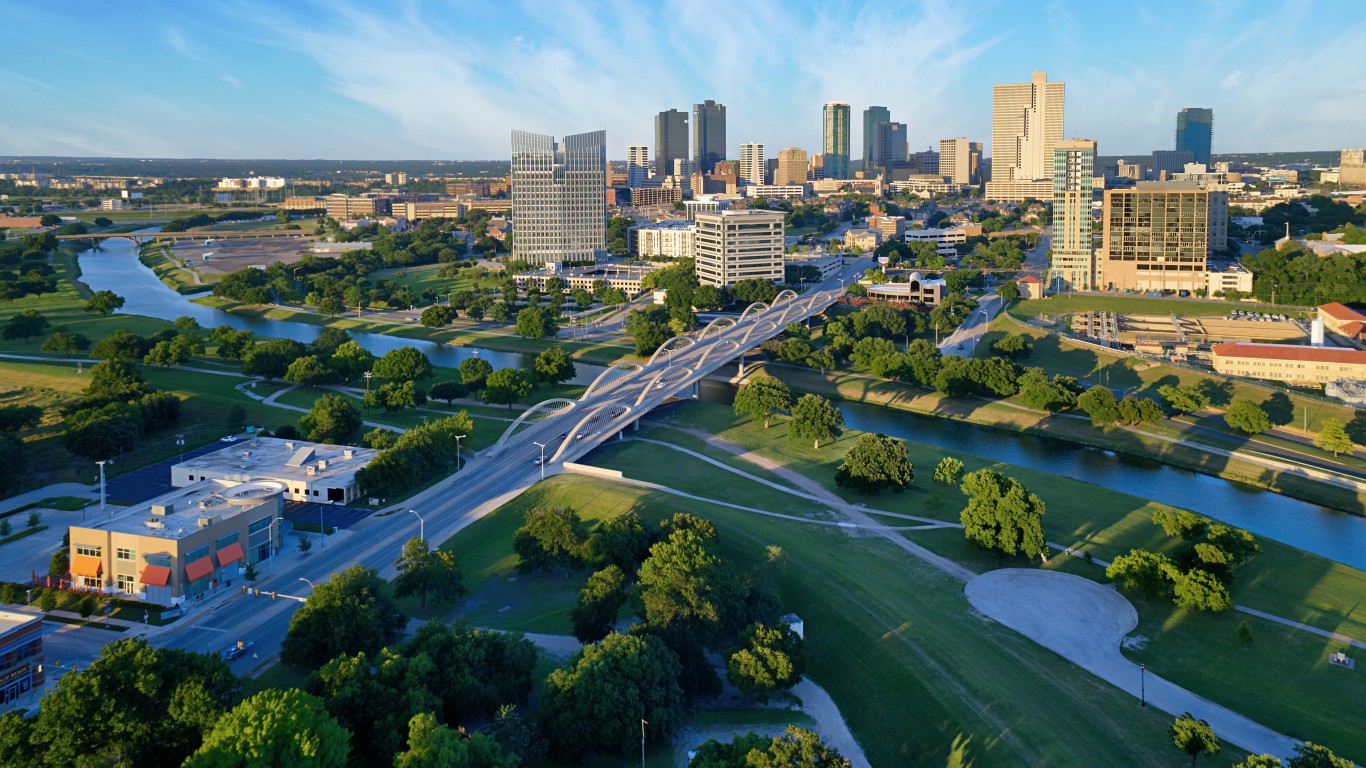
7. Texas
> 1-year change in population: 1.1%
> Population estimate (July 1, 2020) 29,217,653
> Population estimate (July 1, 2021) 29,527,941
> Avg. new COVID cases, past 7 days 35,168.86

Source: mdgmorris / Getty Images
6. Delaware
> 1-year change in population: 1.2%
> Population estimate (July 1, 2020) 991,886
> Population estimate (July 1, 2021) 1,003,384
> Avg. new COVID cases, past 7 days 963.43
[in-text-ad]
Source: Sean Pavone / Getty Images
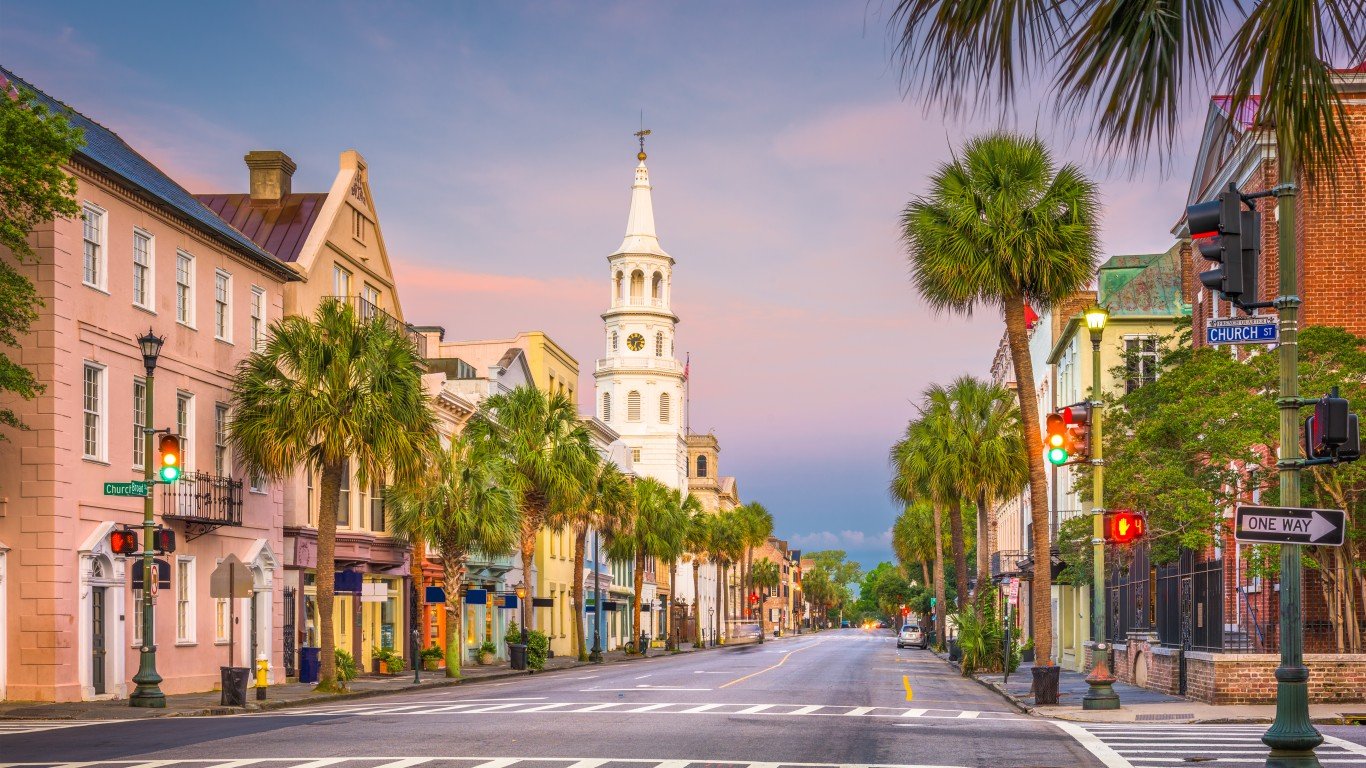
5. South Carolina
> 1-year change in population: 1.2%
> Population estimate (July 1, 2020) 5,130,729
> Population estimate (July 1, 2021) 5,190,705
> Avg. new COVID cases, past 7 days 17,455.71

Source: Nick Fox / Shutterstock.com
4. Arizona
> 1-year change in population: 1.4%
> Population estimate (July 1, 2020) 7,177,986
> Population estimate (July 1, 2021) 7,276,316
> Avg. new COVID cases, past 7 days 14,763.14

Source: miroslav_1 / Getty Images
3. Montana
> 1-year change in population: 1.7%
> Population estimate (July 1, 2020) 1,086,193
> Population estimate (July 1, 2021) 1,104,271
> Avg. new COVID cases, past 7 days 2,155.14
[in-text-ad-2]
Source: Adventure_Photo / Getty Images
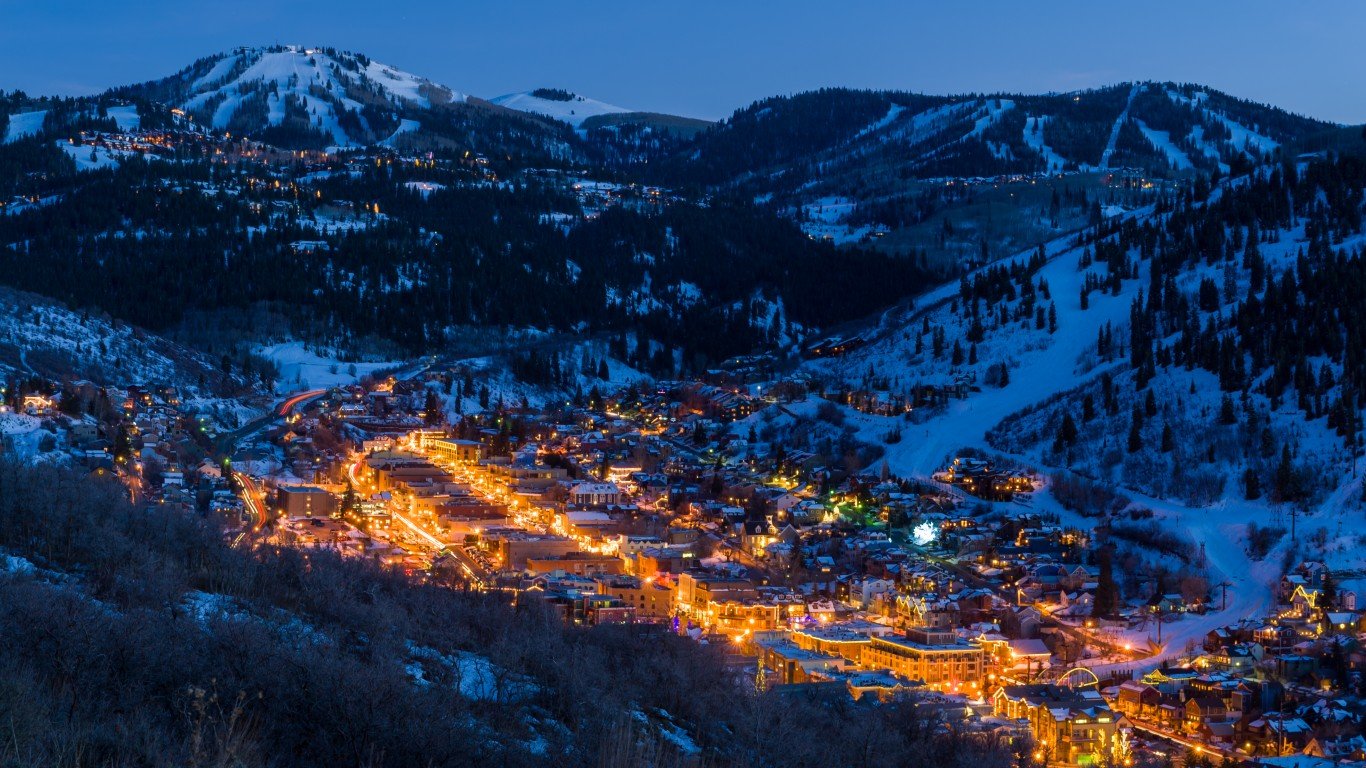
2. Utah
> 1-year change in population: 1.7%
> Population estimate (July 1, 2020) 3,281,684
> Population estimate (July 1, 2021) 3,337,975
> Avg. new COVID cases, past 7 days 5,366.29
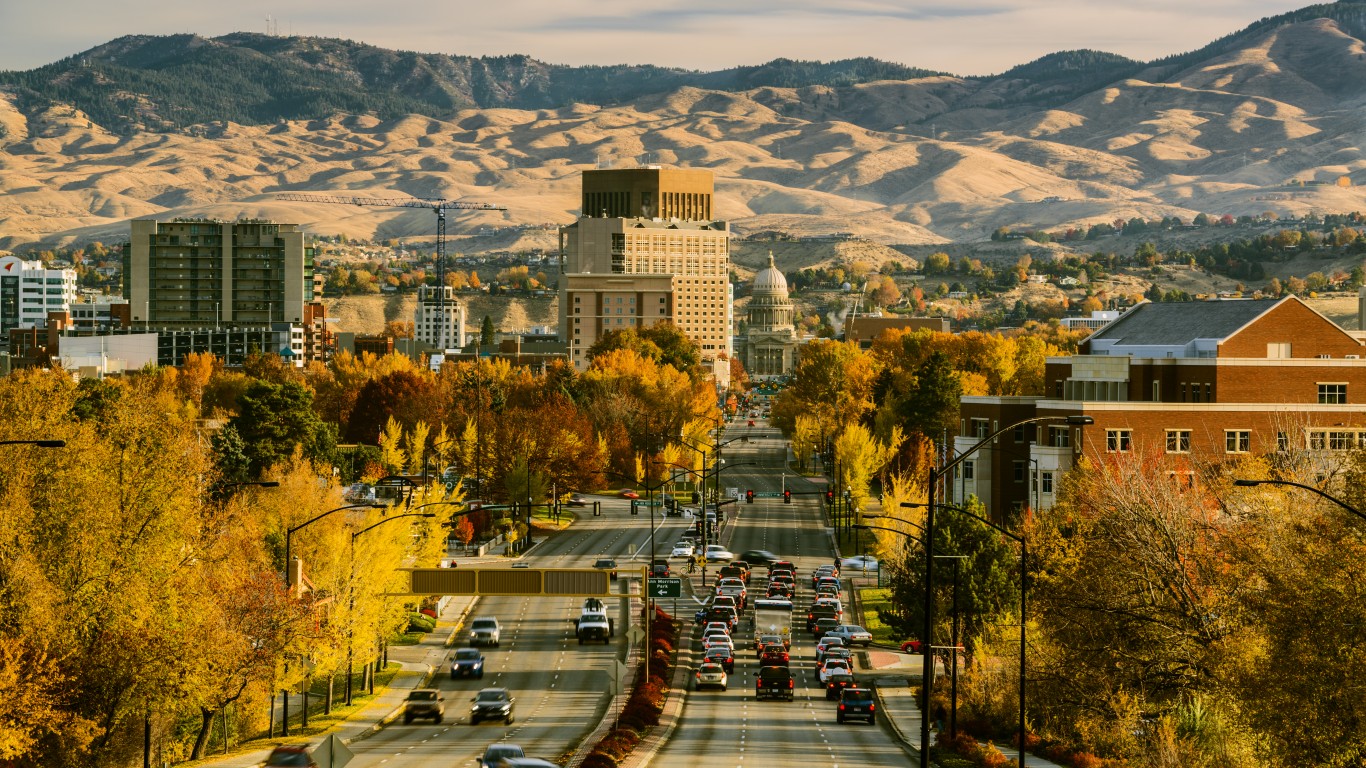
Source: vkbhat / Getty Images
1. Idaho
> 1-year change in population: 2.9%
> Population estimate (July 1, 2020) 1,847,772
> Population estimate (July 1, 2021) 1,900,923
> Avg. new COVID cases, past 7 days 2,749.00
Take This Retirement Quiz To Get Matched With A Financial Advisor (Sponsored)
Take the quiz below to get matched with a financial advisor today.
Each advisor has been vetted by SmartAsset and is held to a fiduciary standard to act in your best interests.
Here’s how it works:
1. Answer SmartAsset advisor match quiz
2. Review your pre-screened matches at your leisure. Check out the
advisors’ profiles.
3. Speak with advisors at no cost to you. Have an introductory call on the phone or introduction in person and choose whom to work with in the future
Take the retirement quiz right here.
Thank you for reading! Have some feedback for us?
Contact the 24/7 Wall St. editorial team.
Editors' Picks