
Though the threat of climate change has been looming for decades, the reality that it does, in fact, represent an existential crisis did not hit home for most people until quite recently. Just in the last few years, huge temperature swings, extreme weather events, large-scale flooding, and wildfires are disrupting the lives and livelihoods of people around the world in terrifying ways.
This past summer, the UN once again sounded the alarm about the immediate imperative to take action to reduce the emission of heat trapping gases, with the Secretary General calling the report a “code red for humanity.” While it is now too late to reverse climate change, governments can still slow its pace and work to avoid increasingly more devastating consequences.
Countries around the world are revising their climate action plans in light of frightening new data, tightening their emission goals and reinvigorating their energy greening and efficiency programs. Most have set a target of either 80% reduction or net zero carbon emissions by 2050, but, still, most are not on track to meet those goals, as their governments struggle with economic realities and lack of momentum.
Fortunately, cities everywhere are also taking up the challenge, often surpassing their national leadership in planning and innovation. While they are usually burdened with energy systems and policies under the control of their country’s leadership, with limited opportunity to change course, many cities have taken citywide and community based measures to lower emissions, often pairing these efforts with economic and social goals.
Because humanity has been slow to address climate with the urgency it requires, it is difficult to know how well currently revised plans and good intentions will play out. The best and most grounded national and municipal plans provide for close monitoring and plan revisions, however, allowing for the measuring of progress and the kind of reality check crucial to actual success.
Click here to see the cities emitting the most carbon dioxide in the world
To identify the cities with the worst CO2 emissions in the world, 24/7 Wall St. reviewed Nangini, C et al. (2019): “A global dataset of CO2 emissions and ancillary data related to emissions for 343 cities,” published in 2017 and available through data publisher Pangaea. Emissions data were collected in each of the cities on this list between the years of 2011 and 2017, in each case the most recent year for which CO2 emissions data is available.
Emissions figures from transport, industrial, waste, and local power plants within city boundaries, as well as emissions (when available) from grid-supplied energy used by cities and produced by power plants outside city boundaries, were also obtained from the study.

Source: Stephen Emlund / E+ via Getty Images
50. District of Columbia, USA
> Total emissions in 2013: 7.39 million tons of CO2 equivalent
> Transport, industrial, waste, and local power plants: 3.13 million tons of CO2 equivalent — #61 most in study
> Grid-supplied energy produced outside the city boundary: 4.25 million tons of CO2 equivalent — #37 most in study
> Population in 2013: 619,000
In the last 50 years the District of Columbia has experienced a 2°F rise in temperature and a 5-10% increase in humidity, making its famously uncomfortable summers much worse, and making a compelling case for an aggressive approach to climate change. The city has put together a plan to reduce emissions by 50% by 2031 and to be carbon neutral by 2050, focusing on energy efficient building codes and clean transportation.
[in-text-ad]

Source: tirc83 / E+ via Getty Images
49. Brasília, Brazil
> Total emissions in 2012: 7.74 million tons of CO2 equivalent
> Transport, industrial, waste, and local power plants: 7.74 million tons of CO2 equivalent — #33 most in study
> Grid-supplied energy produced outside the city boundary: N/A
> Population in 2012: 2.8 million
Although Brazil has a stated goal of reducing carbon emissions by 37% from 2005 rates by 2025, and a recent pledge by the president to reach carbon neutrality by 2050, there is little to indicate that the goal is being taken seriously by the government. Deforestation continues at an alarming rate and climate activity budgets have been slashed under the presidency of Jair Bolsonaro. There is no actionable plan beyond seeking foreign financial assistance in reducing forest burning.
Source: TopPhotoImages / iStock via Getty Images
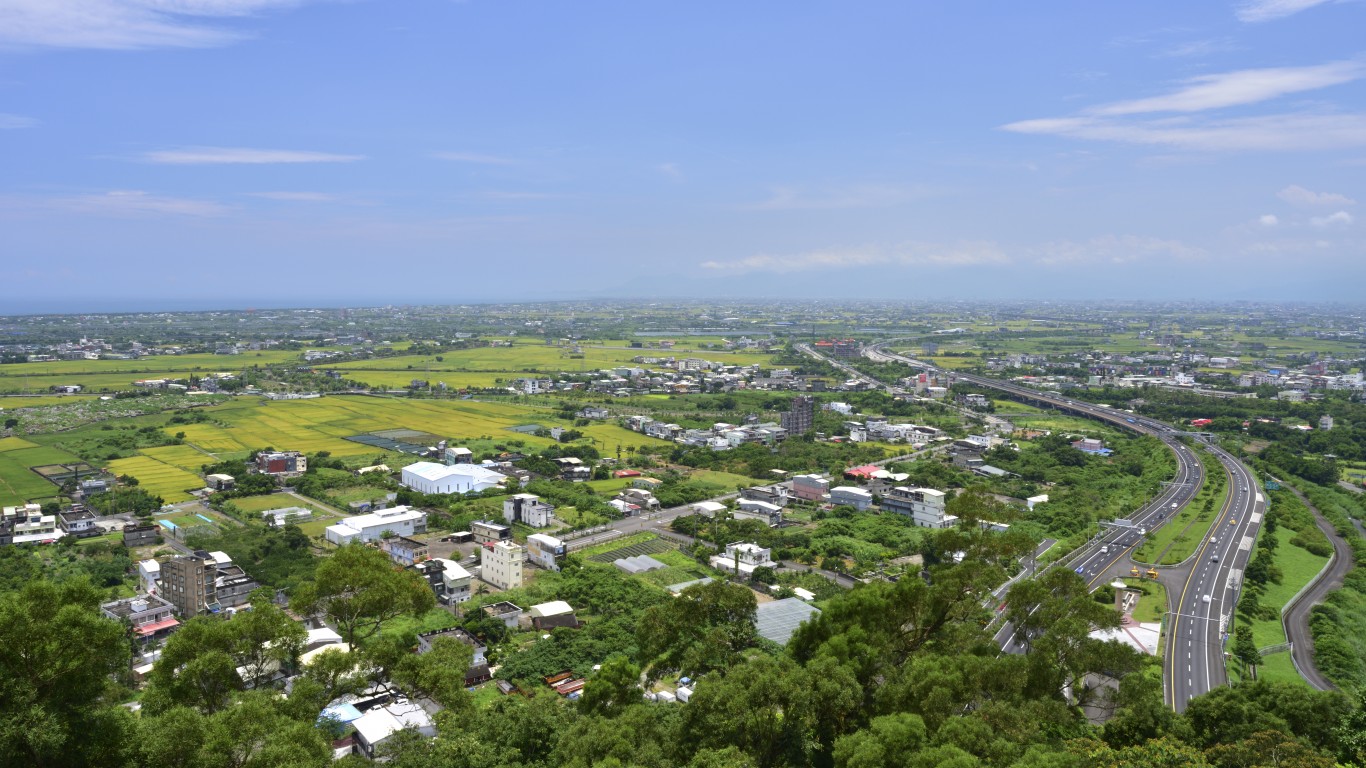
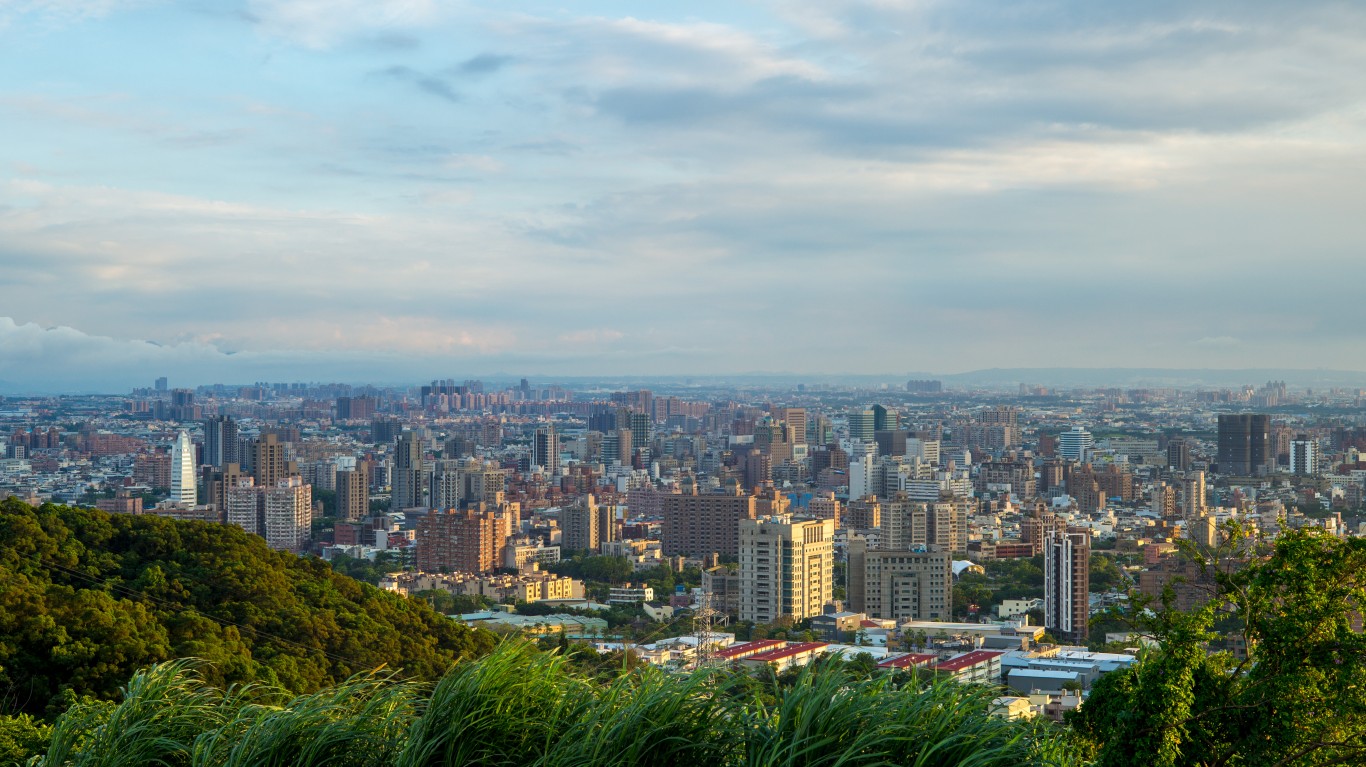
48. Yilan, Taiwan
> Total emissions in 2013: 8.18 million tons of CO2 equivalent
> Transport, industrial, waste, and local power plants: 6.91 million tons of CO2 equivalent — #36 most in study
> Grid-supplied energy produced outside the city boundary: 1.27 million tons of CO2 equivalent — #68 most in study
> Population in 2013: 95,000
Taiwan has been criticized for a lack of ambition in reducing carbon emissions, as reflected in its modest goal of 50% emission reductions by 2050, and its slowness in working toward that goal; it is still lacking a comprehensive plan. On the positive side, while its mix of energy sources remains very low in renewables, it is second only to China among Asian countries employing offshore wind.

47. Hiroshima, Japan
> Total emissions in 2014: 8.68 million tons of CO2 equivalent
> Transport, industrial, waste, and local power plants: N/A
> Grid-supplied energy produced outside the city boundary: N/A
> Population in 2014: 1.2 million
Hiroshima has been taking climate change seriously, both in terms of carbon reduction and adaptation, having suffered punishing rain events in recent years. Still, with population and the economy growing, the city has not made headway on its plan to reduce greenhouse gas emissions by 80% by 2050. In the meantime, Japan’s prime minister has tightened the goals for the country, joining the European Union in its quest for carbon neutrality by 2050 by phasing out coal and reducing energy demand.
[in-text-ad-2]

Source: Sean Pavone / iStock via Getty Images
46. Denver, Colorado, USA
> Total emissions in 2014: 8.94 million tons of CO2 equivalent
> Transport, industrial, waste, and local power plants: 4.56 million tons of CO2 equivalent — #50 most in study
> Grid-supplied energy produced outside the city boundary: 4.39 million tons of CO2 equivalent — #36 most in study
> Population in 2014: 664,000
Recognizing that cities are responsible for 70% of greenhouse gas emissions, Denver adopted a climate action plan in 2018, replete with lofty sector by sector goals and suggested means of achieving them. Since then, a city-appointed task force has recommended tougher goals, including zero emissions by 2050, specific recommended actions, and funding mechanisms for implementing a revised plan. The task force has called for retrofitting homes and buildings for energy efficiency, electrifying the city’s bus fleet, and reconfiguring the city’s streets to allow more space for bicycles, pedestrians, and street vendors.
Source: Barry Williams / Getty Images
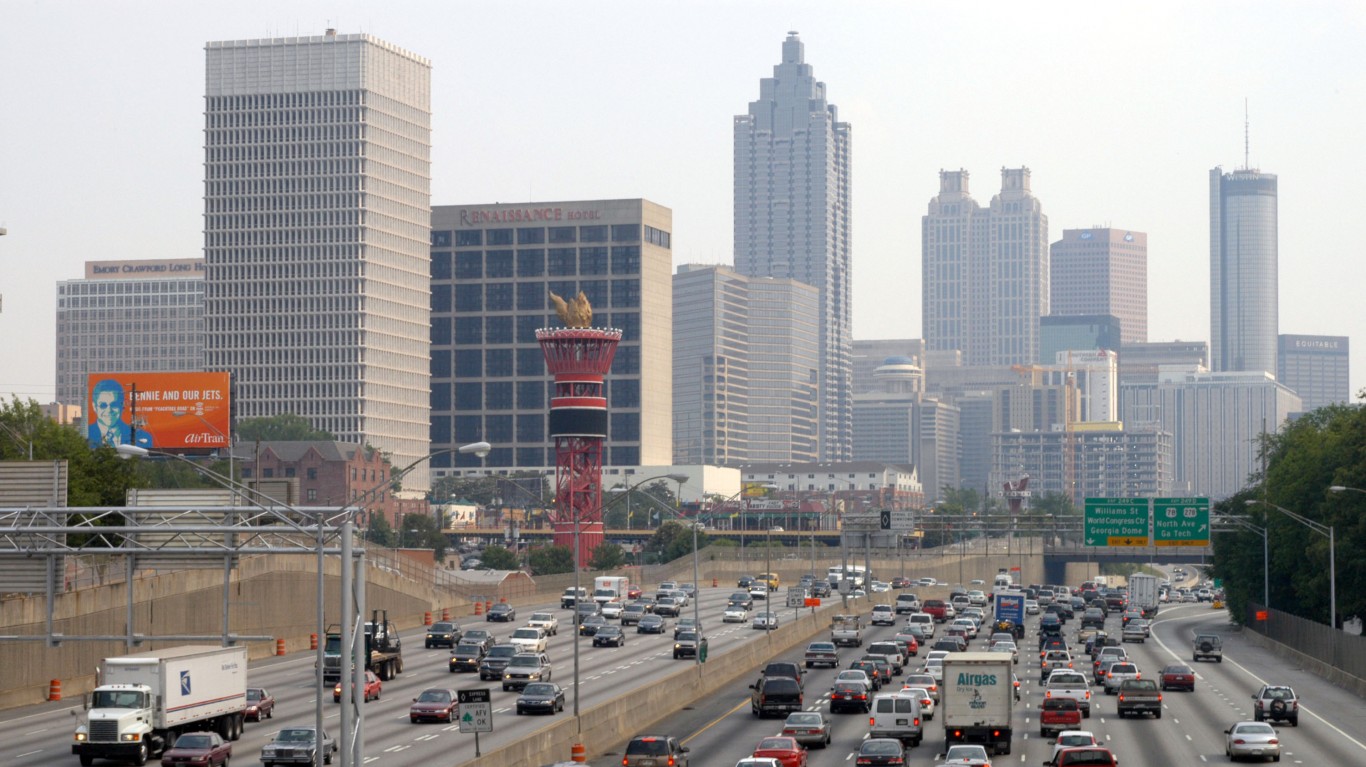
45. Atlanta, Georgia, USA
> Total emissions in 2014: 9.02 million tons of CO2 equivalent
> Transport, industrial, waste, and local power plants: 3.55 million tons of CO2 equivalent — #57 most in study
> Grid-supplied energy produced outside the city boundary: 5.48 million tons of CO2 equivalent — #33 most in study
> Population in 2014: 440,000
Atlanta has put together a climate action plan and a set of aggressive emission reduction goals, including having all residences and other buildings rely on renewable energy by 2035. The Plan was lauded by Al Gore in his encouragement for cities to step up in the absence of federal action. But a goal is not an accomplishment in and of itself, and Atlanta is falling short, in large measure because energy utilities control the fuel mix for available electricity.
[in-text-ad]

Source: Eloi_Omella / E+ via Getty Images
44. Madrid, Spain
> Total emissions in 2013: 10.26 million tons of CO2 equivalent
> Transport, industrial, waste, and local power plants: 6.80 million tons of CO2 equivalent — #37 most in study
> Grid-supplied energy produced outside the city boundary: 3.25 million tons of CO2 equivalent — #46 most in study
> Population in 2013: 3.2 million
A member of the Association of Cities and Regions for Sustainable Resource Management (ACRR), and other municipal organizations focused on sustainability, Madrid unveiled its “Roadmap toward carbon neutrality” via an action based plan called “Madrid 360.” The plan focuses on decarbonizing the electricity system, and minimizing consumption of fossil fuels. And action has begun, with free electric bus routes and infrastructure changes that encourage bicycles and pedestrian traffic.

43. Detroit, Michigan, USA
> Total emissions in 2012: 10.33 million tons of CO2 equivalent
> Transport, industrial, waste, and local power plants: 5.52 million tons of CO2 equivalent — #43 most in study
> Grid-supplied energy produced outside the city boundary: 4.81 million tons of CO2 equivalent — #35 most in study
> Population in 2012: 721,000
Two years ago Detroit passed an ordinance by unanimous vote of the City Council committing to a range of climate change goals. As a first step the City will update its emissions inventory every four years to monitor the effectiveness of its efforts. A new Office of Sustainability has published an Action Agenda with 43 action items, including the expansion of a green jobs training program and the development of an electric vehicle infrastructure strategy.

Source: huafires / iStock via Getty Images
42. Auckland, New Zealand
> Total emissions in 2013: 10.47 million tons of CO2 equivalent
> Transport, industrial, waste, and local power plants: 9.13 million tons of CO2 equivalent — #30 most in study
> Grid-supplied energy produced outside the city boundary: 1.34 million tons of CO2 equivalent — #67 most in study
> Population in 2013: 1.3 million
In 2018 Auckland had the highest CO2 emissions than any other region in New Zealand, and emissions continue to grow, along with Auckland’s population, despite the adoption of a Climate Plan. On a per capita basis, however, Auckland was one of the two lowest emitting regions, with most of the country’s CO2 coming from agriculture, rather than heating and cooling, manufacturing, and automobiles, the primary urban sources.
[in-text-ad-2]

Source: pawel.gaul / E+ via Getty Images
41. Columbus, Ohio, USA
> Total emissions in 2015: 10.98 million tons of CO2 equivalent
> Transport, industrial, waste, and local power plants: 5.49 million tons of CO2 equivalent — #44 most in study
> Grid-supplied energy produced outside the city boundary: 5.50 million tons of CO2 equivalent — #32 most in study
> Population in 2015: 825,000
Like cities all over the world, Columbus has seen at least one climate benchmark come and go without measurable progress. In fact, its CO2 emissions rose by 2.3% between 2013 and 2019, despite its goal to reduce emissions by 20% in 2020. At this moment Columbus is seeking public comments as it moves to complete a plan for achieving carbon neutrality by 2050.

Source: Jolanta Dyr / Wikimedia Commons
40. Warsaw, Poland
> Total emissions in 2014: 11.72 million tons of CO2 equivalent
> Transport, industrial, waste, and local power plants: 7.93 million tons of CO2 equivalent — #32 most in study
> Grid-supplied energy produced outside the city boundary: 3.79 million tons of CO2 equivalent — #42 most in study
> Population in 2014: 1.7 million
Poland is the only country in the European Union that failed to endorse the goal of carbon neutrality by 2050 when the bloc set the goal in 2019. This was because of the degree to which Poland’s economy and energy consumption is tied to coal production, which supplies 75% of the country’s energy. This past April, however, its president told the participants at the White House virtual summit that Poland was committed to creating a zero emission system in the next twenty years. Critics point out that the promise runs counter to Poland’s energy strategy, which is to reduce reliance on, but not eliminate, coal.
[in-text-ad]
Source: Arturo Rosenow / iStock via Getty Images
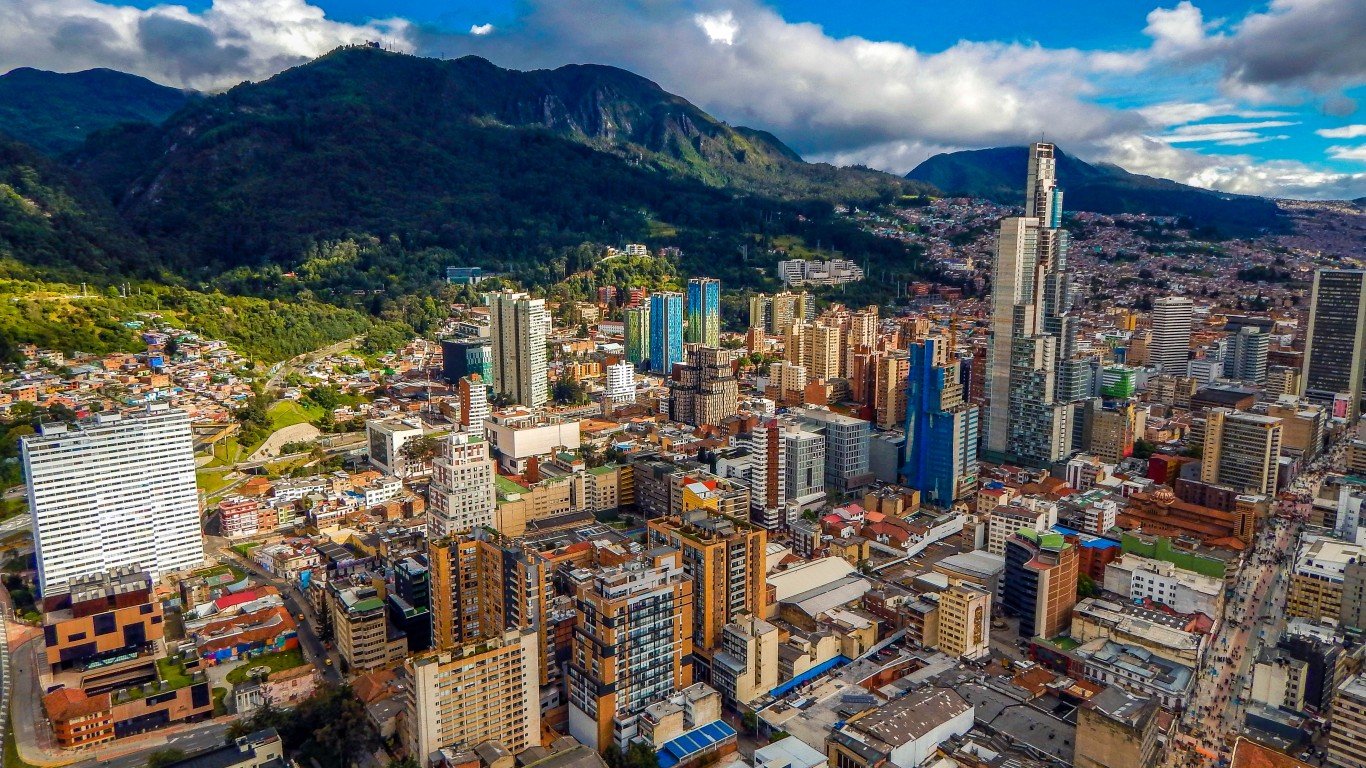
39. Bogotá, Colombia
> Total emissions in 2015: 12.36 million tons of CO2 equivalent
> Transport, industrial, waste, and local power plants: 10.68 million tons of CO2 equivalent — #25 most in study
> Grid-supplied energy produced outside the city boundary: 1.09 million tons of CO2 equivalent — #75 most in study
> Population in 2015: 7.8 million
Bogota is one of about 100 cities around the world that have come together as the C40 Cities Climate Leadership Group network, committed to spurring action on clean energy and climate adaptation. As most of Bogotá’s carbon output is from the transportation sector, the city is focusing on improving bike and pedestrian travel, employing electric buses, and building electric cable cars to service some of its poorest citizens living in its hills.
Source: Sami99tr / Wikimedia Commons
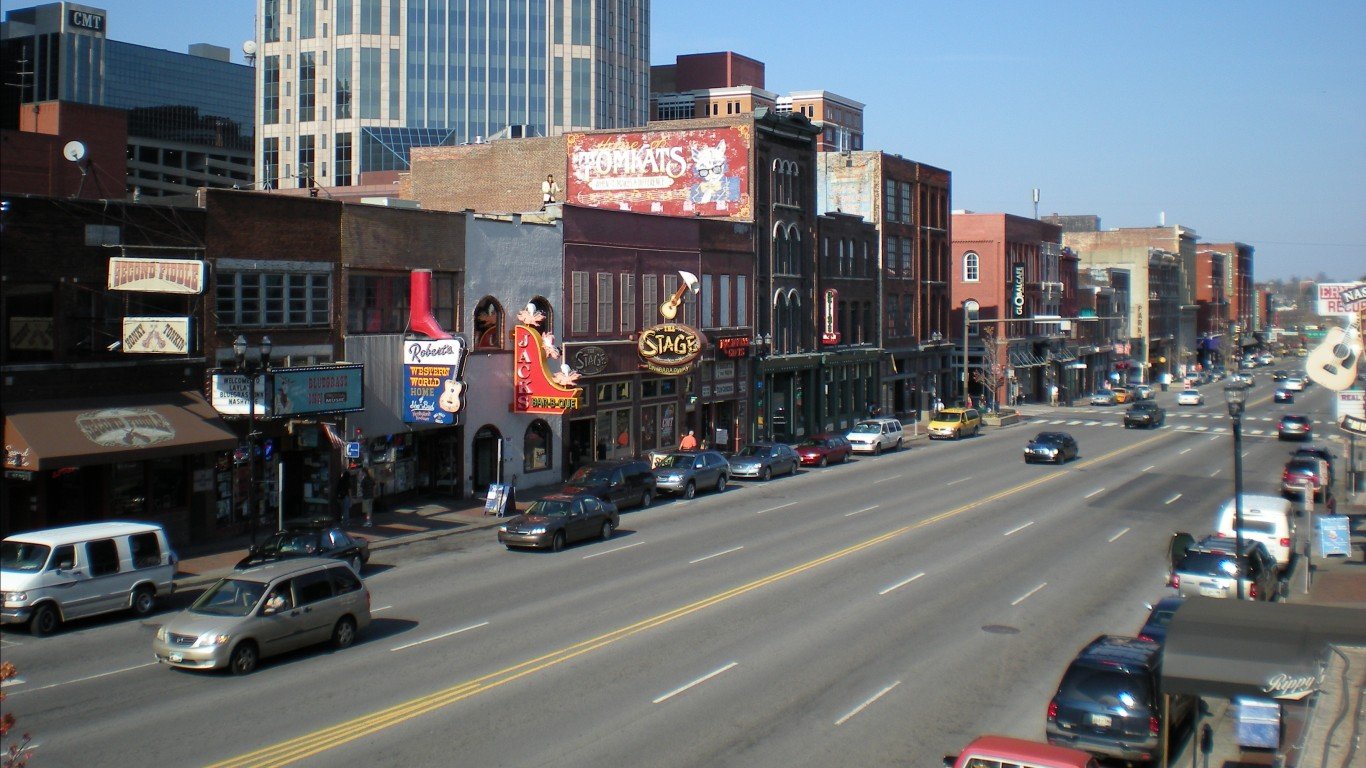
38. Nashville and Davidson County, Tennessee, USA
> Total emissions in 2014: 12.48 million tons of CO2 equivalent
> Transport, industrial, waste, and local power plants: 6.68 million tons of CO2 equivalent — #38 most in study
> Grid-supplied energy produced outside the city boundary: 5.80 million tons of CO2 equivalent — #30 most in study
> Population in 2014: 670,000
Nashville’s mayor, John Cooper, who came into office only two years ago, has already put together a climate change and sustainability plan and has begun acting on it, by, for example,
strengthening green building standards, purchasing zero emission vehicles for city use, and reaching an agreement with the local power company to provide significantly more solar power.

Source: SeanPavonePhoto / iStock via Getty Images
37. Nagoya, Japan
> Total emissions in 2013: 13.42 million tons of CO2 equivalent
> Transport, industrial, waste, and local power plants: 7.69 million tons of CO2 equivalent — #34 most in study
> Grid-supplied energy produced outside the city boundary: 5.73 million tons of CO2 equivalent — #31 most in study
> Population in 2013: 2.1 million
In October of 2020 Japan became one of 130 countries that have set or are considering setting a target of net zero carbon emissions by 2050. However, perhaps more than most of the other countries in the group, Japan faces unique challenges in replacing fossil fuels with renewables; its deep ocean waters and mountainous terrain discourage wind and solar installations.
[in-text-ad-2]

Source: RoschetzkyIstockPhoto / iStock via Getty Images
36. Austin, Texas, USA
> Total emissions in 2013: 13.70 million tons of CO2 equivalent
> Transport, industrial, waste, and local power plants: 6.44 million tons of CO2 equivalent — #40 most in study
> Grid-supplied energy produced outside the city boundary: 7.26 million tons of CO2 equivalent — #24 most in study
> Population in 2013: 837,000
Noting that Austin is already experiencing climate impacts in the form of floods, wildfires, extreme heat, and even winter storms, the City Council has recently tightened its emission reduction goals. A draft Climate Equity Plan proposes steep reductions in the coming years through increased housing density (to reduce automobile miles), green building standards, and a transition to eclectic transportation.

Source: Alexey_Fedoren / iStock via Getty Images
35. Manchester, United Kingdom
> Total emissions in 2013: 14.89 million tons of CO2 equivalent
> Transport, industrial, waste, and local power plants: 9.59 million tons of CO2 equivalent — #29 most in study
> Grid-supplied energy produced outside the city boundary: 5.30 million tons of CO2 equivalent — #34 most in study
> Population in 2013: 512,000
In 2019, Manchester declared a climate emergency and set a goal of net zero emissions by 2038, 12 years ahead of the most ambitious cities and countries. It is building on its success at halving its emissions between 2010 and 2020 by, among other things, planting thousands of trees, retrofitting government buildings, replacing street lights with LED lighting, electrifying its garbage truck fleet, and spending millions of dollars to enhance walking and biking infrastructure
[in-text-ad]

Source: Sean3810 / iStock via Getty Images
34. Taipei City, Taiwan
> Total emissions in 2014: 14.96 million tons of CO2 equivalent
> Transport, industrial, waste, and local power plants: 6.49 million tons of CO2 equivalent — #39 most in study
> Grid-supplied energy produced outside the city boundary: 8.46 million tons of CO2 equivalent — #21 most in study
> Population in 2014: 2.5 million
In addition to the risks Taiwan faces from extreme weather and rising seas, this year it has suffered its worst drought in 50 years because of the failure of typhoons to bring needed rains. Taiwan is setting its sights on surpassing China’s targets for emission reduction, with its key tragedy transitioning from coal to liquified natural gas.
 24/7 Wall St.
Source: Arnold Petersen / iStock via Getty Images
33. Pretoria Tshwane, South Africa
> Total emissions in 2015: 15.24 million tons of CO2 equivalent
> Transport, industrial, waste, and local power plants: 4.65 million tons of CO2 equivalent — #48 most in study
> Grid-supplied energy produced outside the city boundary: 10.59 million tons of CO2 equivalent — #16 most in study
> Population in 2015: 2.1 million
In 2009 the UN opened an office in Pretoria as a center for environmental policy throughout the southern African region. Together with the government of South Africa and the help of several other countries and international organizations, the UN began implementing projects to address climate change, as well as other environmental problems. The government of South Africa itself has been a leader in moving to renewables, having passed a carbon tax in 2019, which is projected to reduce the country’s emissions by 33% by 2035.

Source: Sean Pavone / iStock via Getty Images
32. San Antonio, Texas USA
> Total emissions in 2013: 15.73 million tons of CO2 equivalent
> Transport, industrial, waste, and local power plants: 7.21 million tons of CO2 equivalent — #35 most in study
> Grid-supplied energy produced outside the city boundary: 8.52 million tons of CO2 equivalent — #20 most in study
> Population in 2013: 1.4 million
In a state that has not embraced the science and predictions that give urgency to the climate crisis, San Antonia had an uphill battle in its two-year effort to create a climate action plan. In the end, the 2019 plan has lofty goals, but few specifics, failing to even address coal burning in the face of industry pressure. Still, the city itself is taking the first steps by retrofitting government buildings for efficiency and use of renewables.
[in-text-ad-2]

Source: benedek / E+ via Getty Images
31. Hamilton, ON, Canada
> Total emissions in 2012: 16.47 million tons of CO2 equivalent
> Transport, industrial, waste, and local power plants: 6.30 million tons of CO2 equivalent — #41 most in study
> Grid-supplied energy produced outside the city boundary: 10.16 million tons of CO2 equivalent — #17 most in study
> Population in 2012: 727,000
Like many cities around the world, Hamilton recognizes the threats posed by climate change and, also like many cities, it has joined coalitions, created community dialogue, engaged industry and other partners, undertaken assessments to create baseline information on emissions, drafted reports, created task forces and commissions, and developed plans and strategies for meeting self imposed reduction goals. Unlike many other cities, however, Hamilton is showing significant progress. In 2007 it set a goal of reducing its energy intensity by 20% in 2020; it met the goal in 2013, seven years early.

Source: benedek / E+ via Getty Images
30. Edmonton, Canada
> Total emissions in 2014: 16.58 million tons of CO2 equivalent
> Transport, industrial, waste, and local power plants: 10.22 million tons of CO2 equivalent — #27 most in study
> Grid-supplied energy produced outside the city boundary: 6.36 million tons of CO2 equivalent — #28 most in study
> Population in 2014: 878,000
Two summers ago, facing wildfire smoke in the air and protests in the street, the city of Emondton declared a climate emergency and, setting goals consistent with world leadership, began taking emission reduction seriously. This past summer the CBC took a look at the eight major recommendations of the city’s climate strategy and found that in just two years the city had made progress on all of them.
[in-text-ad]

Source: yaophotograph / iStock via Getty Images
29. New Taipei, Taiwan
> Total emissions in 2014: 17.23 million tons of CO2 equivalent
> Transport, industrial, waste, and local power plants: 6.15 million tons of CO2 equivalent — #42 most in study
> Grid-supplied energy produced outside the city boundary: 11.08 million tons of CO2 equivalent — #14 most in study
> Population in 2014: 4.0 million
New Taipei is Taiwan’s most populous city, with tightly clustered skyscrapers and streets clogged with autos and motorcycles. Determined to transform every aspect of city life towards sustainability, the city has made remarkable strides: educating the public in hundreds of communities; greening roofs; creating miles of bicycle lanes, light rail and carpooling routes; installing hundreds of charging stations for automobiles and eclectic bikes; and expanding the use of renewable energy sources.
Source: DouglasOlivares / iStock via Getty Images
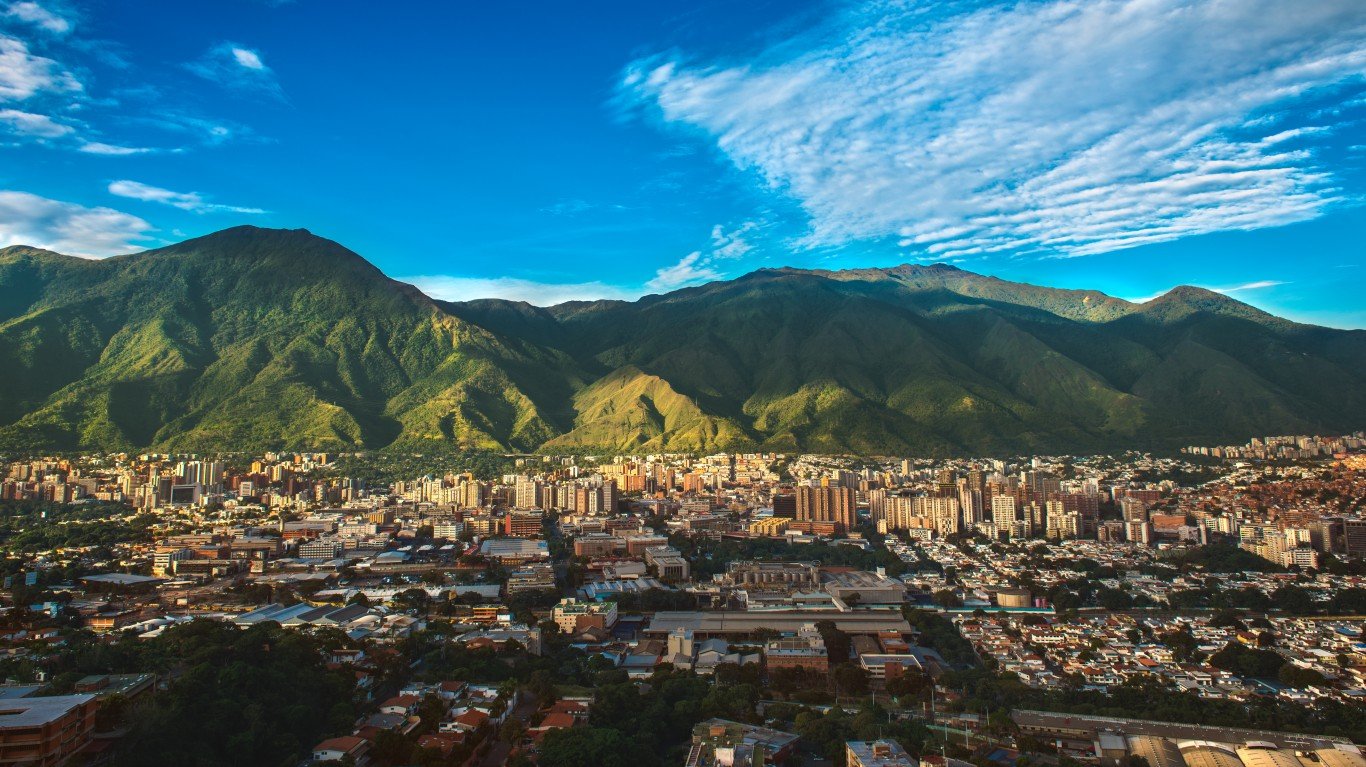
28. Caracas, Venezuela
> Total emissions in 2015: 17.77 million tons of CO2 equivalent
> Transport, industrial, waste, and local power plants: 14.36 million tons of CO2 equivalent — #19 most in study
> Grid-supplied energy produced outside the city boundary: 3.41 million tons of CO2 equivalent — #45 most in study
> Population in 2015: 2.1 million
As an oil producing country, addressing greenhouse gas emissions would be fraught in any event, but the economic, public health, and food shortage crises under the current repressive regime have pushed climate far down the list of government concerns. In response to U.S. President Biden’s climate summit last spring, Venezuela’s foreign affairs minister denounced United States leadership on the issue, arguing that capitalism cannot effectively address climate change.

Source: jewhyte / iStock via Getty Images
27. Calgary, Canada
> Total emissions in 2015: 18.21 million tons of CO2 equivalent
> Transport, industrial, waste, and local power plants: 10.45 million tons of CO2 equivalent — #26 most in study
> Grid-supplied energy produced outside the city boundary: 7.76 million tons of CO2 equivalent — #23 most in study
> Population in 2015: 1.2 million
Calgary has an advantage over most cities in moving toward greener energy–the energy utility is a wholly owned subsidiary, allowing for more grounded planning within its own budget and set of priorities. One of the city’s proudest initiatives is electrifying transportation, beginning with its own fleets, from garbage trucks to Zambonis.
[in-text-ad-2]

Source: diegograndi / iStock via Getty Images
26. Toronto, Canada
> Total emissions in 2013: 18.32 million tons of CO2 equivalent
> Transport, industrial, waste, and local power plants: 16.15 million tons of CO2 equivalent — #16 most in study
> Grid-supplied energy produced outside the city boundary: 2.17 million tons of CO2 equivalent — #59 most in study
> Population in 2013: 2.8 million
Using several mitigation strategies, including investments in public transport and traffic management, Toronto has already reduced its greenhouse gas emissions by 37% from 1990 levels. Understanding that the city can and should do more, the City Council has charged staff with creating a “TransformTO” net zero strategy, which will be completed this fall.

Source: gangliu10 / iStock via Getty Images
25. Philadelphia, Pennsylvania, USA
> Total emissions in 2012: 19.21 million tons of CO2 equivalent
> Transport, industrial, waste, and local power plants: 12.40 million tons of CO2 equivalent — #21 most in study
> Grid-supplied energy produced outside the city boundary: 6.82 million tons of CO2 equivalent — #25 most in study
> Population in 2012: 1.5 million
In January of this year, Philadelphia published its Climate Action Playbook committing to eliminating its contribution to climate change, primarily in three sectors: buildings and industry, transportation, and waste management. The first of these is responsible for 70% of the city’s emissions, prompting aggressive action. Under a new Building Efficiency Performance Policy, all non-residential buildings of over 50,000 will have to submit a certificate of high-energy or bring existing energy systems into good repair.
[in-text-ad]

Source: Grafissimo / E+ via Getty Images
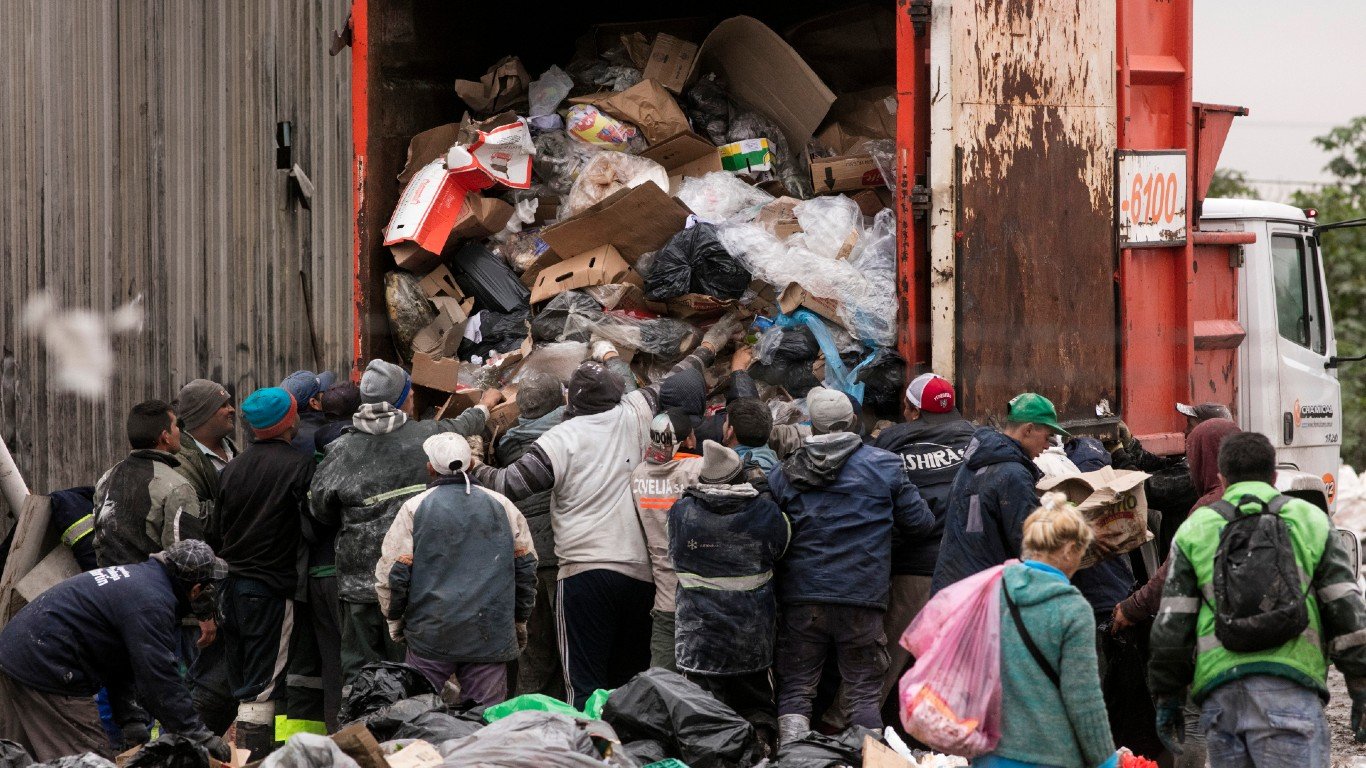
24. Buenos Aires, Argentina
> Total emissions in 2014: 19.67 million tons of CO2 equivalent
> Transport, industrial, waste, and local power plants: 15.56 million tons of CO2 equivalent — #18 most in study
> Grid-supplied energy produced outside the city boundary: 4.11 million tons of CO2 equivalent — #38 most in study
> Population in 2014: 3.0 million
Argentina has set emissions goals, but its policies are seen as insufficient to reach those goals: while investing in alternative energy, it continues to subsidize fossil fuels; while pursuing a policy to incentivize electric vehicles, the transportation sector remains responsible for the highest levels of emissions compared to other sectors; and while the government has passed a carbon tax, it is too low to affect a shift in energy use.
 24/7 Wall St.
Source: microgen / iStock via Getty Images
23. Rio de Janeiro, Brazil
> Total emissions in 2012: 20.27 million tons of CO2 equivalent
> Transport, industrial, waste, and local power plants: 16.17 million tons of CO2 equivalent — #15 most in study
> Grid-supplied energy produced outside the city boundary: 4.10 million tons of CO2 equivalent — #39 most in study
> Population in 2012: 5.5 million
Burdened by violence, inequality, low GDP, and drug trafficking, Rio is not in an ideal position to take on climate challenges, even as it faces ever more deadly heat waves, devastating storms, and sea level rise. Worsening the city and country’s climate status is their heavy reliance on coal and the rapid depletion of the rainforest, which otherwise could provide an inexpensive means of mitigating climate change.
Source: SeanPavonePhoto / iStock via Getty Images
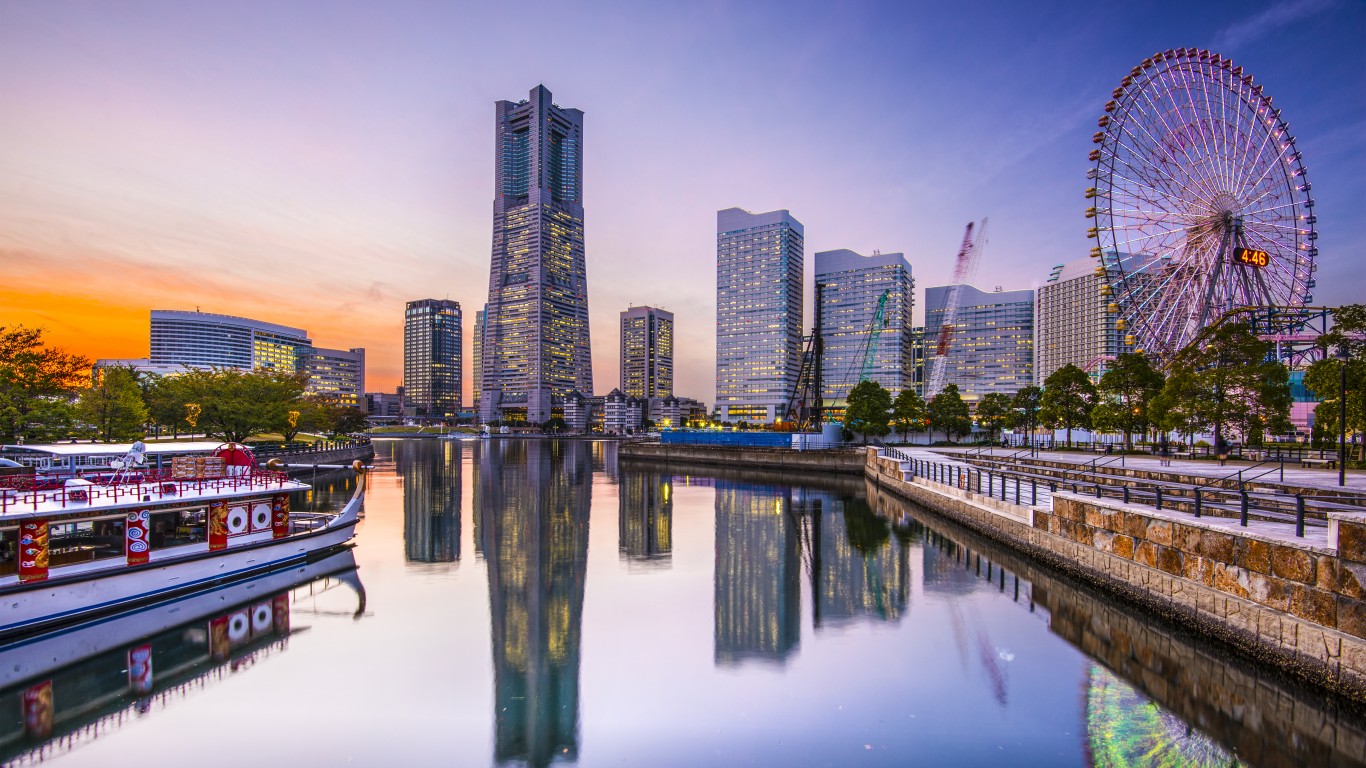
22. Yokohama, Japan
> Total emissions in 2013: 21.95 million tons of CO2 equivalent
> Transport, industrial, waste, and local power plants: 12.57 million tons of CO2 equivalent — #20 most in study
> Grid-supplied energy produced outside the city boundary: 9.38 million tons of CO2 equivalent — #19 most in study
> Population in 2013: 3.6 million
Yokohama may not be on track to meet its aggressive climate goals, but its progress to date and its determination offer positive signs that it can succeed. Even before the worldwide goal- setting marathon of the last few years, the city had begun the hard work of reducing CO2 emissions in 2008 through energy conservation, raising public consciousness, and finding innovative ways to advance green technology.
[in-text-ad-2]

Source: michaeljung / iStock via Getty Images
21. Durban, South Africa
> Total emissions in 2014: 22.59 million tons of CO2 equivalent
> Transport, industrial, waste, and local power plants: 11.68 million tons of CO2 equivalent — #23 most in study
> Grid-supplied energy produced outside the city boundary: 10.91 million tons of CO2 equivalent — #15 most in study
> Population in 2014: 3.0 million
Climate related heat waves, floods, and droughts cannot be separated from the rest of Durban’s problems: poverty, widespread unemployment, and government corruption among them. Although the city has published bold plans for climate action, the public has not been involved, and the highly polluting petrochemical industry is an impediment to progress.
Source: Kierran1 / iStock via Getty Images
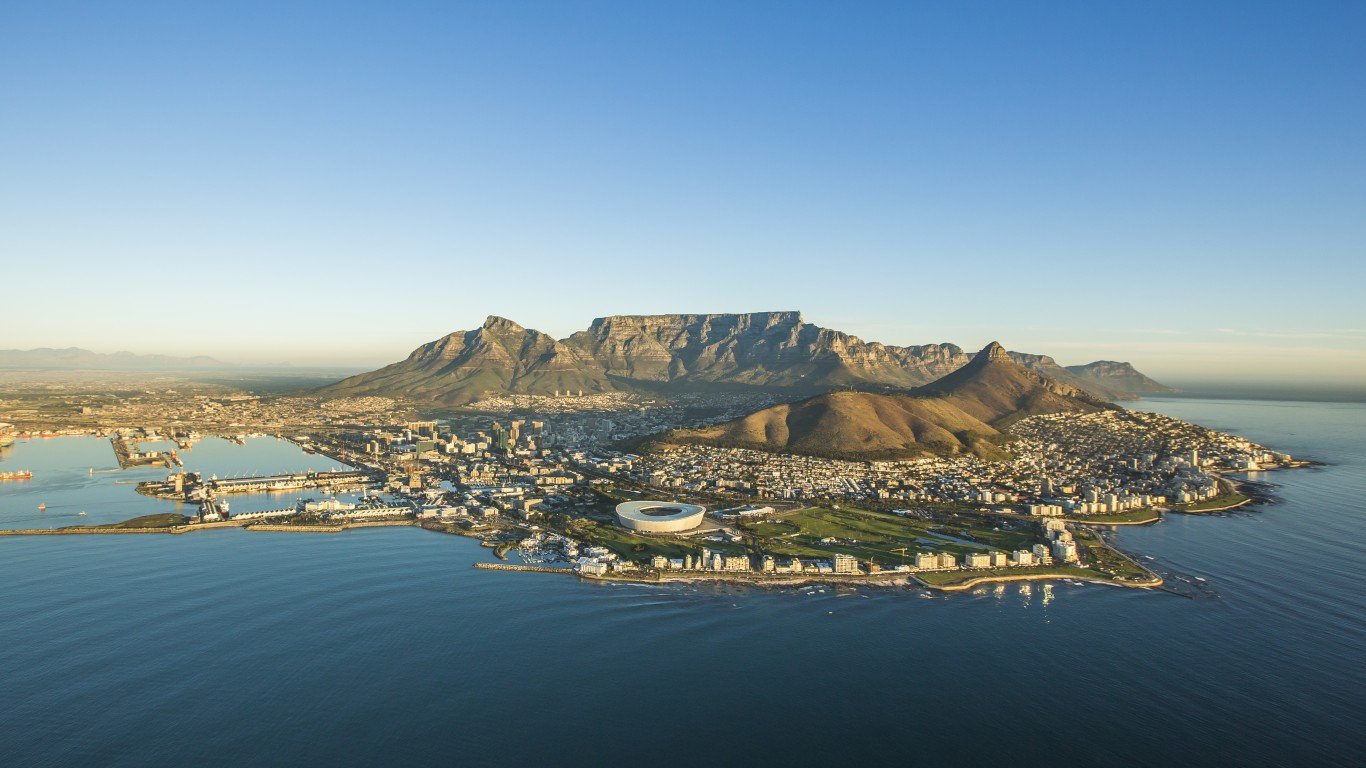
20. Cape Town, South Africa
> Total emissions in 2012: 22.64 million tons of CO2 equivalent
> Transport, industrial, waste, and local power plants: 9.78 million tons of CO2 equivalent — #28 most in study
> Grid-supplied energy produced outside the city boundary: 12.86 million tons of CO2 equivalent — #12 most in study
> Population in 2012: 3.8 million
Climate Scorecard, an international organization that monitors and advocates for greenhouse gas emission reduction, has proclaimed Cape Town as the standard setter for climate mitigation strategies, not just for South Africa, but for the entire African continent. In addition to transportation and waste planning, Cape Town is looking to increase energy efficiency based on distributed energy, whereby power is generated close to where it is used.
[in-text-ad]

Source: Torresigner / E+ via Getty Images
19. Mexico City, Mexico
> Total emissions in 2014: 23.66 million tons of CO2 equivalent
> Transport, industrial, waste, and local power plants: 16.84 million tons of CO2 equivalent — #14 most in study
> Grid-supplied energy produced outside the city boundary: 6.81 million tons of CO2 equivalent — #26 most in study
> Population in 2014: 8.9 million
Although Mexico has been expressing a commitment to combating climate change since at least 2012, it appears to be doing very little. Its CO2 emissions rose by over 74% between 1990 and 2018, and it has failed to publish data on the progress of its efforts. In 2021, the country’s environmental budget was reduced, and a preference for renewables in the energy sector was eliminated.
 24/7 Wall St.
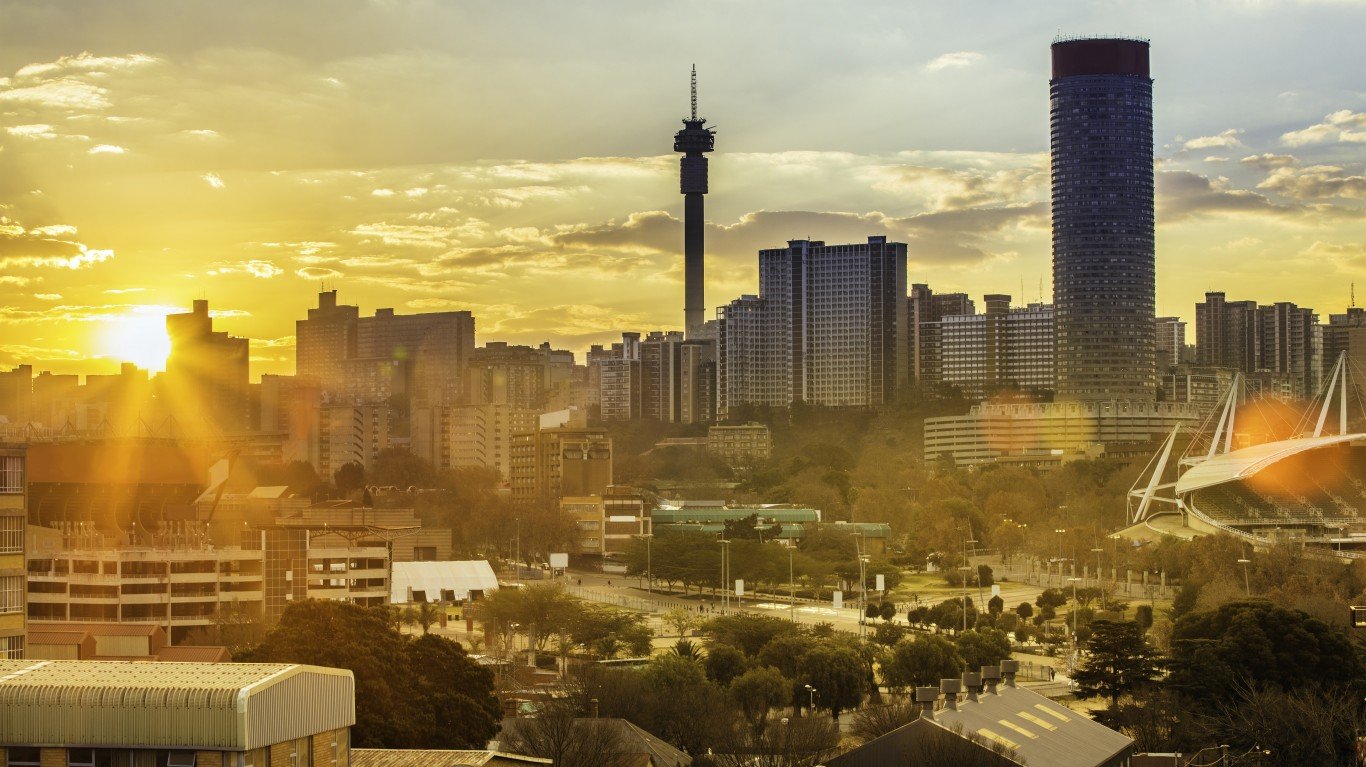
Source: THEGIFT777 / E+ via Getty Images
18. Johannesburg, South Africa
> Total emissions in 2014: 24.72 million tons of CO2 equivalent
> Transport, industrial, waste, and local power plants: 9.07 million tons of CO2 equivalent — #31 most in study
> Grid-supplied energy produced outside the city boundary: 15.66 million tons of CO2 equivalent — #5 most in study
> Population in 2014: 4.8 million
South Africa’s biggest climate challenge is its strong reliance on coal as its primary energy source. Progress does not seem to be in the works in any significant way, with the government continuing to support coal mining, offering huge exemptions from its carbon tax, and delaying alternative energy projects.
Source: nala_rinaldo / RooM via Getty Images
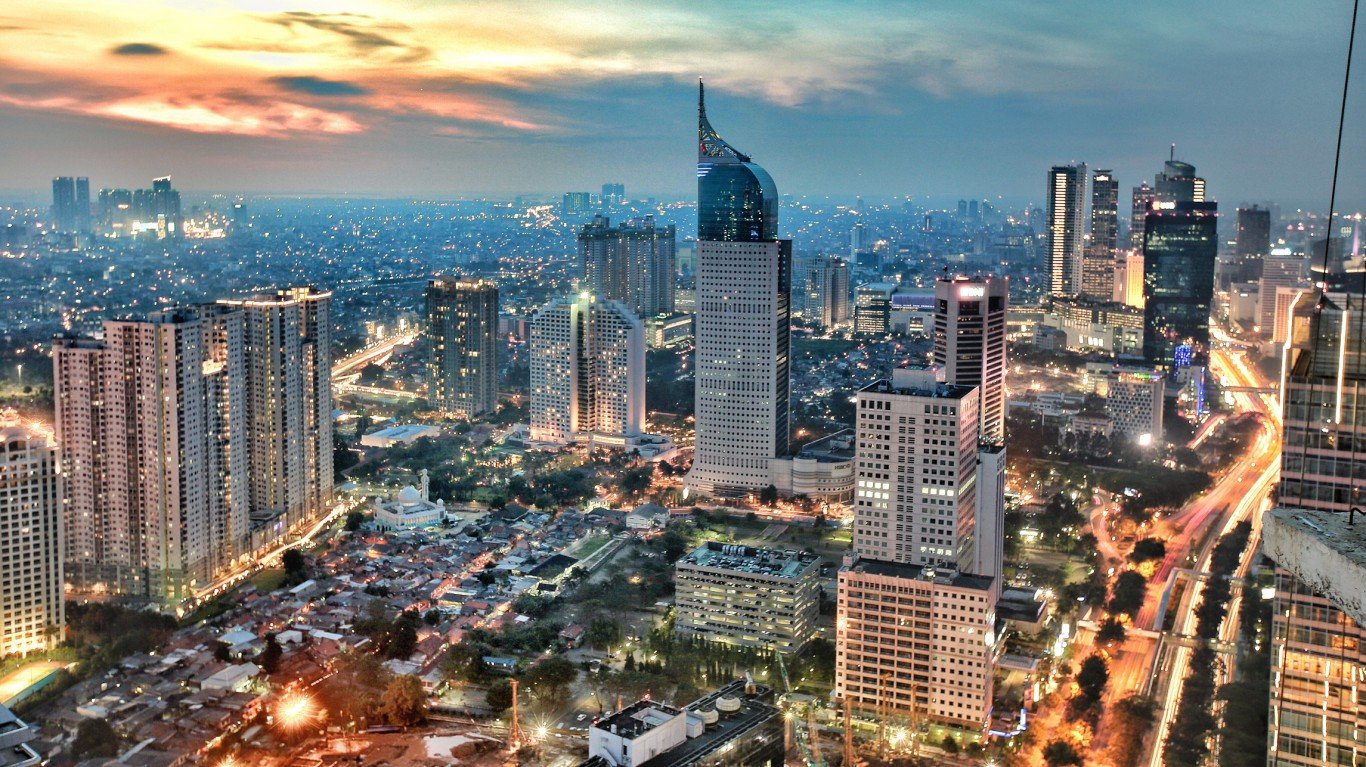
17. Jakarta, Indonesia
> Total emissions in 2014: 27.78 million tons of CO2 equivalent
> Transport, industrial, waste, and local power plants: N/A
> Grid-supplied energy produced outside the city boundary: N/A
> Population in 2014: 10.1 million
Between 2013 and 2018, Indonesia’s CO2 emissions increased by over 300%. And the country did not seem to hear the climate wake up call when 60 people died in floods after a historic rain event in 2018. The island nation is not seriously addressing climate change, though it is threatened by sea level rise, increasingly intense monsoons, and regular flooding.
[in-text-ad-2]
Source: Christian Vinces / iStock via Getty Images
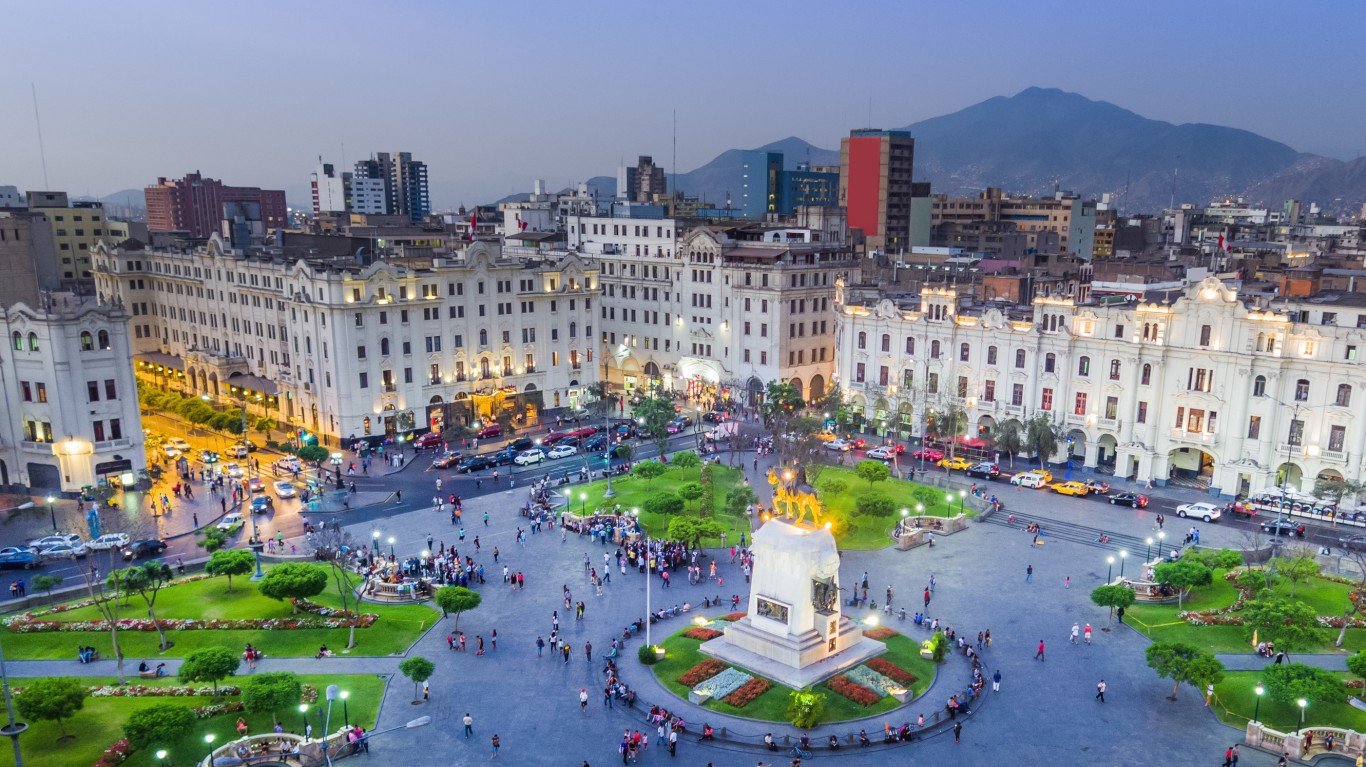
16. Lima, Peru
> Total emissions in 2012: 27.81 million tons of CO2 equivalent
> Transport, industrial, waste, and local power plants: 12.38 million tons of CO2 equivalent — #22 most in study
> Grid-supplied energy produced outside the city boundary: 15.43 million tons of CO2 equivalent — #6 most in study
> Population in 2012: 9.2 million
Peru’s beginning gestures to sustainability are small but provide some encouragement that climate is being addressed. Peru is working with its cities to create bicycle infrastructure and it has made a plan for small business assistance financing to transition from economic help to climate mitigation when the economy improves. It is also accepting climate funding from Switzerland pursuant to a deal whereby Switzerland gets credit for emission reductions.

Source: adamkaz / E+ via Getty Images
15. Los Angeles, California, USA
> Total emissions in 2013: 29.02 million tons of CO2 equivalent
> Transport, industrial, waste, and local power plants: 19.60 million tons of CO2 equivalent — #11 most in study
> Grid-supplied energy produced outside the city boundary: 9.43 million tons of CO2 equivalent — #18 most in study
> Population in 2013: 3.8 million
Suffering in alarming measure from wildfires, drought, and water shortages, California has a history of facing environmental challenges, including climate change. Despite its perennially high CO2 emissions rates, it has been heroic in its decades of work to curb automobile emissions. Currently, its most populous city has many programs to reduce emissions, including pumping billions of dollars into its public transit systems and incentivizing changes in individual behavior.
[in-text-ad]
Source: peeterv / iStock via Getty Images
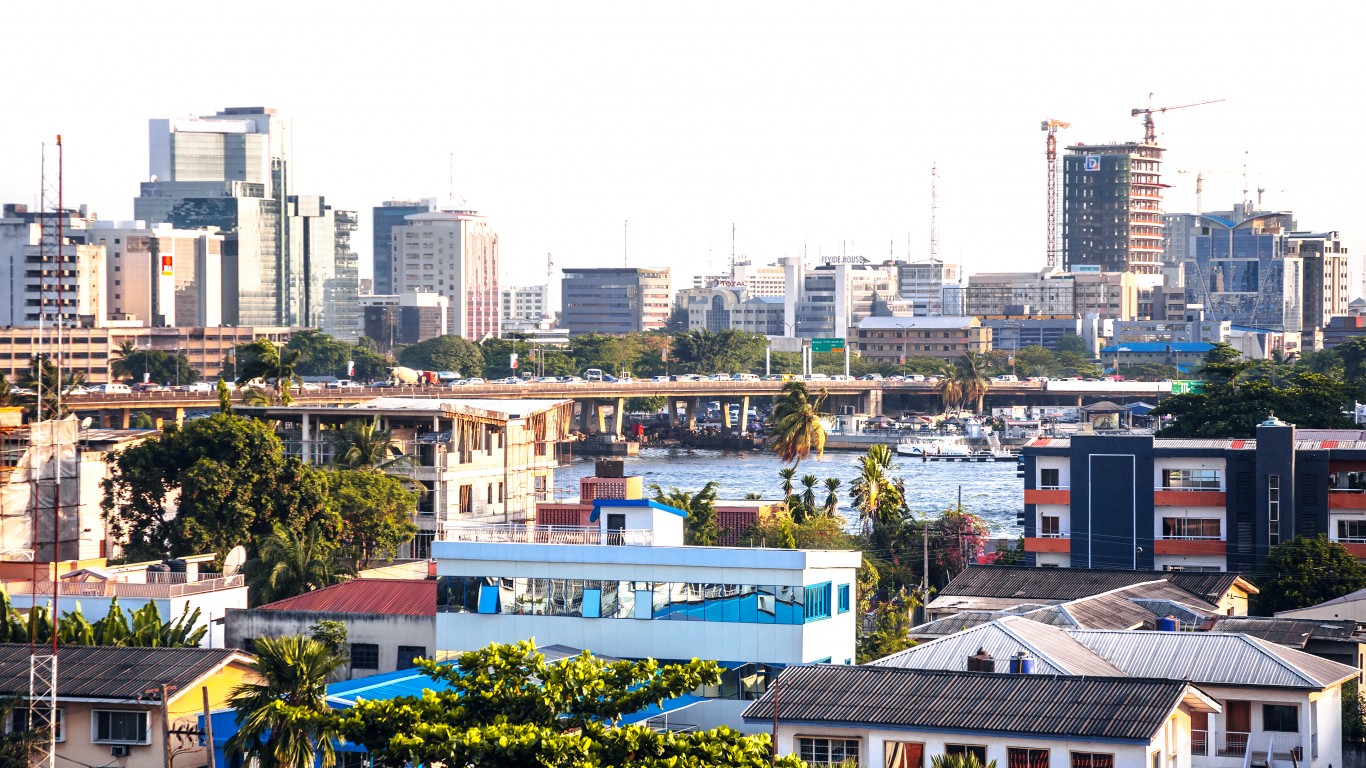
14. Lagos, Nigeria
> Total emissions in 2014: 29.43 million tons of CO2 equivalent
> Transport, industrial, waste, and local power plants: 29.43 million tons of CO2 equivalent — #5 most in study
> Grid-supplied energy produced outside the city boundary: N/A
> Population in 2014: 11.9 million
Africa’s largest city is congested and becoming more so, even as the streets flood regularly from torrential rains, exacerbated by an eroding coastline. Temperatures and sea level are on rise, threatening public health and the city’s very existence. For its part in reducing CO2 emissions, Lagos just announced a new five year climate plan, which touts the successes of previous plans: improved intermodal transport, tree planting projects, and some replacement of more polluting fuels with natural gas.

Source: f11photo / iStock via Getty Images
13. Las Vegas, Nevada, USA
> Total emissions in 2014: 29.66 million tons of CO2 equivalent
> Transport, industrial, waste, and local power plants: 11.00 million tons of CO2 equivalent — #24 most in study
> Grid-supplied energy produced outside the city boundary: 18.65 million tons of CO2 equivalent — #4 most in study
> Population in 2014: 597,000
With the possibility of Nevada’s temperatures rising 10 degrees this century, drying up its water supplies, the state issued a climate strategy report last December, the centerpiece of which is a plan to end gas consumption in buildings. The governor effectively admitted to the state’s formerly lax attitude toward climate, saying that “for the first time in Nevada’s history, we are doubling down to address climate change head-on.”

Source: JaySi / iStock via Getty Images
12. Chicago, Illinois, USA
> Total emissions in 2015: 29.92 million tons of CO2 equivalent
> Transport, industrial, waste, and local power plants: 16.95 million tons of CO2 equivalent — #13 most in study
> Grid-supplied energy produced outside the city boundary: 12.97 million tons of CO2 equivalent — #11 most in study
> Population in 2015: 2.7 million
Chicago has been working with local, regional, national, and international partners in producing a strategy, crafted with its regional metropolitan mayors and the help of NOAA, to reduce CO2 emissions by 80% by 2050. NOAA sees the plan, released this past summer, as a model of multijurisdictional cooperation, involving as it did, not only government agencies, but stakeholders from academia, communities, industry, and the nonprofit sector.
[in-text-ad-2]
Source: diegograndi / iStock via Getty Images
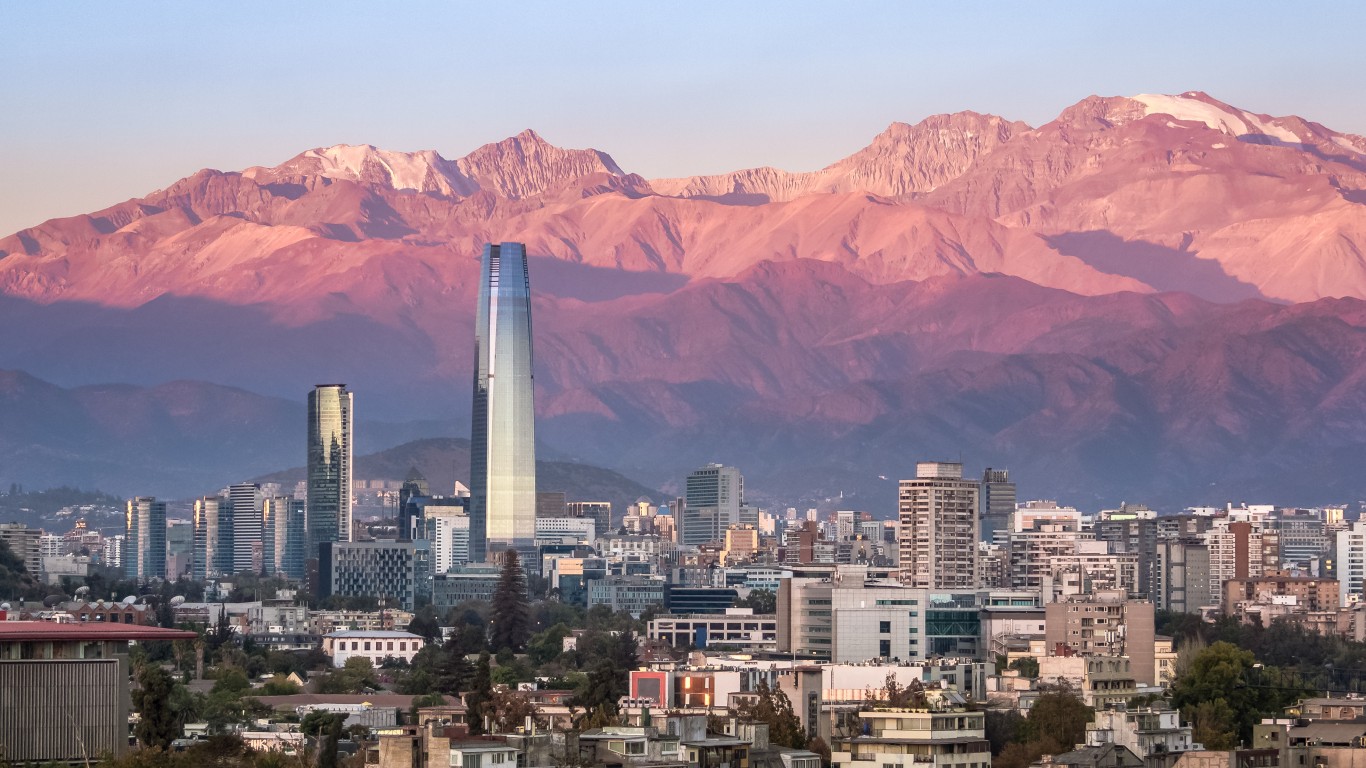
11. Santiago, Chile
> Total emissions in 2013: 31.43 million tons of CO2 equivalent
> Transport, industrial, waste, and local power plants: 23.12 million tons of CO2 equivalent — #8 most in study
> Grid-supplied energy produced outside the city boundary: 8.31 million tons of CO2 equivalent — #22 most in study
> Population in 2013: 5.1 million
Viewing the climate crisis as inextricable from other social and economic ills, Chile updated its climate action plan in the middle of the pandemic, making climate action part of its plan for economic recovery. Chile is also determined to address climate in ways that will provide water security, gender equality, and poverty alleviation.

Source: SeanPavonePhoto / iStock via Getty Images
10. Houston, Texas USA
> Total emissions in 2014: 33.43 million tons of CO2 equivalent
> Transport, industrial, waste, and local power plants: 16.08 million tons of CO2 equivalent — #17 most in study
> Grid-supplied energy produced outside the city boundary: 14.51 million tons of CO2 equivalent — #9 most in study
> Population in 2014: 2.2 million
Last year’s U.S. Transportation Climate Index ranked Houston 98 out of 100 sunbelt cities, based on eight measures of transportation inefficiencies; only Phoenix and Dallas received a poorer rating. According to 2014 data, transportation was responsible for 48% of the city’s total greenhouse gas output. Despite its commitment to increase transit, incentivize electric car usage and facilitate bicycle and pedestrian traffic, Houston is not consistent in its efforts, as it continues to add miles of highway to ease congestion.
[in-text-ad]

Source: mihaiulia / iStock via Getty Images
9. Rotterdam, Netherlands
> Total emissions in 2016: 34.19 million tons of CO2 equivalent
> Transport, industrial, waste, and local power plants: 17.84 million tons of CO2 equivalent — #12 most in study
> Grid-supplied energy produced outside the city boundary: N/A
> Population in 2016: 994,000
Rotterdam is making progress in emission reductions, though much of the industrial decrease is largely attributable to last year’s economic slump. Still, the city’s 21% drop in overall power plant emissions is significant, accomplished with the help of the national 40% increase in alternative energy.
Source: Jui-Chi Chan / iStock via Getty Images
8. Taoyuan, Taiwan
> Total emissions in 2014: 35.76 million tons of CO2 equivalent
> Transport, industrial, waste, and local power plants: 21.14 million tons of CO2 equivalent — #9 most in study
> Grid-supplied energy produced outside the city boundary: 14.62 million tons of CO2 equivalent — #8 most in study
> Population in 2014: 2.1 million
Taoyuan only became a city in 2014, and is now Taiwan’s sixth, but it has also quickly become an industrial center, attracting global companies such as Cisco, Apple and Microsoft — and greatly increasing its CO2 output. Still dependent on fossil fuels, the city has, since 2014, persisted in its efforts to become a green model, with big investments in and programs for solar, wind, and hydraulic power.

Source: ZoltanGabor / iStock via Getty Images
7. Greater London, United Kingdom
> Total emissions in 2013: 40.19 million tons of CO2 equivalent
> Transport, industrial, waste, and local power plants: 20.62 million tons of CO2 equivalent — #10 most in study
> Grid-supplied energy produced outside the city boundary: 19.57 million tons of CO2 equivalent — #3 most in study
> Population in 2013: 8.4 million 8,600,000
Famous for its historic killing smog, London is something of a poster child for urban congestion and, of course, the resulting pollution. Transportation is a key culprit, and London is focused on reducing its contribution to climate change and dirty air. Mayor Sadiq Kahn is credited with the city’s innovative approaches, the most famous being London’s Ultra Low Emission Zone — ULEZ — which includes most of central London. Drivers are required to meet strict emission standards or pay steep daily fees for traveling in the zone.
[in-text-ad-2]

Source: Nikada / E+ via Getty Images
6. Hong Kong
> Total emissions in 2014: 44.90 million tons of CO2 equivalent
> Transport, industrial, waste, and local power plants: 44.88 million tons of CO2 equivalent — #2 most in study
> Grid-supplied energy produced outside the city boundary: N/A
> Population in 2014: 7.3 million
Despite its prosperity, Hong Kong is not on track to meet its carbon reduction goals and is falling beyond its counterparts — Asian cities of similar size and development– in developing renewable energy, becoming more energy efficient, and electrifying transportation. It remains almost totally dependent on fossil fuels, counting its slow transition from coal to natural gas as key progress.

Source: SeanPavonePhoto / iStock via Getty Images
5. Seoul, South Korea
> Total emissions in 2013: 47.61 million tons of CO2 equivalent
> Transport, industrial, waste, and local power plants: 25.08 million tons of CO2 equivalent — #7 most in study
> Grid-supplied energy produced outside the city boundary: 22.53 million tons of CO2 equivalent — #2 most in study
> Population in 2013: 10.0 million
In the face of its poor standing in regard to CO2 emissions, South Korea hosted an international summit on climate change this past spring, setting forth lofty goals and strategies, including a goal of net zero emissions by 2050, and funding to assist developing nations in their efforts. Critics predict that the country’s existing and planned coal plants will still be functional in 2050.
[in-text-ad]

Source: TomasSereda / iStock via Getty Images
4. New York City, New York USA
> Total emissions in 2015: 53.31 million tons of CO2 equivalent
> Transport, industrial, waste, and local power plants: 38.96 million tons of CO2 equivalent — #4 most in study
> Grid-supplied energy produced outside the city boundary: 14.34 million tons of CO2 equivalent — #10 most in study
> Population in 2015: 8.4 million
In the last decade, climate change has become devastatingly real, as natural disasters have shaken communities around the globe. For New York City, which had been implementing some greening strategies, reality struck with Superstorm Sandy in 2012, which killed 43 people, destroyed homes and businesses, flooded the city’s streets and subways, and caused $19 billion in damages. Since then, NYC has embraced the Paris Agreement and embarked on a wide-ranging climate plan that includes divesting its five pension funds from businesses involved in fossil fuels.
 24/7 Wall St.
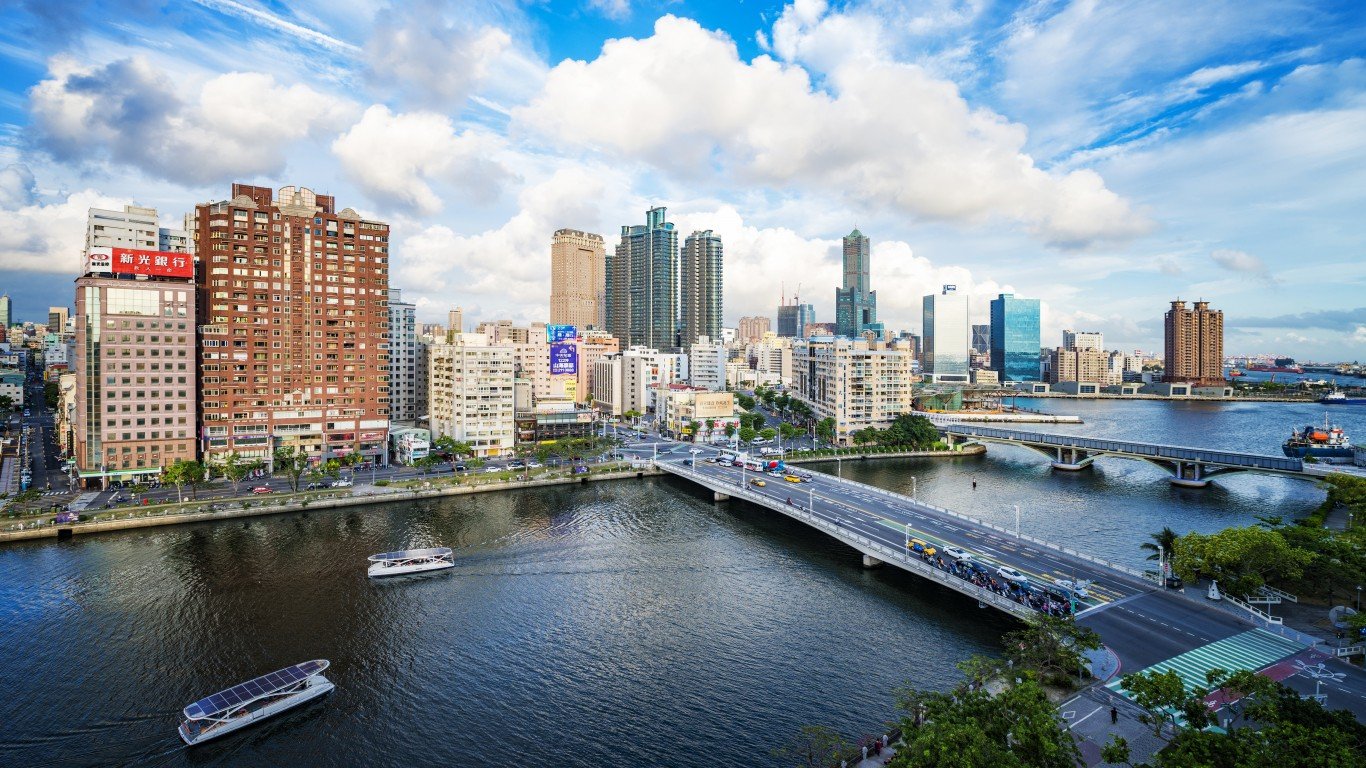
Source: shih-wei / iStock via Getty Images
3. Kaohsiung, Taiwan
> Total emissions in 2014: 58.76 million tons of CO2 equivalent
> Transport, industrial, waste, and local power plants: 43.50 million tons of CO2 equivalent — #3 most in study
> Grid-supplied energy produced outside the city boundary: 15.25 million tons of CO2 equivalent — #7 most in study
> Population in 2014: 2.8 million
Like the rest of Taiwan, Kaohsium relies on fossil fuels for its energy needs, and its emissions are largely attributable to industrial activity. Still, independent of Taiwan’s direction, Kaohsium has made some progress, having created its first emissions inventory in 2005 and a mitigation and adaptation plan in 2015. Between 2005 and 2017 it managed to reduce its carbon footprint by over 13%. It is now a leader in solar technology, and is outpacing the national government in green mobility and building measures.
Source: CJNattanai / iStock via Getty Images
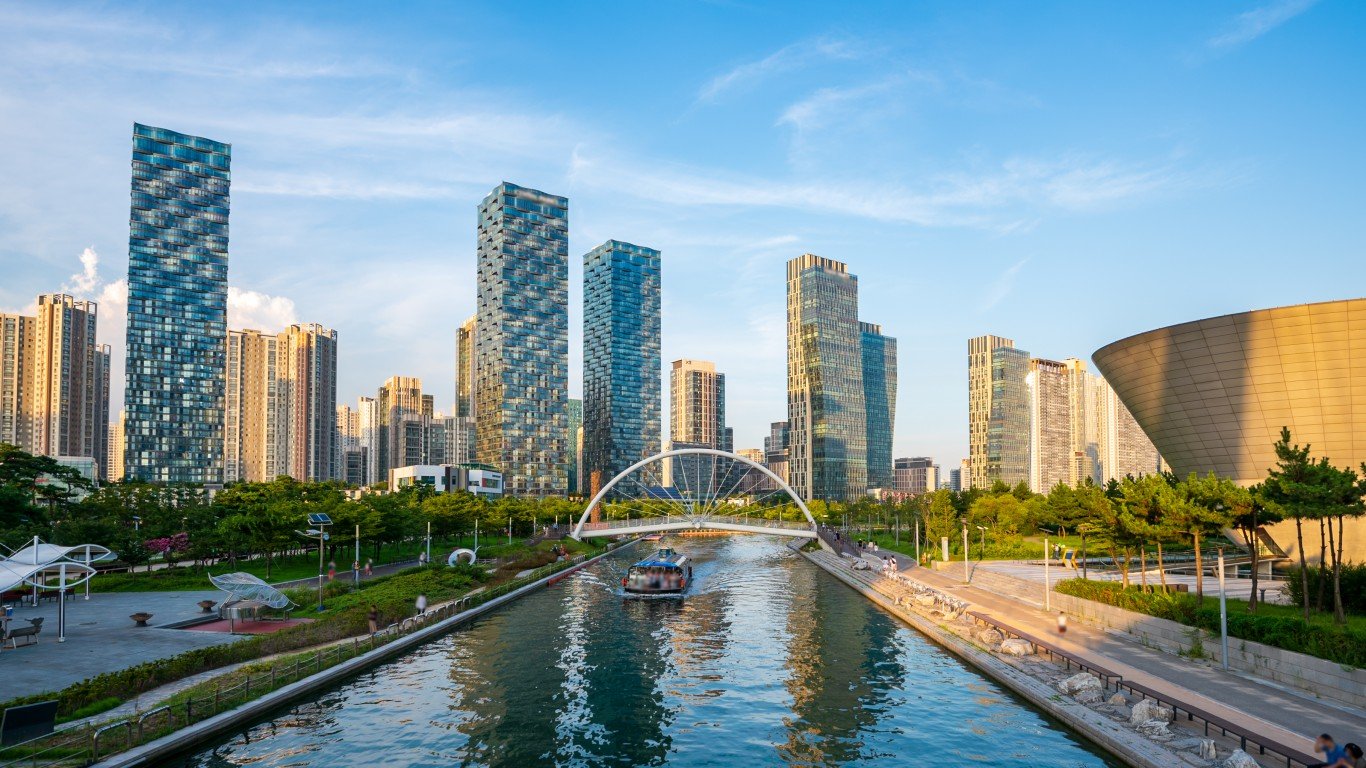
2. Incheon, South Korea
> Total emissions in 2015: 69.79 million tons of CO2 equivalent
> Transport, industrial, waste, and local power plants: 57.72 million tons of CO2 equivalent — #1 most in study
> Grid-supplied energy produced outside the city boundary: 12.07 million tons of CO2 equivalent — #13 most in study
> Population in 2015: 2.9 million
South Korea’s third largest city has won international recognition for its innovative efforts to reduce its carbon footprint. Among other initiatives, it has created a business district based on green technology, and a pneumatic waste disposal system that eliminates the need for garbage trucks, increases recycling, and provides fuel for energy production — fuel that is cleaner than fossil fuels, on which the country is heavily reliant.
[in-text-ad-2]

Source: yongyuan / E+ via Getty Images
1. Tokyo, Japan
> Total emissions in 2014: 70.13 million tons of CO2 equivalent
> Transport, industrial, waste, and local power plants: 27.61 million tons of CO2 equivalent — #6 most in study
> Grid-supplied energy produced outside the city boundary: 42.52 million tons of CO2 equivalent — #1 most in study
> Population in 2014: 13.5 million
In its climate strategies, Tokyo does not differ greatly from other megacities, struggling more with implementation than with goal setting, but it is making headway on a transportation program that is more novel than most. The city promotes the use of hydrogen fueled vehicles, for which water is the sole byproduct. As of last year, Tokyo had installed 19 hydrogen fueling stations and was employing 70 fuel cell busses.
Take This Retirement Quiz To Get Matched With A Financial Advisor (Sponsored)
Take the quiz below to get matched with a financial advisor today.
Each advisor has been vetted by SmartAsset and is held to a fiduciary standard to act in your best interests.
Here’s how it works:
1. Answer SmartAsset advisor match quiz
2. Review your pre-screened matches at your leisure. Check out the
advisors’ profiles.
3. Speak with advisors at no cost to you. Have an introductory call on the phone or introduction in person and choose whom to work with in the future
Take the retirement quiz right here.
Thank you for reading! Have some feedback for us?
Contact the 24/7 Wall St. editorial team.
Editors' Picks