
Inflation is surging in the United States – in large part because of rising food prices. In cities across the country, food today is 8% more expensive on average than it was a year ago, and American families are feeling the pinch.
According to the Economic Policy Institute, a nonprofit think tank, a family of four – two adults and two children – can expect to pay an estimated $9,835 on food in 2022. This amount varies across the country, however, and despite rising costs, there are many major metropolitan areas where families are paying thousands less than the estimated national average for food. Here is a look at the countries with the most and least affordable groceries.
Using data from the EPI’s Family Budget Calculator, 24/7 Wall St. identified the 50 U.S. metro areas where families pay the least for food. Metro areas are ranked on estimated food expenditure in 2022, assuming a nutritionally adequate diet for two adults and two children, where almost all food is bought at a grocery store and prepared at home.
In metro areas with the same estimated annual food cost, the metro area with the lower food insecurity rate – defined as the share of the population not able to always afford or otherwise access well-balanced meals – ranks better.
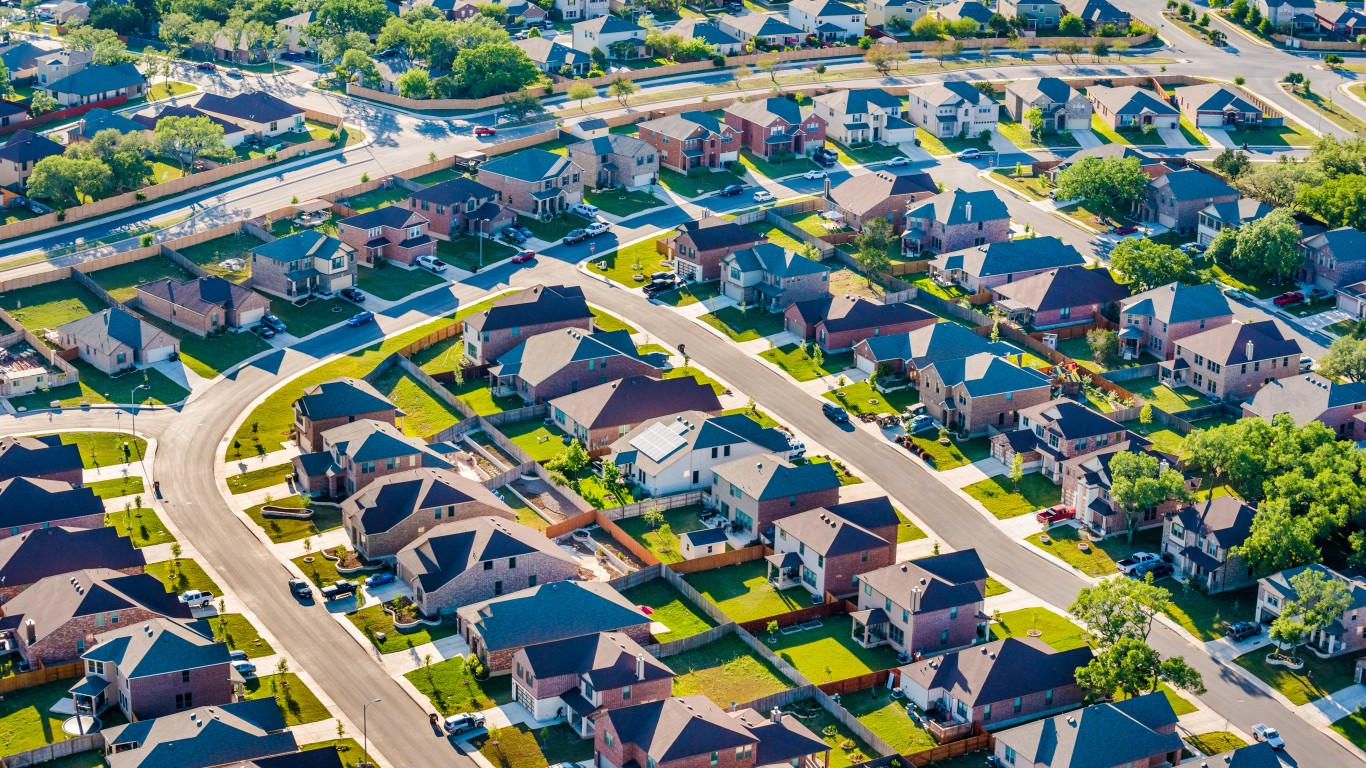
Among the metro areas on this list, estimated annual food costs range from $8,529 down to $7,016. The majority of metro areas on this list are in the South, including 14 in Texas alone. Lower food costs in these places are often a reflection of what residents can afford. Every metro area on this list has a lower median family income than the national average of $80,069. Here is a look at the income needed to be middle class in each state.
For many families in these metro areas, food costs are not sufficiently low to offset low incomes, as in the majority of these places, the share of households receiving government assistance to afford groceries in the form of SNAP benefits, or Food Stamps, exceeds the national recipiency rate of 12.1%.
Click here to see the metros where families pay the least for food
Click here to read our detailed methodology
Source: Marti157900 / iStock Editorial via Getty Images
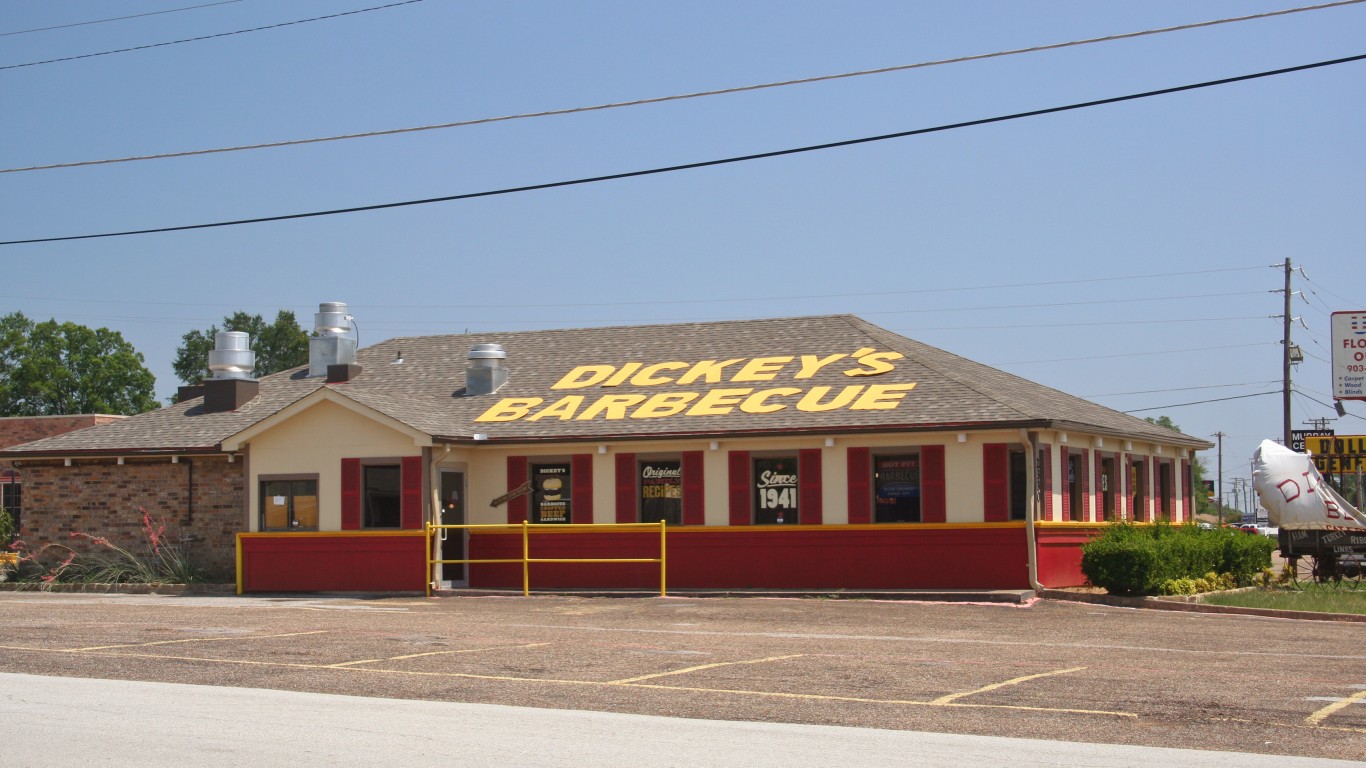
50. Longview, TX
> Est. annual food costs: $8,529
> Median family income: $64,818 — 78th lowest of 376 metros
> Food Stamp recipiency rate: 14.3% — 109th highest of 376 metros
> Food insecurity rate: 8.9% — 119th highest of 376 metros
[in-text-ad]

Source: Rodrigo A. Rodriguez Fuentes / iStock Editorial via Getty Images
49. Columbus, IN
> Est. annual food costs: $8,515
> Median family income: $79,194 — 130th highest of 376 metros
> Food Stamp recipiency rate: 8.8% — 66th lowest of 376 metros
> Food insecurity rate: 9.2% — 108th highest of 376 metros
 24/7 Wall St.
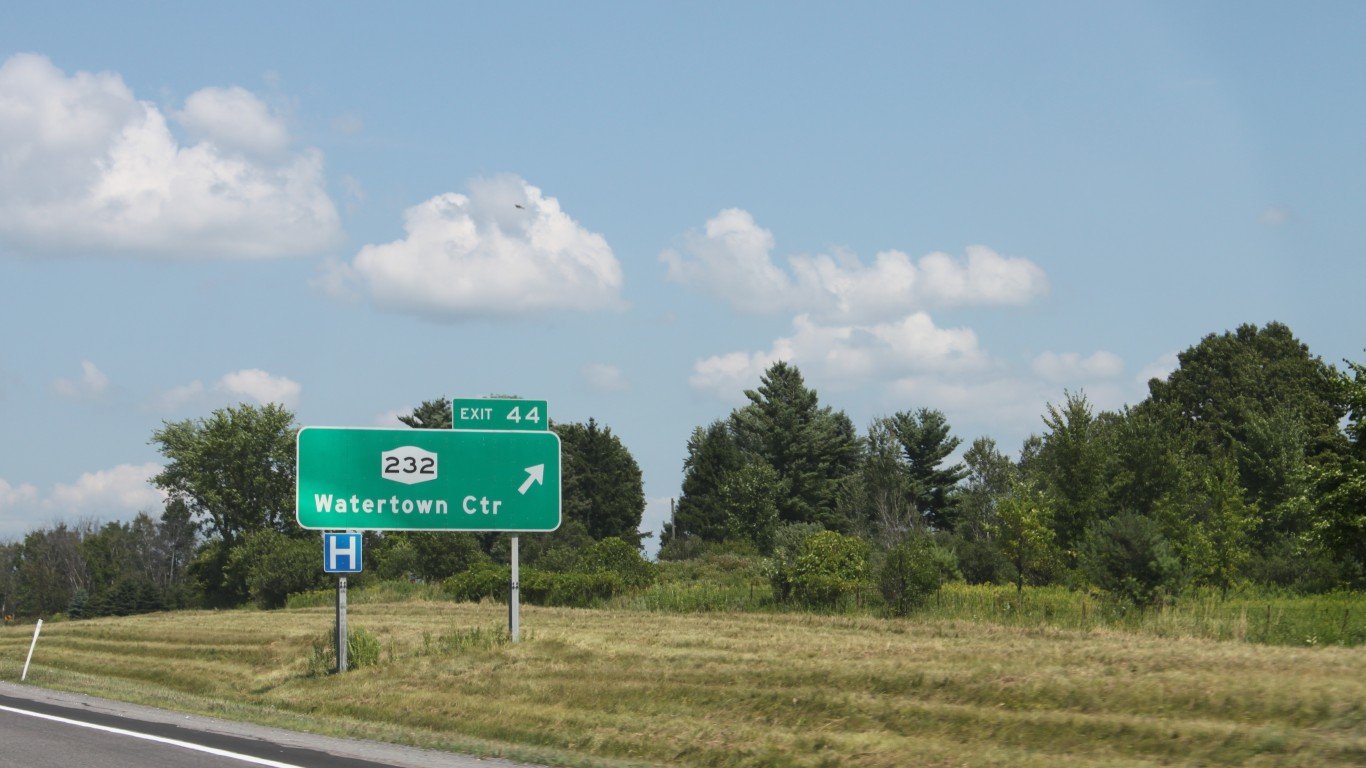
Source: KathyKafka / iStock via Getty Images
48. Watertown-Fort Drum, NY
> Est. annual food costs: $8,515
> Median family income: $66,711 — 99th lowest of 376 metros
> Food Stamp recipiency rate: 17.7% — 44th highest of 376 metros
> Food insecurity rate: 6.4% — 153rd lowest of 376 metros

Source: benedek / E+ via Getty Images
47. Charleston, WV
> Est. annual food costs: $8,512
> Median family income: $60,682 — 35th lowest of 376 metros
> Food Stamp recipiency rate: 18.0% — 33rd highest of 376 metros
> Food insecurity rate: 7.2% — 185th lowest of 376 metros
[in-text-ad-2]

46. Weirton-Steubenville, WV-OH
> Est. annual food costs: $8,499
> Median family income: $61,496 — 47th lowest of 376 metros
> Food Stamp recipiency rate: 16.3% — 66th highest of 376 metros
> Food insecurity rate: 9.2% — 106th highest of 376 metros

Source: DenisTangneyJr / iStock via Getty Images
45. Evansville, IN-KY
> Est. annual food costs: $8,491
> Median family income: $72,963 — 185th lowest of 376 metros
> Food Stamp recipiency rate: 9.9% — 109th lowest of 376 metros
> Food insecurity rate: 4.3% — 59th lowest of 376 metros
[in-text-ad]

Source: DenisTangneyJr / iStock via Getty Images
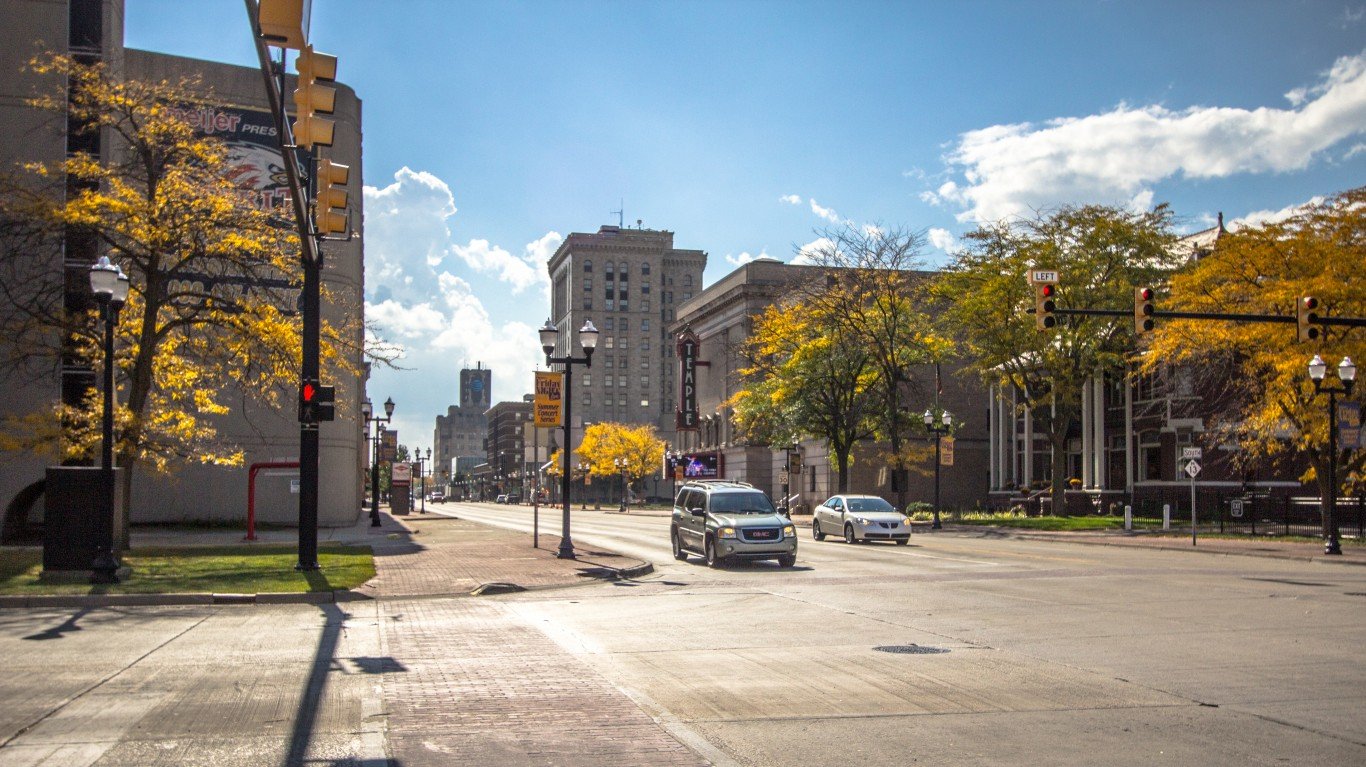
44. Jackson, MI
> Est. annual food costs: $8,485
> Median family income: $67,657 — 110th lowest of 376 metros
> Food Stamp recipiency rate: 12.5% — 177th highest of 376 metros
> Food insecurity rate: 10.0% — 74th highest of 376 metros
 24/7 Wall St.
Source: DenisTangneyJr / iStock via Getty Images
43. Elmira, NY
> Est. annual food costs: $8,485
> Median family income: $70,617 — 147th lowest of 376 metros
> Food Stamp recipiency rate: 16.5% — 60th highest of 376 metros
> Food insecurity rate: 5.8% — 126th lowest of 376 metros

Source: BOB WESTON / iStock via Getty Images
42. St. Joseph, MO-KS
> Est. annual food costs: $8,462
> Median family income: $66,409 — 95th lowest of 376 metros
> Food Stamp recipiency rate: 11.9% — 178th lowest of 376 metros
> Food insecurity rate: 7.5% — 173rd highest of 376 metros
[in-text-ad-2]

41. Springfield, OH
> Est. annual food costs: $8,455
> Median family income: $63,361 — 67th lowest of 376 metros
> Food Stamp recipiency rate: 18.6% — 26th highest of 376 metros
> Food insecurity rate: 10.8% — 57th highest of 376 metros

Source: ShriramPatki / iStock via Getty Images
40. Bay City, MI
> Est. annual food costs: $8,455
> Median family income: $62,204 — 54th lowest of 376 metros
> Food Stamp recipiency rate: 15.3% — 85th highest of 376 metros
> Food insecurity rate: 7.7% — 167th highest of 376 metros
[in-text-ad]

Source: traveler1116 / iStock via Getty Images
39. Hickory-Lenoir-Morganton, NC
> Est. annual food costs: $8,449
> Median family income: $60,878 — 37th lowest of 376 metros
> Food Stamp recipiency rate: 12.6% — 173rd highest of 376 metros
> Food insecurity rate: 10.9% — 55th highest of 376 metros
 24/7 Wall St.
Source: Kruck20 / iStock via Getty Images
38. Spartanburg, SC
> Est. annual food costs: $8,425
> Median family income: $65,214 — 83rd lowest of 376 metros
> Food Stamp recipiency rate: 10.4% — 131st lowest of 376 metros
> Food insecurity rate: 12.9% — 26th highest of 376 metros

Source: ovidiuhrubaru / iStock via Getty Images
37. Sumter, SC
> Est. annual food costs: $8,425
> Median family income: $57,134 — 20th lowest of 376 metros
> Food Stamp recipiency rate: 18.2% — 29th highest of 376 metros
> Food insecurity rate: 11.3% — 49th highest of 376 metros
[in-text-ad-2]
Source: ehrlif / iStock Editorial via Getty Images
36. Saginaw, MI
> Est. annual food costs: $8,425
> Median family income: $64,094 — 72nd lowest of 376 metros
> Food Stamp recipiency rate: 19.0% — 22nd highest of 376 metros
> Food insecurity rate: 10.4% — 67th highest of 376 metros
Source: DenisTangneyJr / iStock via Getty Images
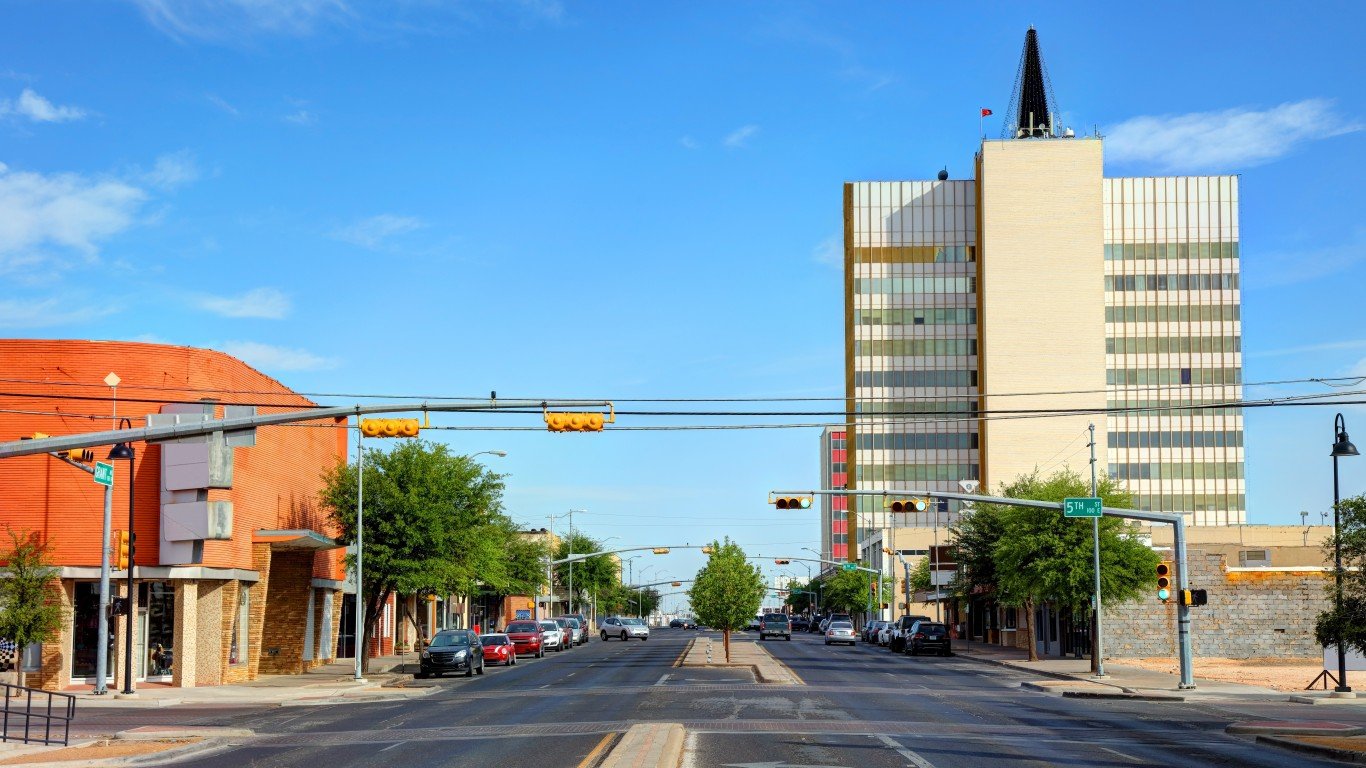
35. Odessa, TX
> Est. annual food costs: $8,425
> Median family income: $74,327 — 178th highest of 376 metros
> Food Stamp recipiency rate: 12.2% — 187th highest of 376 metros
> Food insecurity rate: 6.4% — 154th lowest of 376 metros
[in-text-ad]

34. Huntington-Ashland, WV-KY-OH
> Est. annual food costs: $8,422
> Median family income: $61,976 — 52nd lowest of 376 metros
> Food Stamp recipiency rate: 17.9% — 38th highest of 376 metros
> Food insecurity rate: 5.6% — 118th lowest of 376 metros

33. Michigan City-La Porte, IN
> Est. annual food costs: $8,395
> Median family income: $70,726 — 148th lowest of 376 metros
> Food Stamp recipiency rate: 11.9% — 177th lowest of 376 metros
> Food insecurity rate: 11.7% — 43rd highest of 376 metros

32. Goldsboro, NC
> Est. annual food costs: $8,365
> Median family income: $59,689 — 33rd lowest of 376 metros
> Food Stamp recipiency rate: 17.1% — 51st highest of 376 metros
> Food insecurity rate: 8.6% — 131st highest of 376 metros
[in-text-ad-2]

Source: Sean Pavone / iStock via Getty Images
31. Corpus Christi, TX
> Est. annual food costs: $8,340
> Median family income: $67,685 — 111th lowest of 376 metros
> Food Stamp recipiency rate: 17.1% — 50th highest of 376 metros
> Food insecurity rate: 10.7% — 61st highest of 376 metros
Source: dszc / E+ via Getty Images
30. San Antonio-New Braunfels, TX
> Est. annual food costs: $8,337
> Median family income: $74,284 — 179th highest of 376 metros
> Food Stamp recipiency rate: 12.5% — 176th highest of 376 metros
> Food insecurity rate: 10.0% — 79th highest of 376 metros
[in-text-ad]

29. Muskegon, MI
> Est. annual food costs: $8,335
> Median family income: $64,668 — 76th lowest of 376 metros
> Food Stamp recipiency rate: 16.9% — 55th highest of 376 metros
> Food insecurity rate: 17.0% — 7th highest of 376 metros

28. Danville, IL
> Est. annual food costs: $8,335
> Median family income: $60,958 — 41st lowest of 376 metros
> Food Stamp recipiency rate: 16.3% — 67th highest of 376 metros
> Food insecurity rate: 5.7% — 124th lowest of 376 metros

27. Mansfield, OH
> Est. annual food costs: $8,305
> Median family income: $63,284 — 66th lowest of 376 metros
> Food Stamp recipiency rate: 15.8% — 77th highest of 376 metros
> Food insecurity rate: 11.4% — 46th highest of 376 metros
[in-text-ad-2]

Source: Westhoff / E+ via Getty Images
26. Decatur, IL
> Est. annual food costs: $8,305
> Median family income: $71,270 — 157th lowest of 376 metros
> Food Stamp recipiency rate: 17.8% — 42nd highest of 376 metros
> Food insecurity rate: 7.4% — 181st highest of 376 metros

25. Elkhart-Goshen, IN
> Est. annual food costs: $8,305
> Median family income: $70,610 — 146th lowest of 376 metros
> Food Stamp recipiency rate: 8.8% — 63rd lowest of 376 metros
> Food insecurity rate: 7.4% — 182nd highest of 376 metros
[in-text-ad]

24. Kokomo, IN
> Est. annual food costs: $8,275
> Median family income: $69,896 — 137th lowest of 376 metros
> Food Stamp recipiency rate: 10.8% — 144th lowest of 376 metros
> Food insecurity rate: 8.5% — 140th highest of 376 metros
recirclink id=1066858]

Source: ManuelHurtado / iStock via Getty Images
23. Sherman-Denison, TX
> Est. annual food costs: $8,275
> Median family income: $71,649 — 162nd lowest of 376 metros
> Food Stamp recipiency rate: 11.2% — 161st lowest of 376 metros
> Food insecurity rate: 7.9% — 162nd highest of 376 metros

Source: DenisTangneyJr / iStock via Getty Images
22. Bowling Green, KY
> Est. annual food costs: $8,264
> Median family income: $62,888 — 59th lowest of 376 metros
> Food Stamp recipiency rate: 12.9% — 167th highest of 376 metros
> Food insecurity rate: 4.5% — 66th lowest of 376 metros
[in-text-ad-2]

Source: DenisTangneyJr / iStock via Getty Images
21. Beaumont-Port Arthur, TX
> Est. annual food costs: $8,263
> Median family income: $68,971 — 127th lowest of 376 metros
> Food Stamp recipiency rate: 15.3% — 86th highest of 376 metros
> Food insecurity rate: 8.5% — 138th highest of 376 metros

20. Rocky Mount, NC
> Est. annual food costs: $8,259
> Median family income: $57,013 — 18th lowest of 376 metros
> Food Stamp recipiency rate: 20.4% — 12th highest of 376 metros
> Food insecurity rate: 6.5% — 157th lowest of 376 metros
[in-text-ad]

Source: Sandra Sapp / iStock via Getty Images
19. Joplin, MO
> Est. annual food costs: $8,248
> Median family income: $61,218 — 45th lowest of 376 metros
> Food Stamp recipiency rate: 14.0% — 121st highest of 376 metros
> Food insecurity rate: 8.9% — 120th highest of 376 metros

Source: DenisTangneyJr / iStock Unreleased via Getty Images
18. San Angelo, TX
> Est. annual food costs: $8,245
> Median family income: $71,287 — 158th lowest of 376 metros
> Food Stamp recipiency rate: 10.5% — 132nd lowest of 376 metros
> Food insecurity rate: 16.7% — 8th highest of 376 metros

Source: BOB WESTON / iStock via Getty Images
17. Jonesboro, AR
> Est. annual food costs: $8,245
> Median family income: $60,922 — 40th lowest of 376 metros
> Food Stamp recipiency rate: 13.9% — 124th highest of 376 metros
> Food insecurity rate: 10.7% — 59th highest of 376 metros
[in-text-ad-2]
Source: DenisTangneyJr / iStock via Getty Images
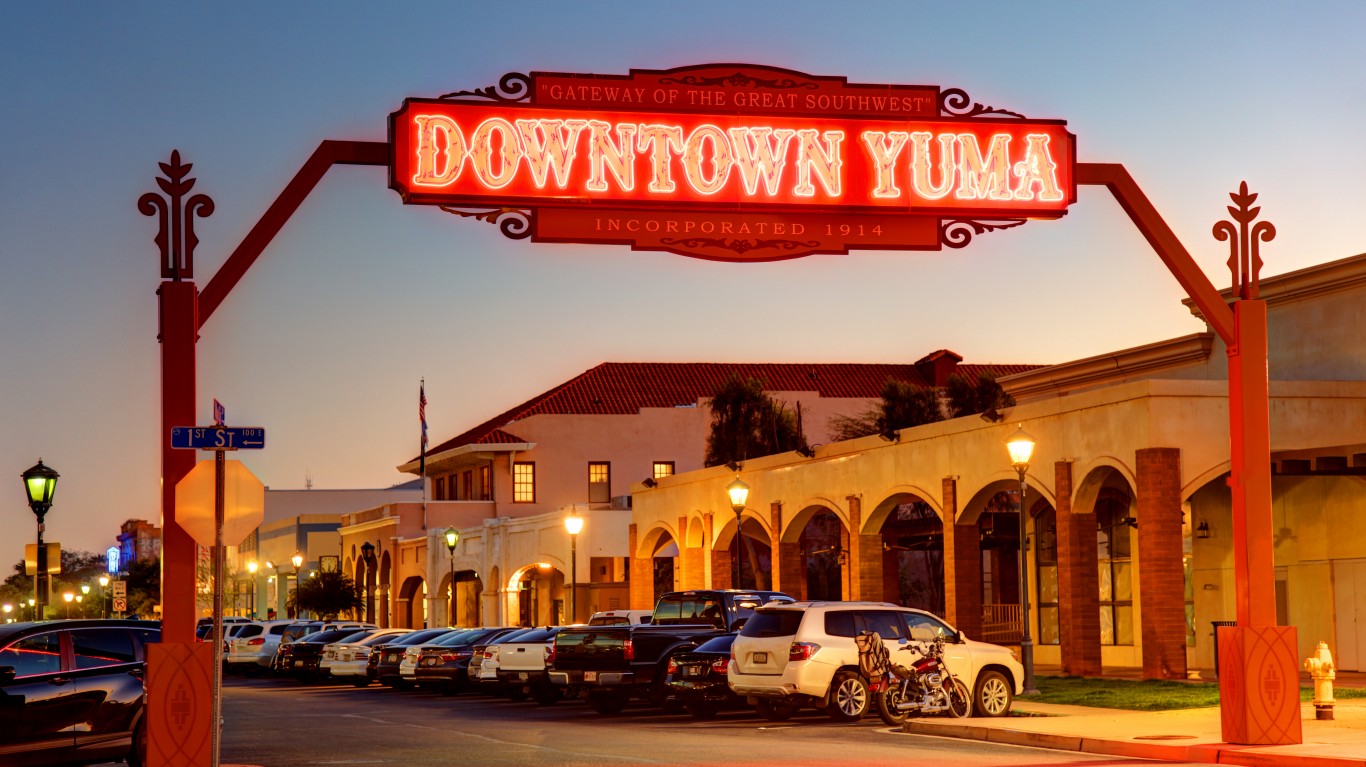
16. Yuma, AZ
> Est. annual food costs: $8,155
> Median family income: $54,897 — 9th lowest of 376 metros
> Food Stamp recipiency rate: 17.8% — 41st highest of 376 metros
> Food insecurity rate: 9.6% — 92nd highest of 376 metros

Source: TriciaDaniel / iStock via Getty Images
15. College Station-Bryan, TX
> Est. annual food costs: $8,126
> Median family income: $71,727 — 164th lowest of 376 metros
> Food Stamp recipiency rate: 10.3% — 128th lowest of 376 metros
> Food insecurity rate: 11.7% — 44th highest of 376 metros
[in-text-ad]

Source: ernestoali / iStock via Getty Images
14. El Centro, CA
> Est. annual food costs: $8,125
> Median family income: $53,558 — 5th lowest of 376 metros
> Food Stamp recipiency rate: 24.9% — 3rd highest of 376 metros
> Food insecurity rate: 9.2% — 107th highest of 376 metros

Source: jetcityimage / iStock Editorial via Getty Images
13. Lima, OH
> Est. annual food costs: $8,125
> Median family income: $64,913 — 79th lowest of 376 metros
> Food Stamp recipiency rate: 13.8% — 128th highest of 376 metros
> Food insecurity rate: 4.6% — 71st lowest of 376 metros

Source: DenisTangneyJr / E+ via Getty Images
12. Parkersburg-Vienna, WV
> Est. annual food costs: $8,075
> Median family income: $61,708 — 50th lowest of 376 metros
> Food Stamp recipiency rate: 16.8% — 56th highest of 376 metros
> Food insecurity rate: 6.2% — 143rd lowest of 376 metros
[in-text-ad-2]

Source: DenisTangneyJr / iStock via Getty Images
11. Florence, SC
> Est. annual food costs: $8,035
> Median family income: $58,215 — 24th lowest of 376 metros
> Food Stamp recipiency rate: 17.7% — 43rd highest of 376 metros
> Food insecurity rate: 9.4% — 101st highest of 376 metros

Source: peeterv / iStock via Getty Images
10. Terre Haute, IN
> Est. annual food costs: $7,998
> Median family income: $63,958 — 70th lowest of 376 metros
> Food Stamp recipiency rate: 12.9% — 165th highest of 376 metros
> Food insecurity rate: 9.5% — 94th highest of 376 metros
[in-text-ad]

9. Elizabethtown-Fort Knox, KY
> Est. annual food costs: $7,949
> Median family income: $71,446 — 160th lowest of 376 metros
> Food Stamp recipiency rate: 9.7% — 96th lowest of 376 metros
> Food insecurity rate: 8.6% — 135th highest of 376 metros
 24/7 Wall St.
Source: DenisTangneyJr / iStock via Getty Images
8. Laredo, TX
> Est. annual food costs: $7,855
> Median family income: $54,078 — 8th lowest of 376 metros
> Food Stamp recipiency rate: 25.0% — 2nd highest of 376 metros
> Food insecurity rate: 12.7% — 30th highest of 376 metros

Source: lydiabilby / Getty Images
7. Muncie, IN
> Est. annual food costs: $7,855
> Median family income: $61,415 — 46th lowest of 376 metros
> Food Stamp recipiency rate: 14.6% — 103rd highest of 376 metros
> Food insecurity rate: 8.2% — 154th highest of 376 metros
[in-text-ad-2]

Source: DenisTangneyJr / iStock via Getty Images
6. Owensboro, KY
> Est. annual food costs: $7,848
> Median family income: $68,358 — 118th lowest of 376 metros
> Food Stamp recipiency rate: 11.1% — 158th lowest of 376 metros
> Food insecurity rate: 4.1% — 52nd lowest of 376 metros

5. Killeen-Temple, TX
> Est. annual food costs: $7,815
> Median family income: $66,430 — 96th lowest of 376 metros
> Food Stamp recipiency rate: 13.4% — 147th highest of 376 metros
> Food insecurity rate: 13.4% — 22nd highest of 376 metros
[in-text-ad]
Source: ChrisBoswell / iStock via Getty Images
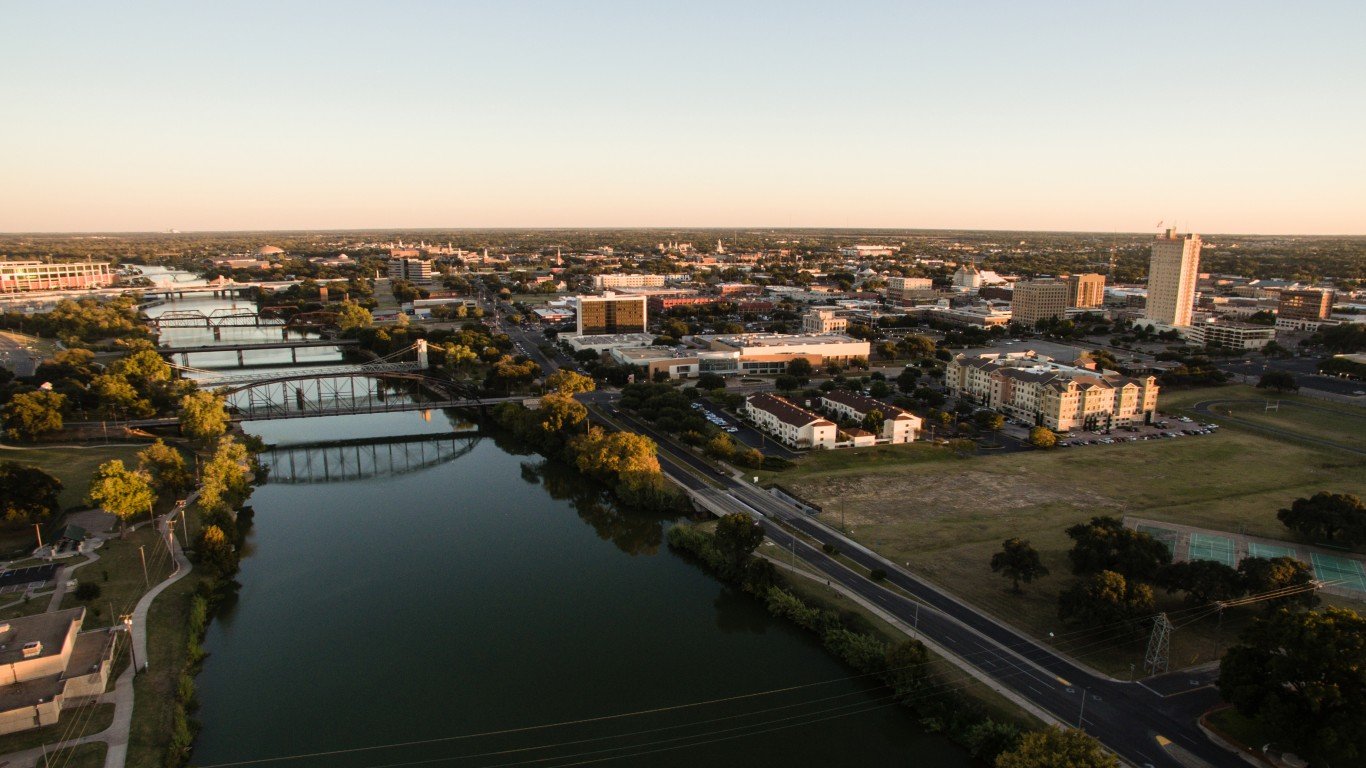
4. Waco, TX
> Est. annual food costs: $7,675
> Median family income: $66,852 — 103rd lowest of 376 metros
> Food Stamp recipiency rate: 13.0% — 159th highest of 376 metros
> Food insecurity rate: 19.2% — 4th highest of 376 metros

3. Victoria, TX
> Est. annual food costs: $7,502
> Median family income: $71,697 — 163rd lowest of 376 metros
> Food Stamp recipiency rate: 13.6% — 133rd highest of 376 metros
> Food insecurity rate: 9.5% — 96th highest of 376 metros
Source: DenisTangneyJr / iStock via Getty Images
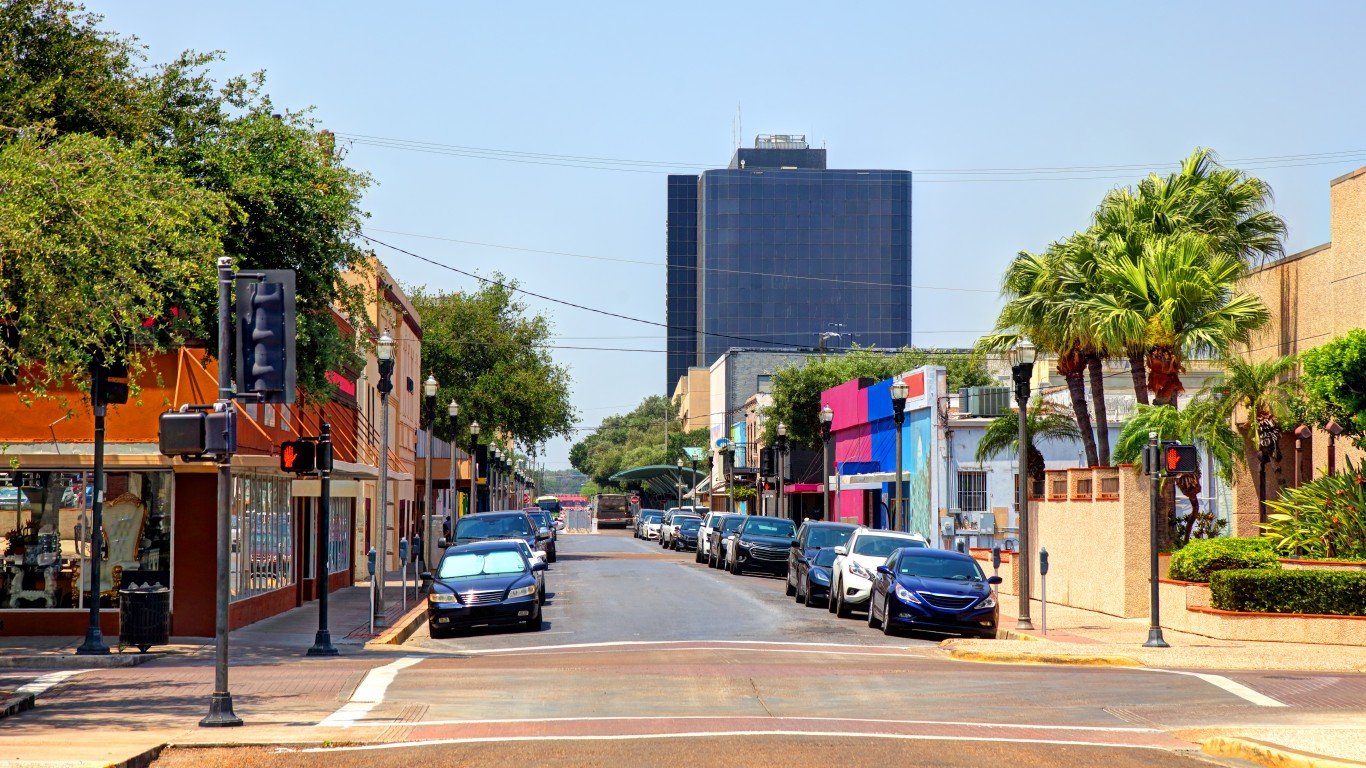
2. McAllen-Edinburg-Mission, TX
> Est. annual food costs: $7,166
> Median family income: $46,609 — the lowest of 376 metros
> Food Stamp recipiency rate: 28.9% — the highest of 376 metros
> Food insecurity rate: 21.3% — the highest of 376 metros
[in-text-ad-2]
.jpg "Brownsville-Harlingen, TX, TX, USA - panoramio (2) by Eric Friedebach")
1. Brownsville-Harlingen, TX
> Est. annual food costs: $7,016
> Median family income: $47,332 — 2nd lowest of 376 metros
> Food Stamp recipiency rate: 24.0% — 5th highest of 376 metros
> Food insecurity rate: 14.2% — 16th highest of 376 metros
Methodology
To determine the metros with the lowest food costs for a family of four, 24/7 Wall St. reviewed data from the Economic Policy Institute’s 2022 Family Budget Calculator.
In the Family Budget Calculator, the EPI estimates the annual food budget necessary for families to maintain a modest yet adequate standard of living. The budgets are created for 10 family types for U.S. counties and metro areas. A family of four is defined by the EPI as a married couple living with their two children, and the two children are assumed to be a four-year-old and an eight-year-old. Food cost estimates assume that almost all food is purchased at a grocery store and prepared at home.
We used the 384 metropolitan statistical areas as delineated by the United States Office of Management and Budget and used by the Census Bureau as our definition of metros.
Metros are ranked based on the EPI’s annual food cost estimates. Ties were broken based on the rate of food insecurity. The food insecurity rate – or the share of the population that lacks adequate access to food – is from the Robert Wood Johnson Foundation and the University of Wisconsin Population Health Institute joint program’s 2021 County Health Rankings & Roadmaps report.
Additional information on median family income and the share of households that receive benefits from the Supplemental Nutrition Assistance Program – formerly known as food stamps – are from the U.S. Census Bureau’s 2020 American Community Survey. Because the Census Bureau did not release one-year estimates for 2020 due to data collection issues caused by the COVID-19 pandemic, all ACS data are five-year estimates.
Take This Retirement Quiz To Get Matched With An Advisor Now (Sponsored)
Are you ready for retirement? Planning for retirement can be overwhelming, that’s why it could be a good idea to speak to a fiduciary financial advisor about your goals today.
Start by taking this retirement quiz right here from SmartAsset that will match you with up to 3 financial advisors that serve your area and beyond in 5 minutes. Smart Asset is now matching over 50,000 people a month.
Click here now to get started.
Thank you for reading! Have some feedback for us?
Contact the 24/7 Wall St. editorial team.
Editors' Picks