Part of the $2.2 trillion Coronavirus Aid, Relief, and Economic Security Act, passed by Congress and signed by President Donald Trump in March 2020, included temporary protections against foreclosure and evictions for homeowners holding federally backed mortgages. This emergency regulatory safeguard kept millions of Americans in their homes during the most economically crippling period of the pandemic. (These are the states where the most people own their homes.)
Thanks to the ongoing nationwide surge in home prices, many of these borrowers hold more equity in their homes than before the global viral outbreak. But not everyone emerged above water from this forbearance lifeline.
According to a recent analysis by property data provider ATTTOM, foreclosure filings hit a post-pandemic high in the first quarter of 2022, at 78,271, up 39% from the previous quarter and 132% from the same period last year. To find the states with the most foreclosures, 24/7 Wall St. reviewed foreclosure data from 2021 and 2022 provided by ATTOM Data Solutions. States are ranked by the number of foreclosures per 100,000 housing units.
Foreclosure activity is still 57% lower than it was in the first three months of 2020, but the return to normal is rapidly approaching. Foreclosures have declined in the 12 months through March 2022 in only three states — Alaska and the Dakotas — while foreclosure activity jumped by well over 200% in five states — New York, New Jersey, Colorado, Nevada, and Michigan. Foreclosure activity shot up nearly 500% in Nevada and Michigan. Nationwide, foreclosure activity rose 135%.
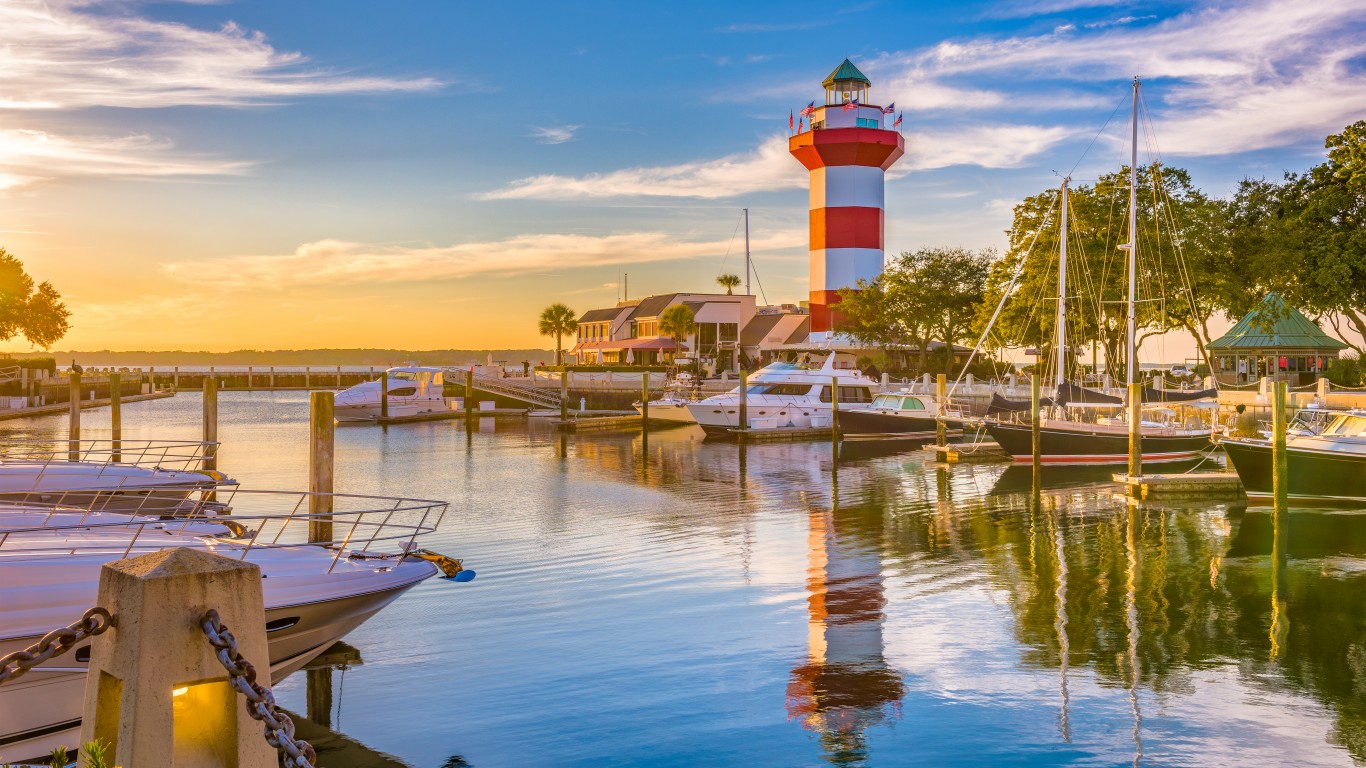
Chicago, New York City, Los Angeles, Houston, and Philadelphia had the greatest number of foreclosure filings. For cities with populations under 200,000, the highest foreclosure rates took place in Cleveland, Ohio; Atlantic City, New Jersey; Jacksonville, North Carolina; Rockford, Illinois; and Columbia, South Carolina. (See also the city with the highest housing costs in every state.)
In three states — Wyoming, Louisiana, and Mississippi — underwater mortgages accounted for between 10% and 17% of all mortgages, the most among states. An underwater mortgage is when a home is worth less than the money owed on the mortgage.
Here is the state with the worst foreclosure rate this year

Source: Jacob Boomsma / iStock via Getty Images
50. South Dakota
> Foreclosure rate, Q1 2022: 5.6 per 100,000 homes
> Chg. in foreclosure filings, Q1 2021 to Q1 2022: -8.3%
> Mortgages seriously underwater, Q1 2022: 4.8%
> Total housing units: 389,921
[in-text-ad]

Source: DenisTangneyJr / E+ via Getty Images
49. Vermont
> Foreclosure rate, Q1 2022: 7.2 per 100,000 homes
> Chg. in foreclosure filings, Q1 2021 to Q1 2022: +200.0%
> Mortgages seriously underwater, Q1 2022: 1.1%
> Total housing units: 334,318
 24/7 Wall St.
Source: Sean Pavone / iStock via Getty Images
48. West Virginia
> Foreclosure rate, Q1 2022: 9.2 per 100,000 homes
> Chg. in foreclosure filings, Q1 2021 to Q1 2022: +119.4%
> Mortgages seriously underwater, Q1 2022: 6.0%
> Total housing units: 855,635
Source: DenisTangneyJr / iStock via Getty Images
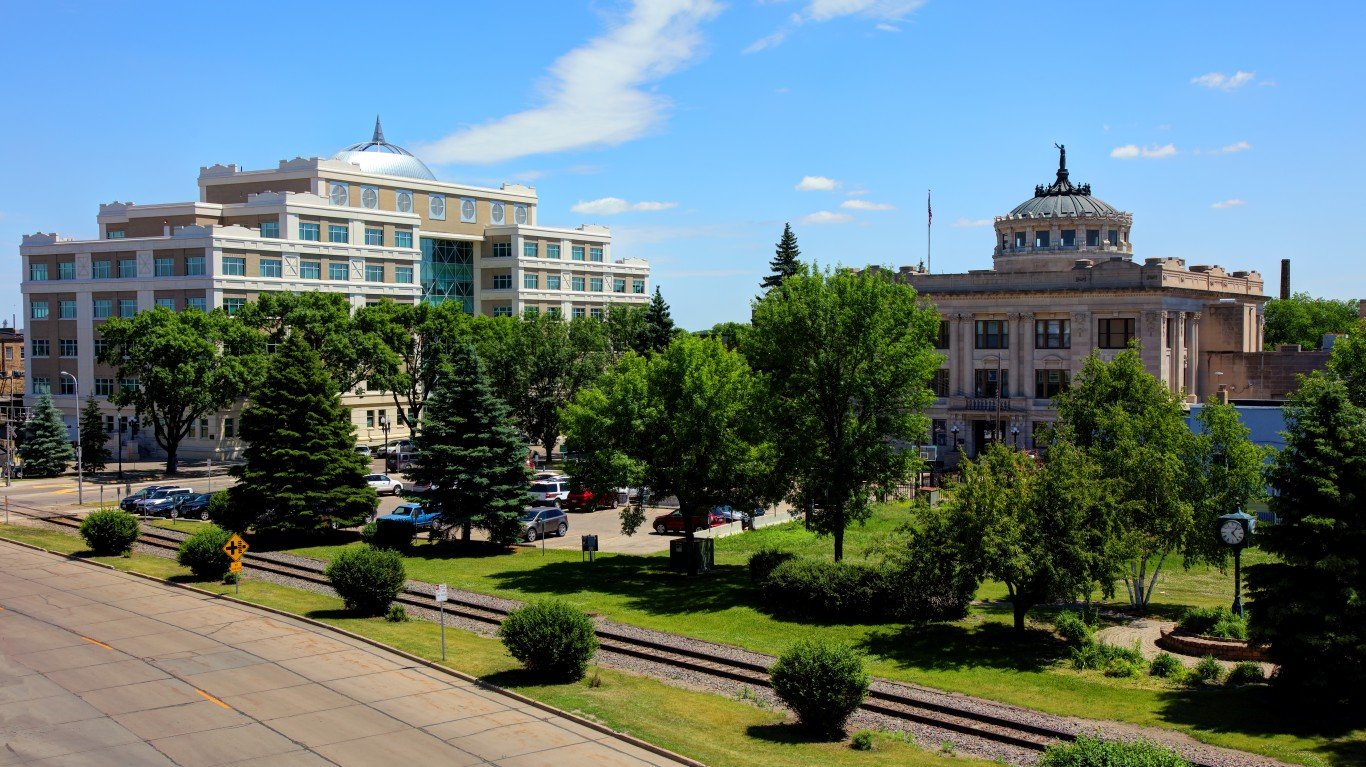
47. North Dakota
> Foreclosure rate, Q1 2022: 9.4 per 100,000 homes
> Chg. in foreclosure filings, Q1 2021 to Q1 2022: -12.5%
> Mortgages seriously underwater, Q1 2022: 5.3%
> Total housing units: 370,642
[in-text-ad-2]

Source: Sean Pavone / iStock via Getty Images
46. Oregon
> Foreclosure rate, Q1 2022: 13.2 per 100,000 homes
> Chg. in foreclosure filings, Q1 2021 to Q1 2022: +95.9%
> Mortgages seriously underwater, Q1 2022: 1.3%
> Total housing units: 1,813,747
Source: peeterv / iStock via Getty Images
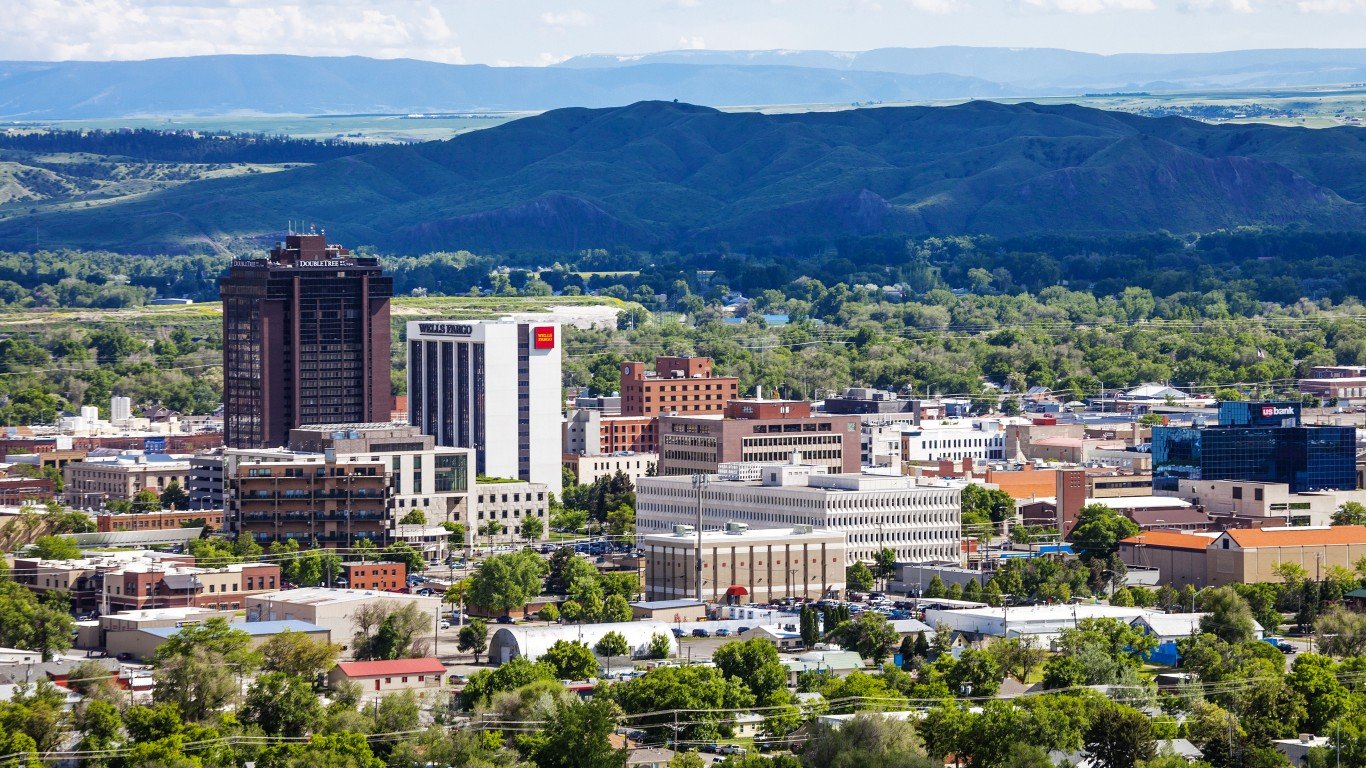
45. Montana
> Foreclosure rate, Q1 2022: 15.0 per 100,000 homes
> Chg. in foreclosure filings, Q1 2021 to Q1 2022: +97.4%
> Mortgages seriously underwater, Q1 2022: 3.0%
> Total housing units: 514,803
[in-text-ad]
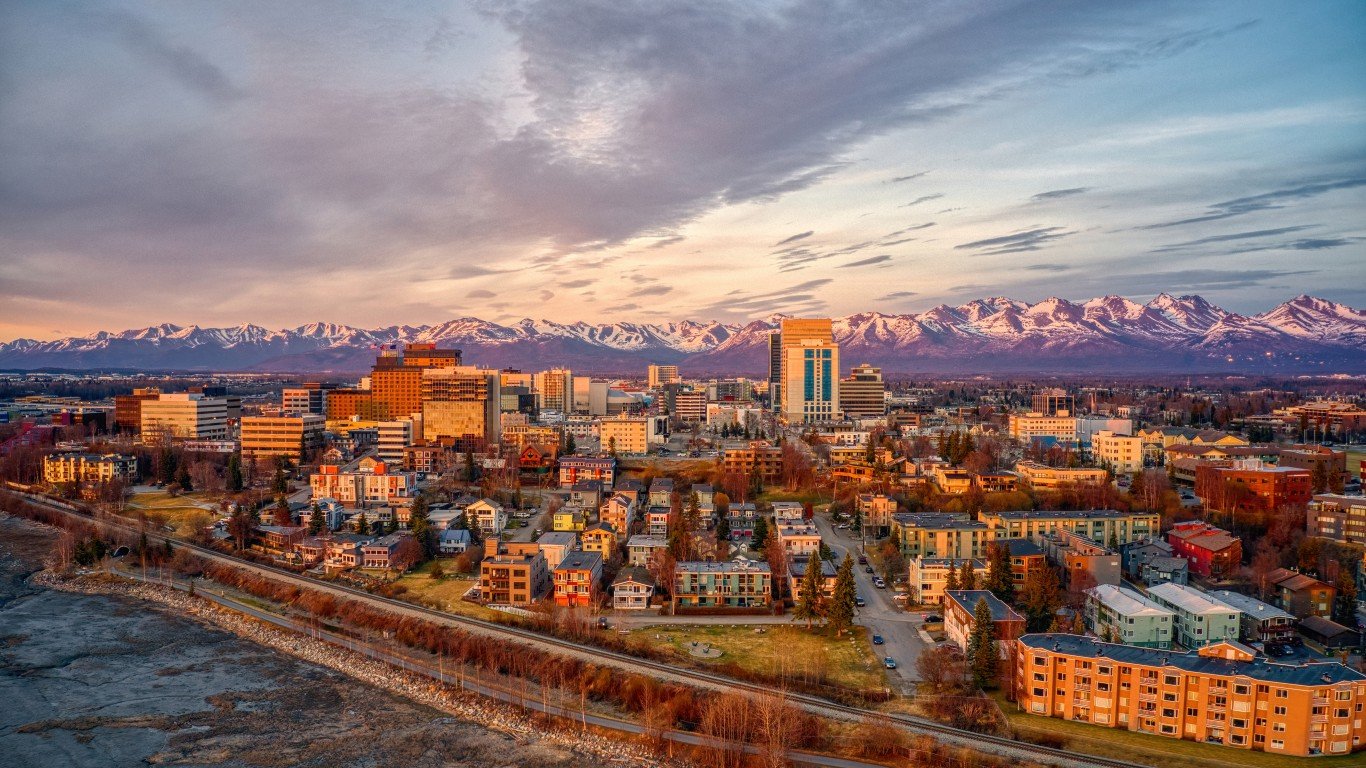
Source: Jacob Boomsma / iStock via Getty Images
44. Alaska
> Foreclosure rate, Q1 2022: 16.4 per 100,000 homes
> Chg. in foreclosure filings, Q1 2021 to Q1 2022: -32.5%
> Mortgages seriously underwater, Q1 2022: 2.6%
> Total housing units: 317,524
 24/7 Wall St.
Source: Sean Pavone / iStock via Getty Images
43. Idaho
> Foreclosure rate, Q1 2022: 16.6 per 100,000 homes
> Chg. in foreclosure filings, Q1 2021 to Q1 2022: +111.9%
> Mortgages seriously underwater, Q1 2022: 1.6%
> Total housing units: 751,859

Source: aiisha5 / iStock via Getty Images
42. Washington
> Foreclosure rate, Q1 2022: 20.1 per 100,000 homes
> Chg. in foreclosure filings, Q1 2021 to Q1 2022: +109.4%
> Mortgages seriously underwater, Q1 2022: 1.2%
> Total housing units: 3,202,241
[in-text-ad-2]

Source: Sean Pavone / iStock via Getty Images
41. Kentucky
> Foreclosure rate, Q1 2022: 20.9 per 100,000 homes
> Chg. in foreclosure filings, Q1 2021 to Q1 2022: + 7.8%
> Mortgages seriously underwater, Q1 2022: 6.3%
> Total housing units: 1,994,323

Source: ricardoreitmeyer / iStock via Getty Images
40. Kansas
> Foreclosure rate, Q1 2022: 21.2 per 100,000 homes
> Chg. in foreclosure filings, Q1 2021 to Q1 2022: +147.7%
> Mortgages seriously underwater, Q1 2022: 6.1%
> Total housing units: 1,275,689
[in-text-ad]

Source: SeanPavonePhoto / iStock via Getty Images
39. Rhode Island
> Foreclosure rate, Q1 2022: 29.2 per 100,000 homes
> Chg. in foreclosure filings, Q1 2021 to Q1 2022: +147.4%
> Mortgages seriously underwater, Q1 2022: 1.3%
> Total housing units: 483,474

Source: DenisTangneyJr / iStock via Getty Images
38. New Hampshire
> Foreclosure rate, Q1 2022: 30.2 per 100,000 homes
> Chg. in foreclosure filings, Q1 2021 to Q1 2022: +96.9%
> Mortgages seriously underwater, Q1 2022: 1.5%
> Total housing units: 638,795

Source: Davel5957 / E+ via Getty Images
37. Minnesota
> Foreclosure rate, Q1 2022: 31.1 per 100,000 homes
> Chg. in foreclosure filings, Q1 2021 to Q1 2022: +170.3%
> Mortgages seriously underwater, Q1 2022: 2.8%
> Total housing units: 2,485,558
[in-text-ad-2]
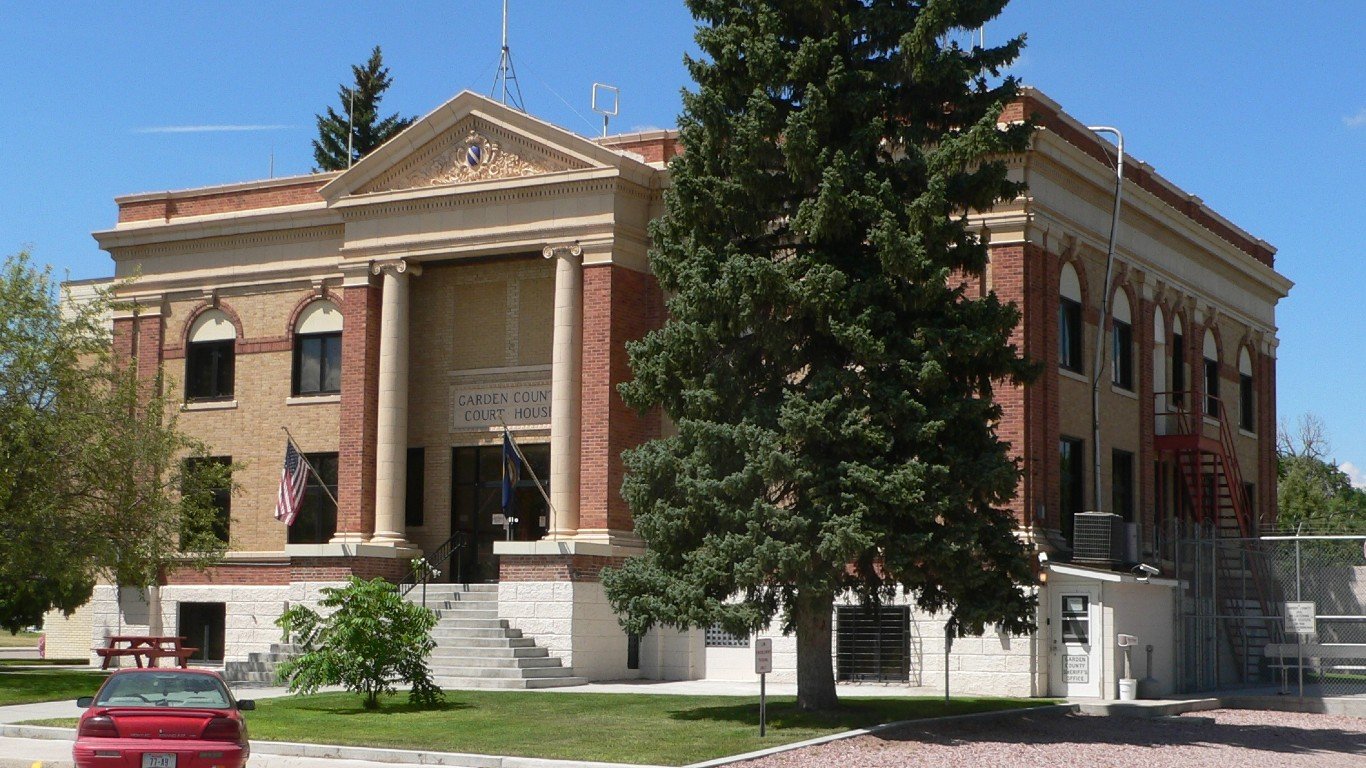
Source: Public Domain / Wikimedia Commons
36. Nebraska
> Foreclosure rate, Q1 2022: 31.6 per 100,000 homes
> Chg. in foreclosure filings, Q1 2021 to Q1 2022: +178.1%
> Mortgages seriously underwater, Q1 2022: 4.2%
> Total housing units: 844,278
Source: DenisTangneyJr / iStock via Getty Images
35. Massachusetts
> Foreclosure rate, Q1 2022: 32.2 per 100,000 homes
> Chg. in foreclosure filings, Q1 2021 to Q1 2022: +68.3%
> Mortgages seriously underwater, Q1 2022: 1.5%
> Total housing units: 2,998,537
[in-text-ad]

Source: mcpuckette / iStock via Getty Images
34. Arkansas
> Foreclosure rate, Q1 2022: 32.3 per 100,000 homes
> Chg. in foreclosure filings, Q1 2021 to Q1 2022: +143.6%
> Mortgages seriously underwater, Q1 2022: 6.1%
> Total housing units: 1,365,265

Source: SeanPavonePhoto / iStock via Getty Images
33. Mississippi
> Foreclosure rate, Q1 2022: 32.8 per 100,000 homes
> Chg. in foreclosure filings, Q1 2021 to Q1 2022: +73.2%
> Mortgages seriously underwater, Q1 2022: 17.0%
> Total housing units: 1,319,945
Source: Jacob Boomsma / iStock via Getty Images
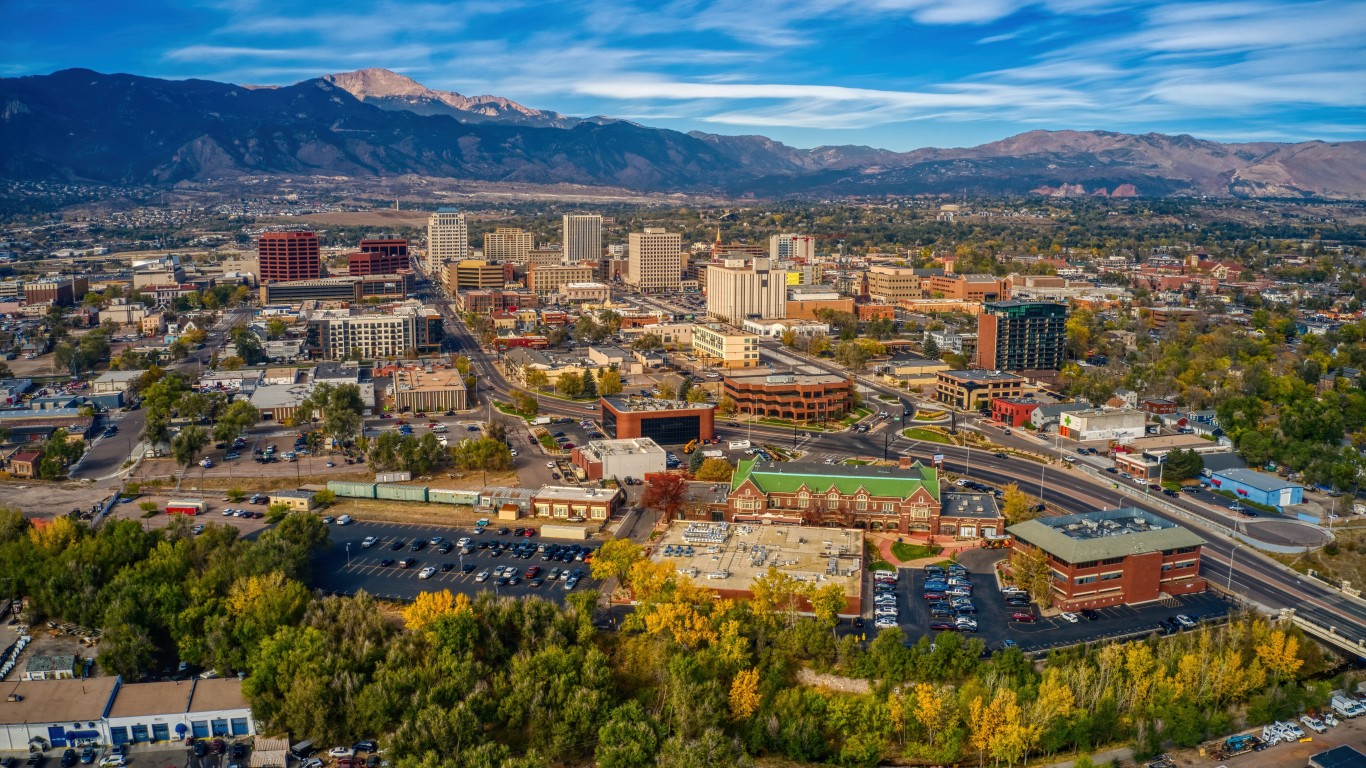
32. Colorado
> Foreclosure rate, Q1 2022: 33.3 per 100,000 homes
> Chg. in foreclosure filings, Q1 2021 to Q1 2022: +385.4%
> Mortgages seriously underwater, Q1 2022: 1.7%
> Total housing units: 2,491,404
[in-text-ad-2]
Source: DenisTangneyJr / E+ via Getty Images
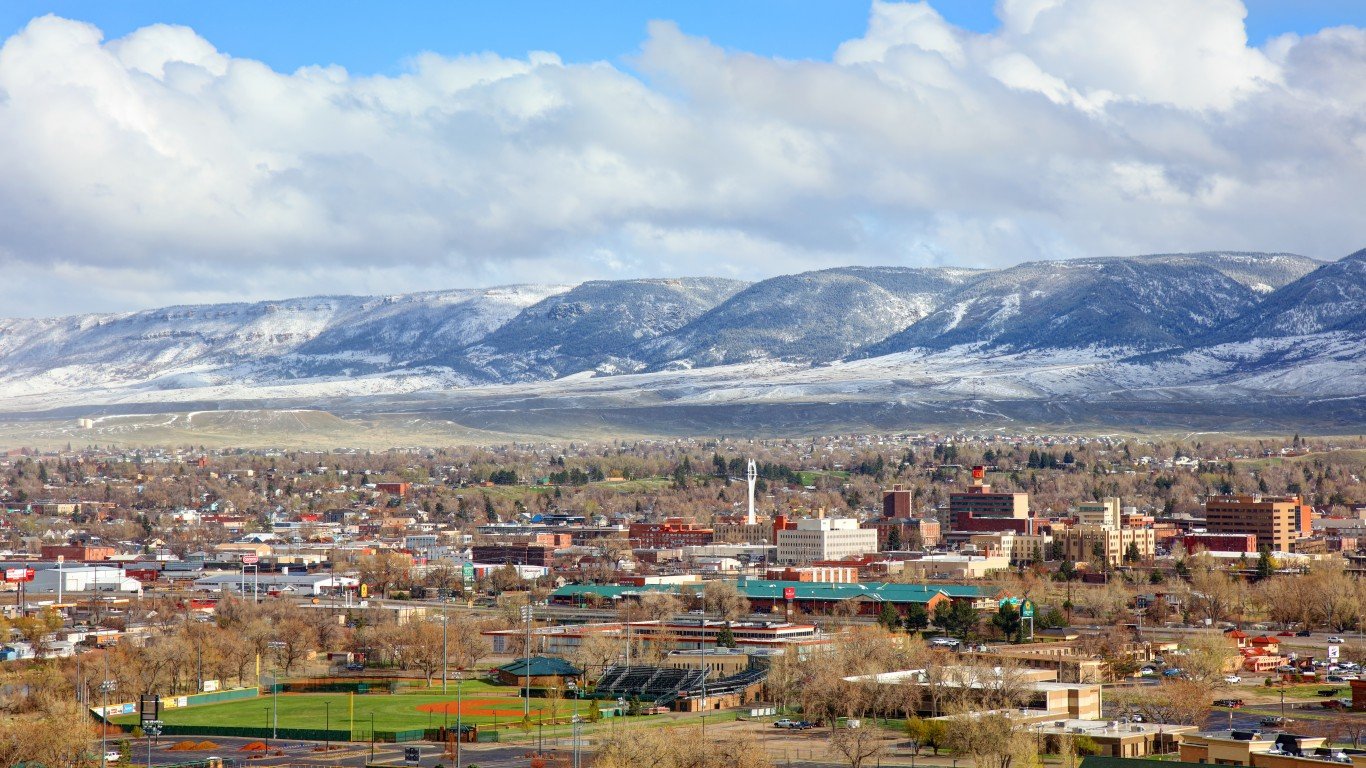
31. Wyoming
> Foreclosure rate, Q1 2022: 34.2 per 100,000 homes
> Chg. in foreclosure filings, Q1 2021 to Q1 2022: +14.8%
> Mortgages seriously underwater, Q1 2022: 10.0%
> Total housing units: 271,887
Source: JMKnewLife / iStock via Getty Images
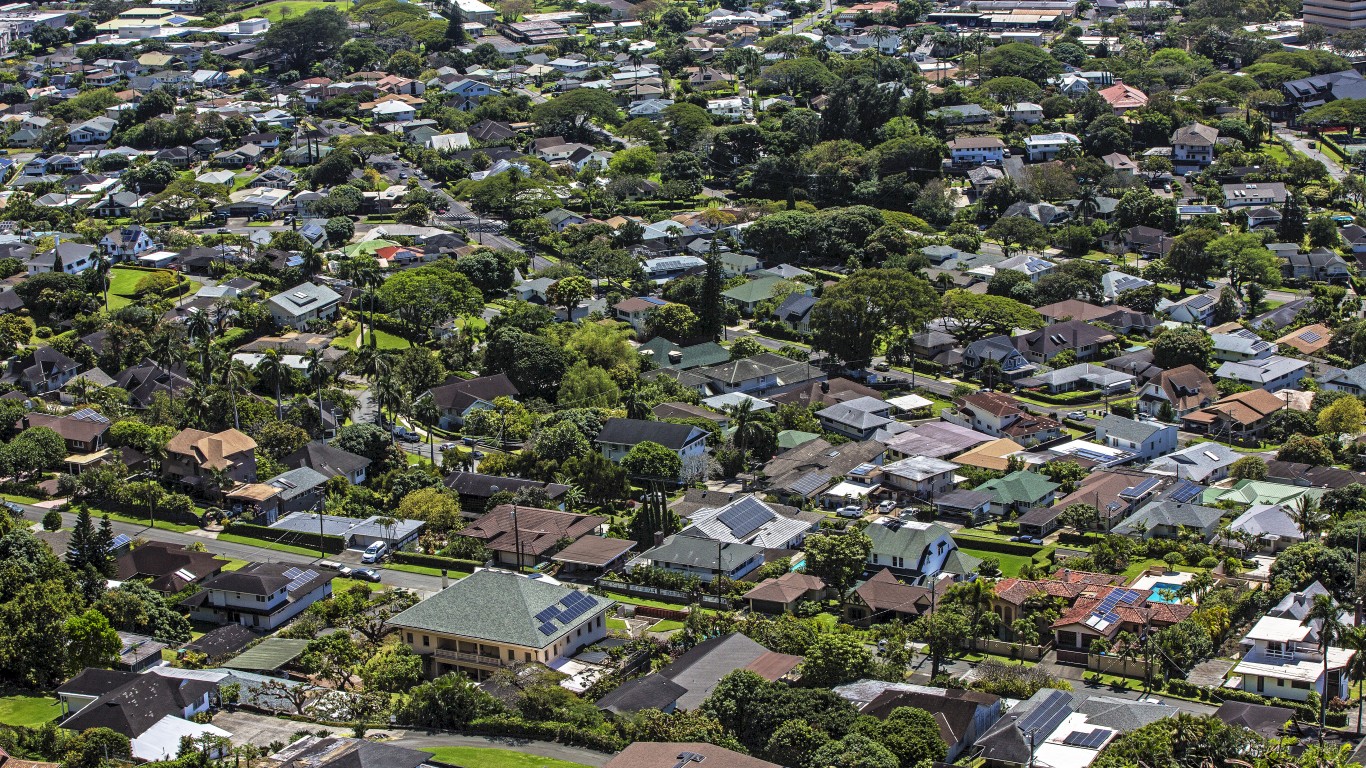
30. Hawaii
> Foreclosure rate, Q1 2022: 34.6 per 100,000 homes
> Chg. in foreclosure filings, Q1 2021 to Q1 2022: +84.8%
> Mortgages seriously underwater, Q1 2022: 1.4%
> Total housing units: 561,066
[in-text-ad]

Source: Sean Pavone / iStock via Getty Images
29. Virginia
> Foreclosure rate, Q1 2022: 35.6 per 100,000 homes
> Chg. in foreclosure filings, Q1 2021 to Q1 2022: +118.9%
> Mortgages seriously underwater, Q1 2022: 2.9%
> Total housing units: 3,618,247
 24/7 Wall St.
Source: Kruck20 / iStock via Getty Images
28. Tennessee
> Foreclosure rate, Q1 2022: 35.8 per 100,000 homes
> Chg. in foreclosure filings, Q1 2021 to Q1 2022: +125.4%
> Mortgages seriously underwater, Q1 2022: 2.9%
> Total housing units: 3,031,605

Source: Sean Pavone / iStock via Getty Images
27. Wisconsin
> Foreclosure rate, Q1 2022: 36.0 per 100,000 homes
> Chg. in foreclosure filings, Q1 2021 to Q1 2022: +42.3%
> Mortgages seriously underwater, Q1 2022: 4.5%
> Total housing units: 2,727,726
[in-text-ad-2]

Source: Ingus Kruklitis / iStock via Getty Images
26. New York
> Foreclosure rate, Q1 2022: 37.9 per 100,000 homes
> Chg. in foreclosure filings, Q1 2021 to Q1 2022: +261.6%
> Mortgages seriously underwater, Q1 2022: 2.7%
> Total housing units: 8,488,066

Source: DenisTangneyJr / iStock via Getty Images
25. New Mexico
> Foreclosure rate, Q1 2022: 40.0 per 100,000 homes
> Chg. in foreclosure filings, Q1 2021 to Q1 2022: +44.1%
> Mortgages seriously underwater, Q1 2022: 3.2%
> Total housing units: 940,859
[in-text-ad]

Source: f11photo / iStock via Getty Images
24. Missouri
> Foreclosure rate, Q1 2022: 41.3 per 100,000 homes
> Chg. in foreclosure filings, Q1 2021 to Q1 2022: +75.7%
> Mortgages seriously underwater, Q1 2022: 6.6%
> Total housing units: 2,786,621

Source: Barbara Smyers / iStock via Getty Images
23. Texas
> Foreclosure rate, Q1 2022: 43.0 per 100,000 homes
> Chg. in foreclosure filings, Q1 2021 to Q1 2022: +130.3%
> Mortgages seriously underwater, Q1 2022: 2.5%
> Total housing units: 11,589,324
Source: felixmizioznikov / iStock via Getty Images
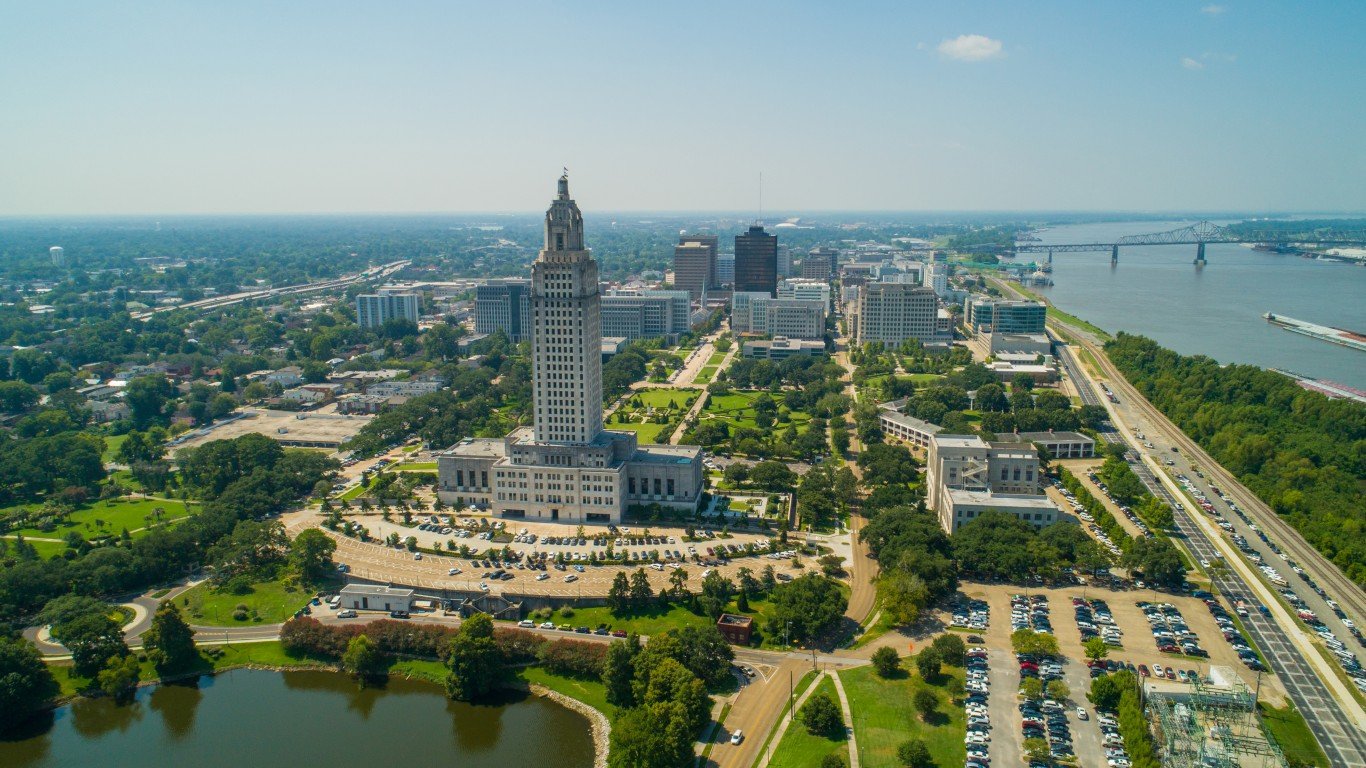
22. Louisiana
> Foreclosure rate, Q1 2022: 43.7 per 100,000 homes
> Chg. in foreclosure filings, Q1 2021 to Q1 2022: +18.7%
> Mortgages seriously underwater, Q1 2022: 11.3%
> Total housing units: 2,073,200
[in-text-ad-2]

Source: SeanPavonePhoto / iStock via Getty Images
21. Pennsylvania
> Foreclosure rate, Q1 2022: 47.0 per 100,000 homes
> Chg. in foreclosure filings, Q1 2021 to Q1 2022: +102.1%
> Mortgages seriously underwater, Q1 2022: 5.2%
> Total housing units: 5,742,828

Source: Kruck20 / iStock via Getty Images
20. North Carolina
> Foreclosure rate, Q1 2022: 48.1 per 100,000 homes
> Chg. in foreclosure filings, Q1 2021 to Q1 2022: +102.6%
> Mortgages seriously underwater, Q1 2022: 2.6%
> Total housing units: 4,708,710
[in-text-ad]
Source: DenisTangneyJr / E+ via Getty Images
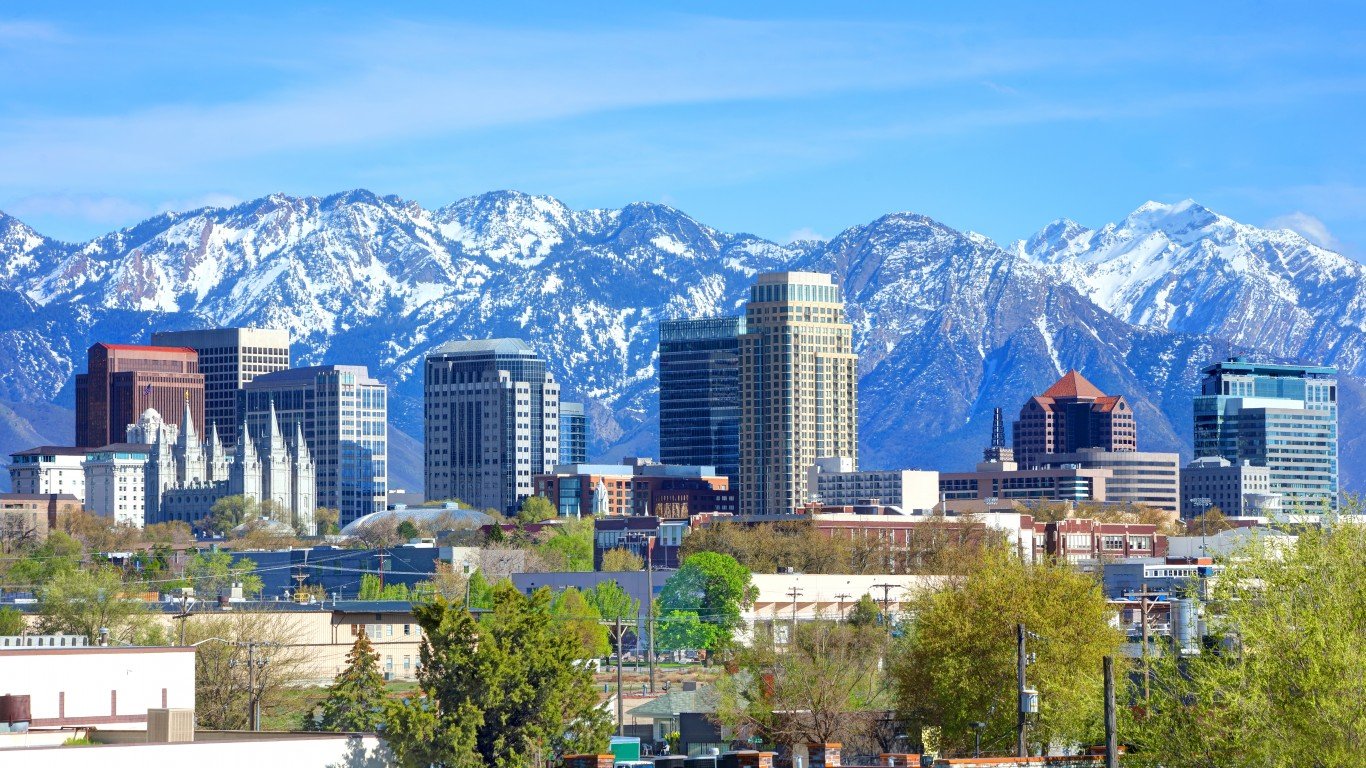
19. Utah
> Foreclosure rate, Q1 2022: 48.5 per 100,000 homes
> Chg. in foreclosure filings, Q1 2021 to Q1 2022: +71.2%
> Mortgages seriously underwater, Q1 2022: 1.4%
> Total housing units: 1,151,414
Source: Kruck20 / iStock via Getty Images
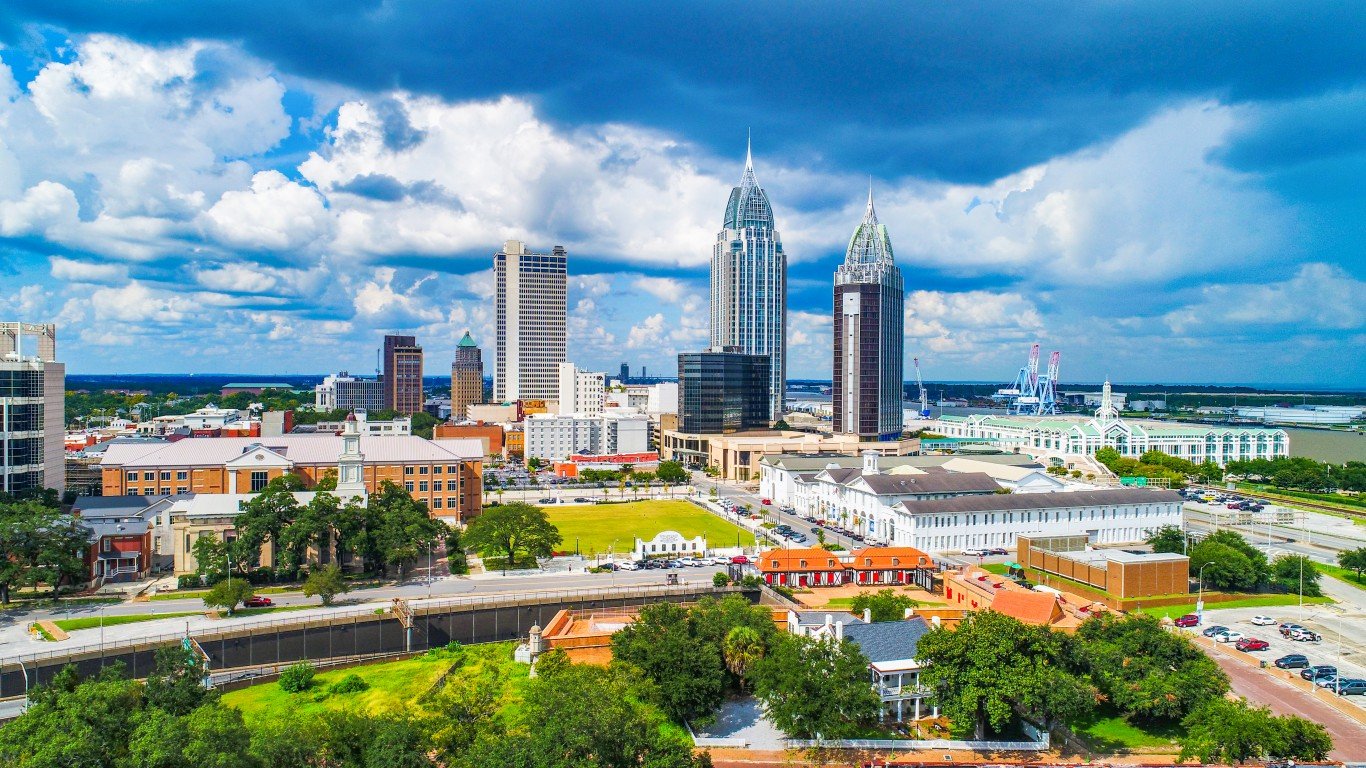
18. Alabama
> Foreclosure rate, Q1 2022: 49.9 per 100,000 homes
> Chg. in foreclosure filings, Q1 2021 to Q1 2022: +78.9%
> Mortgages seriously underwater, Q1 2022: 4.6%
> Total housing units: 2,288,330

Source: SeanPavonePhoto / iStock via Getty Images
17. Maine
> Foreclosure rate, Q1 2022: 50.5 per 100,000 homes
> Chg. in foreclosure filings, Q1 2021 to Q1 2022: +81.1%
> Mortgages seriously underwater, Q1 2022: 3.1%
> Total housing units: 739,072
[in-text-ad-2]

Source: dangarneau / iStock via Getty Images
16. Iowa
> Foreclosure rate, Q1 2022: 51.5 per 100,000 homes
> Chg. in foreclosure filings, Q1 2021 to Q1 2022: +78.0%
> Mortgages seriously underwater, Q1 2022: 7.4%
> Total housing units: 1,412,789

Source: Sean Pavone / iStock via Getty Images
15. Arizona
> Foreclosure rate, Q1 2022: 53.7 per 100,000 homes
> Chg. in foreclosure filings, Q1 2021 to Q1 2022: +134.2%
> Mortgages seriously underwater, Q1 2022: 1.4%
> Total housing units: 3,082,000
[in-text-ad]

Source: Jon Bilous / iStock via Getty Images
14. Connecticut
> Foreclosure rate, Q1 2022: 53.8 per 100,000 homes
> Chg. in foreclosure filings, Q1 2021 to Q1 2022: +120.3%
> Mortgages seriously underwater, Q1 2022: 4.0%
> Total housing units: 1,530,197

Source: Sean Pavone / iStock via Getty Images
13. Oklahoma
> Foreclosure rate, Q1 2022: 54.7 per 100,000 homes
> Chg. in foreclosure filings, Q1 2021 to Q1 2022: +111.5%
> Mortgages seriously underwater, Q1 2022: 4.8%
> Total housing units: 1,746,807

Source: SpVVK / iStock via Getty Images
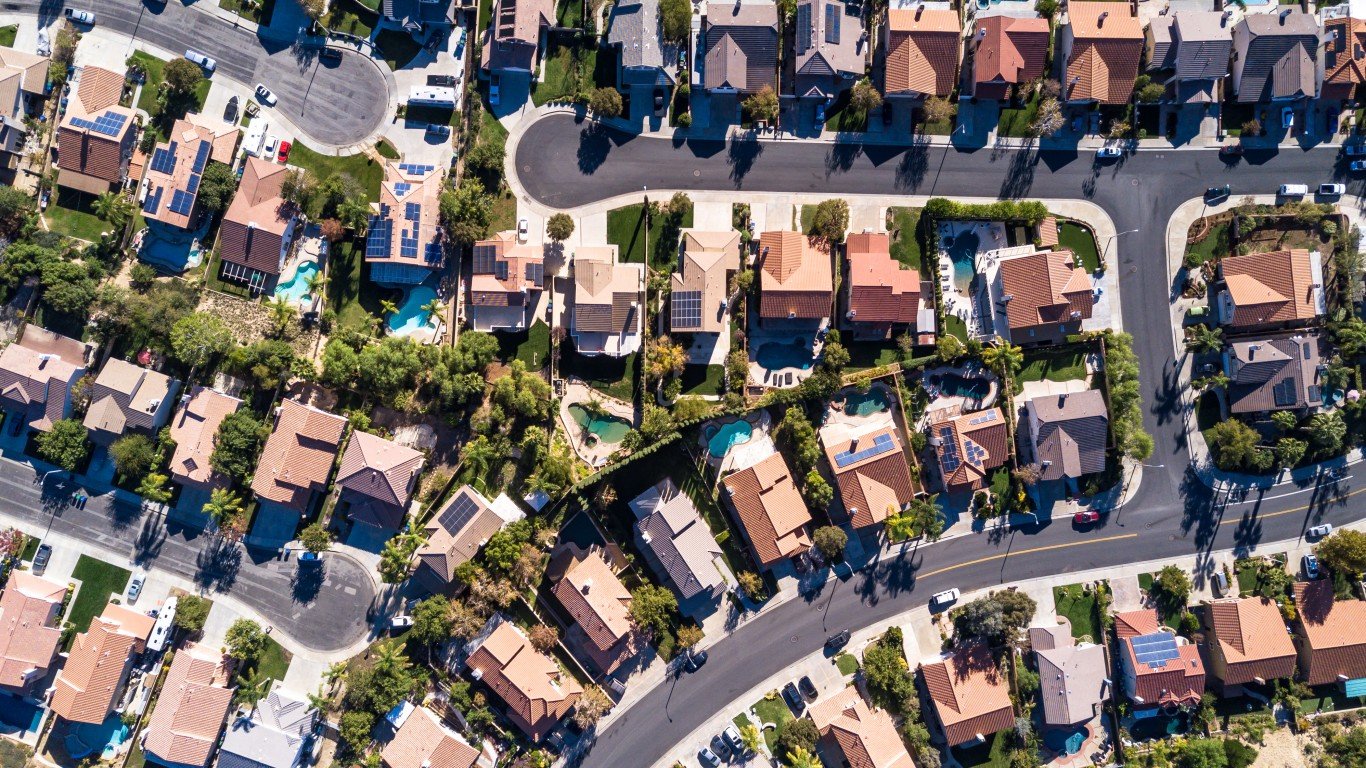
12. California
> Foreclosure rate, Q1 2022: 57.3 per 100,000 homes
> Chg. in foreclosure filings, Q1 2021 to Q1 2022: +119.6%
> Mortgages seriously underwater, Q1 2022: 1.2%
> Total housing units: 14,392,140
[in-text-ad-2]

Source: Kruck20 / iStock via Getty Images
11. Maryland
> Foreclosure rate, Q1 2022: 58.6 per 100,000 homes
> Chg. in foreclosure filings, Q1 2021 to Q1 2022: +132.4%
> Mortgages seriously underwater, Q1 2022: 3.2%
> Total housing units: 2,530,844

Source: SeanPavonePhoto / iStock via Getty Images
10. Georgia
> Foreclosure rate, Q1 2022: 58.8 per 100,000 homes
> Chg. in foreclosure filings, Q1 2021 to Q1 2022: +123.6%
> Mortgages seriously underwater, Q1 2022: 3.2%
> Total housing units: 4,410,956
[in-text-ad]

Source: pawel.gaul / E+ via Getty Images
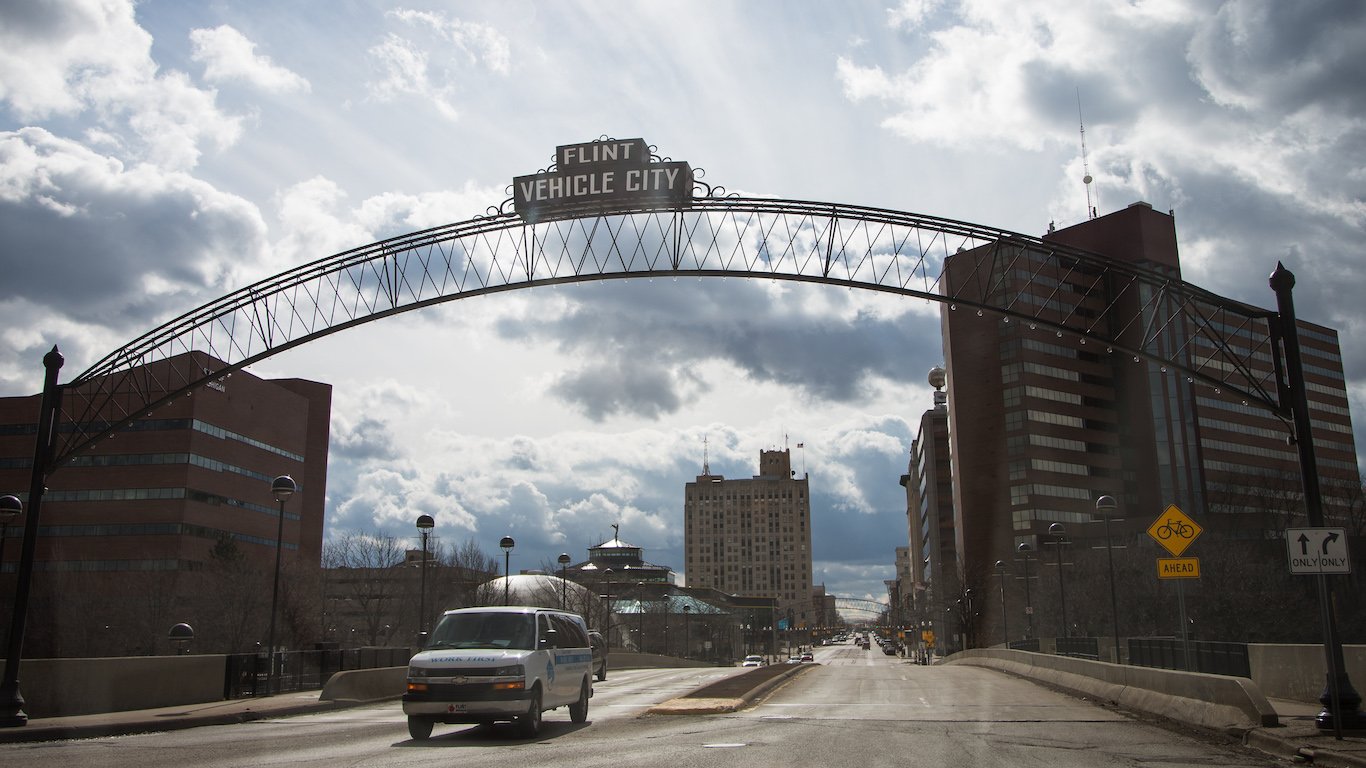
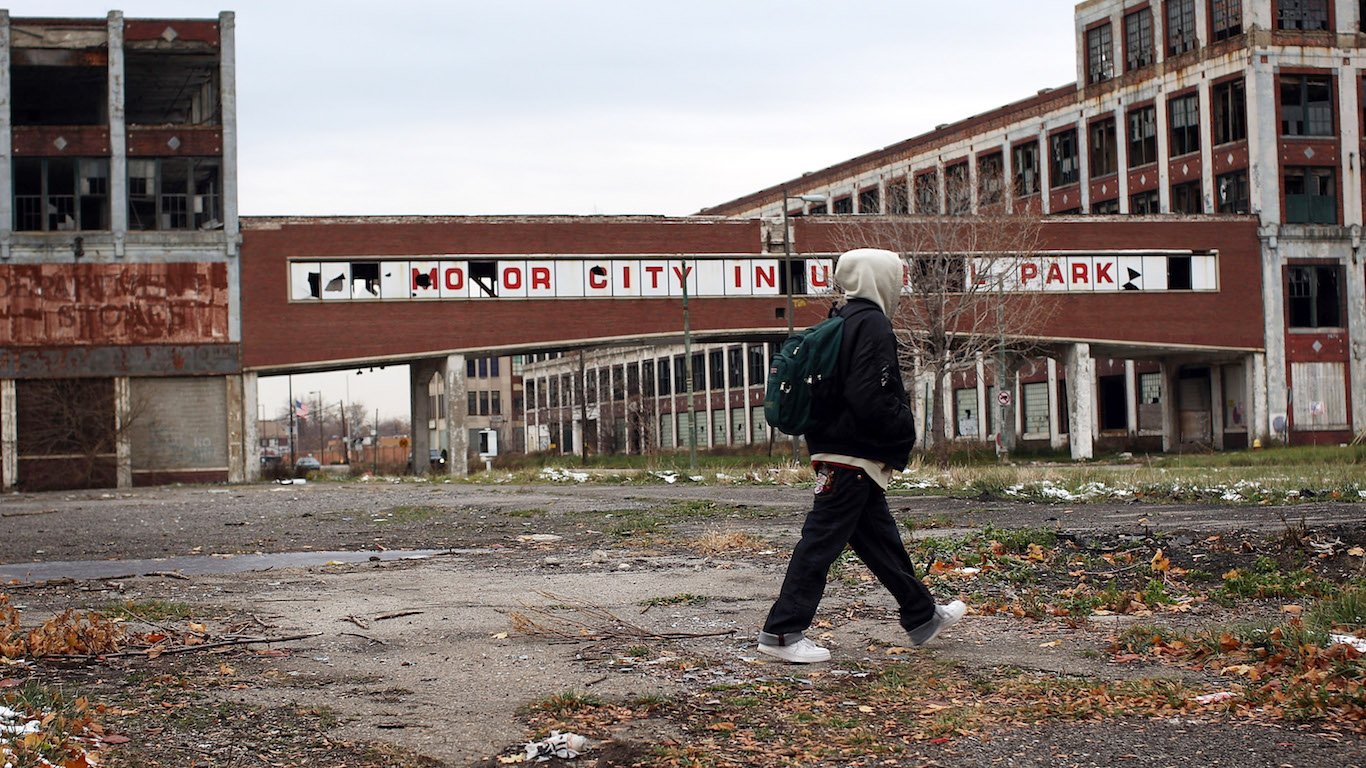
9. Michigan
> Foreclosure rate, Q1 2022: 70.1 per 100,000 homes
> Chg. in foreclosure filings, Q1 2021 to Q1 2022: +490.2%
> Mortgages seriously underwater, Q1 2022: 3.8%
> Total housing units: 4,570,173
 24/7 Wall St.
Source: SeanPavonePhoto / iStock via Getty Images
8. Florida
> Foreclosure rate, Q1 2022: 82.6 per 100,000 homes
> Chg. in foreclosure filings, Q1 2021 to Q1 2022: +92.9%
> Mortgages seriously underwater, Q1 2022: 1.4%
> Total housing units: 9,865,350

Source: Sean Pavone / iStock via Getty Images
7. Indiana
> Foreclosure rate, Q1 2022: 82.6 per 100,000 homes
> Chg. in foreclosure filings, Q1 2021 to Q1 2022: +100.6%
> Mortgages seriously underwater, Q1 2022: 3.9%
> Total housing units: 2,923,175
[in-text-ad-2]
Source: sframephoto / iStock via Getty Images
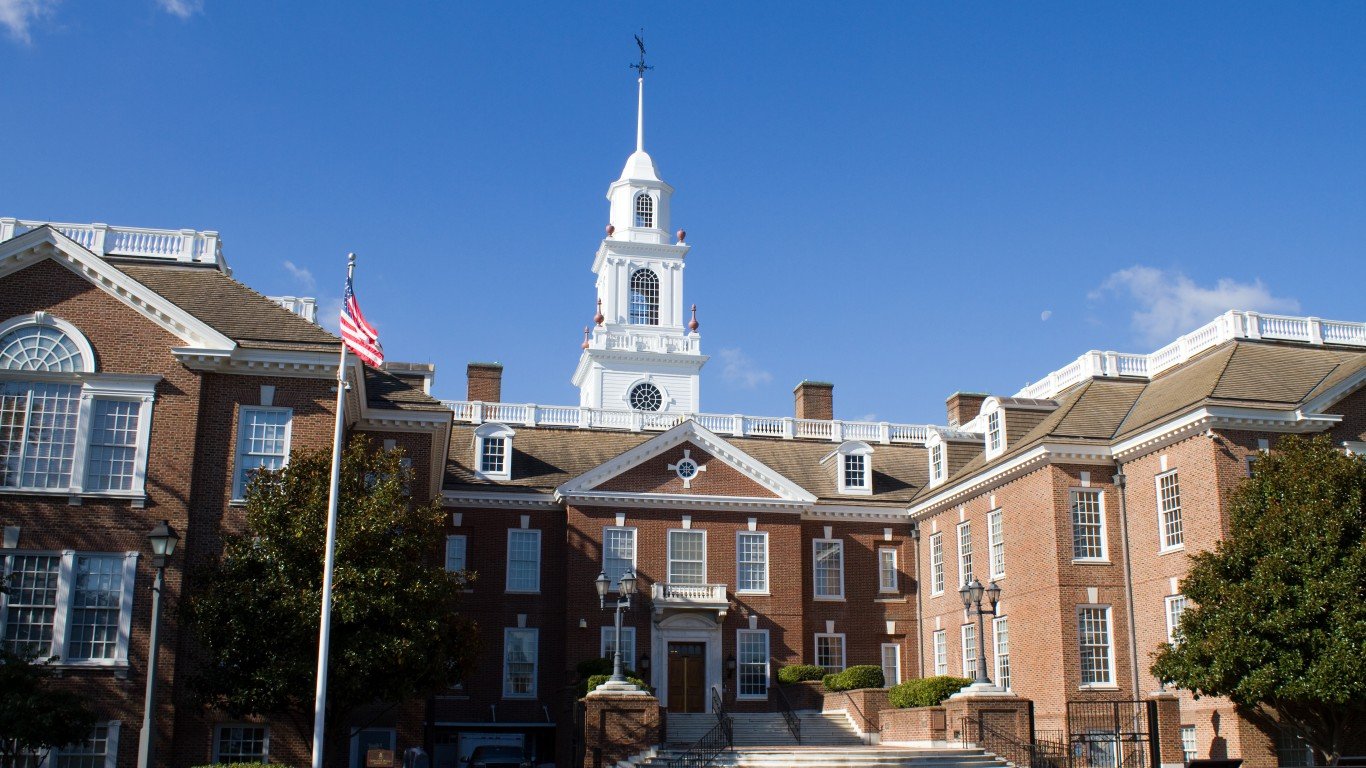
6. Delaware
> Foreclosure rate, Q1 2022: 86.0 per 100,000 homes
> Chg. in foreclosure filings, Q1 2021 to Q1 2022: +52.0%
> Mortgages seriously underwater, Q1 2022: 4.5%
> Total housing units: 448,735

Source: f11photo / iStock via Getty Images
5. Nevada
> Foreclosure rate, Q1 2022: 91.7 per 100,000 homes
> Chg. in foreclosure filings, Q1 2021 to Q1 2022: +487.5%
> Mortgages seriously underwater, Q1 2022: 1.2%
> Total housing units: 1,281,018
[in-text-ad]
Source: Sean Pavone / iStock via Getty Images
4. South Carolina
> Foreclosure rate, Q1 2022: 92.5 per 100,000 homes
> Chg. in foreclosure filings, Q1 2021 to Q1 2022: +158.9%
> Mortgages seriously underwater, Q1 2022: 3.4%
> Total housing units: 2,344,963

Source: Sean Pavone / iStock via Getty Images
3. Ohio
> Foreclosure rate, Q1 2022: 100.9 per 100,000 homes
> Chg. in foreclosure filings, Q1 2021 to Q1 2022: +154.2%
> Mortgages seriously underwater, Q1 2022: 5.3%
> Total housing units: 5,242,524
Source: ChrisBoswell / iStock via Getty Images
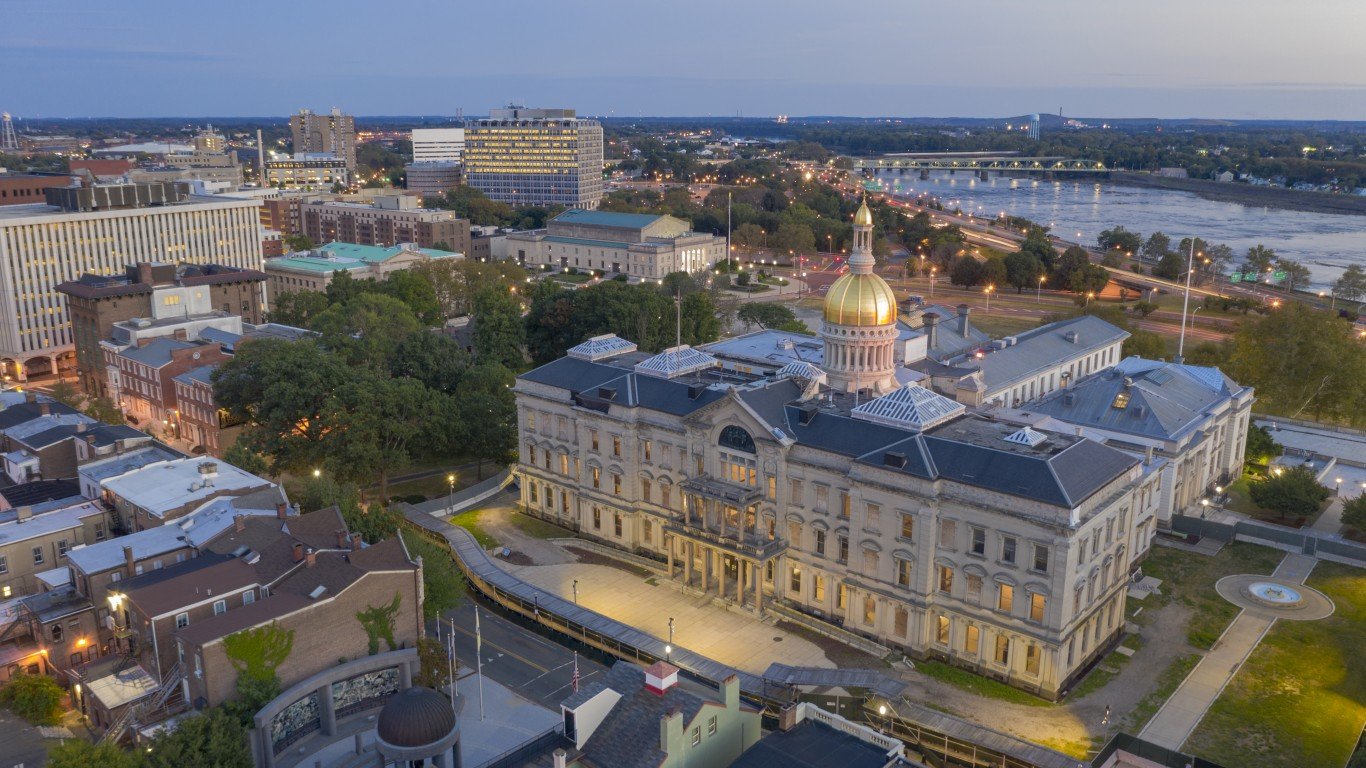
2. New Jersey
> Foreclosure rate, Q1 2022: 126.3 per 100,000 homes
> Chg. in foreclosure filings, Q1 2021 to Q1 2022: +311.8%
> Mortgages seriously underwater, Q1 2022: 2.9%
> Total housing units: 3,761,229
[in-text-ad-2]

Source: JaySi / iStock via Getty Images
1. Illinois
> Foreclosure rate, Q1 2022: 126.4 per 100,000 homes
> Chg. in foreclosure filings, Q1 2021 to Q1 2022: +178.4%
> Mortgages seriously underwater, Q1 2022: 7.2%
> Total housing units: 5,426,429
Take This Retirement Quiz To Get Matched With A Financial Advisor (Sponsored)
Take the quiz below to get matched with a financial advisor today.
Each advisor has been vetted by SmartAsset and is held to a fiduciary standard to act in your best interests.
Here’s how it works:
1. Answer SmartAsset advisor match quiz
2. Review your pre-screened matches at your leisure. Check out the
advisors’ profiles.
3. Speak with advisors at no cost to you. Have an introductory call on the phone or introduction in person and choose whom to work with in the future
Take the retirement quiz right here.
Thank you for reading! Have some feedback for us?
Contact the 24/7 Wall St. editorial team.
Editors' Picks