
Rents across the country have gone through a period of historical growth in the past two years. According to real estate research firm CoStar Group, rents in the U.S. rose 11.3% last year. In contrast, over the previous five years, gross rents increased by 18.1%.
Rising rent prices are the result of soaring inflation and a squeeze on inventory. This lack of supply relative to demand comes as the number of people seeking to rent has increased substantially during the pandemic, while the number of available properties has been limited by shortages of building materials and other delays in construction resulting from the pandemic. This is how many people have died from COVID in each state.
To determine the metros with the highest rent, 24/7 Wall St. reviewed five-year estimates of median gross rent from the U.S. Census Bureau’s 2020 American Community Survey. The median gross rent across the United States is $1,096, and in these 50 metropolitan areas, it ranges from $1,203 to as high as $2,365.
In many of the places where rent costs are higher, a higher share of housing units are occupied by renters, rather than homeowners. This is largely because these places have more expensive housing markets as a whole, meaning residents are priced out of the possibility of owning a home and are forced to rent. The U.S. median home value is $229,800. In the San Jose metropolitan area, the most expensive rental market nationwide, the typical home is valued at more than $1,000,000, the highest of any metro area.
Of the 50 metro areas with the most expensive rent, California has by far the most, with 16, followed by Florida with five and Colorado with four. Hawaii, which as a state has the highest average rent, at $1,651, has both of its metro areas featured on this list. (These are the states with the highest rent.)
This includes the Urban Honolulu metro area, which ranks fifth on this list, with a median gross rent of $1,779.
Generally, the metropolitan areas with the highest rents tend to have higher household incomes. However, even after accounting for those higher incomes, rent in these places is less affordable than is typical across the country. For the U.S. as a whole, median gross rent amounts to 29.6% of the median household income. In the vast majority of the metropolitan areas on this list, median gross rent amounts to at least 30% of the median household income.
Click here to see the most expensive city to rent a home
Click here to read our detailed methodology

Source: Sean Pavone / iStock via Getty Images
50. Hilton Head Island-Bluffton, SC
> Median monthly rental cost: $1,203
> Share of income typically spent on rent: 31.1% — 87th highest of 384 metros (tied)
> Rental occupied housing units: 25.4% — 26th lowest of 384 metros
> Median home value: $295,000 — 54th highest of 384 metros
[in-text-ad]

Source: Kruck20 / iStock via Getty Images
49. Atlanta-Sandy Springs-Alpharetta, GA
> Median monthly rental cost: $1,205
> Share of income typically spent on rent: 29.8% — 145th highest of 384 metros (tied)
> Rental occupied housing units: 35.8% — 123rd highest of 384 metros
> Median home value: $233,700 — 115th highest of 384 metros
 24/7 Wall St.
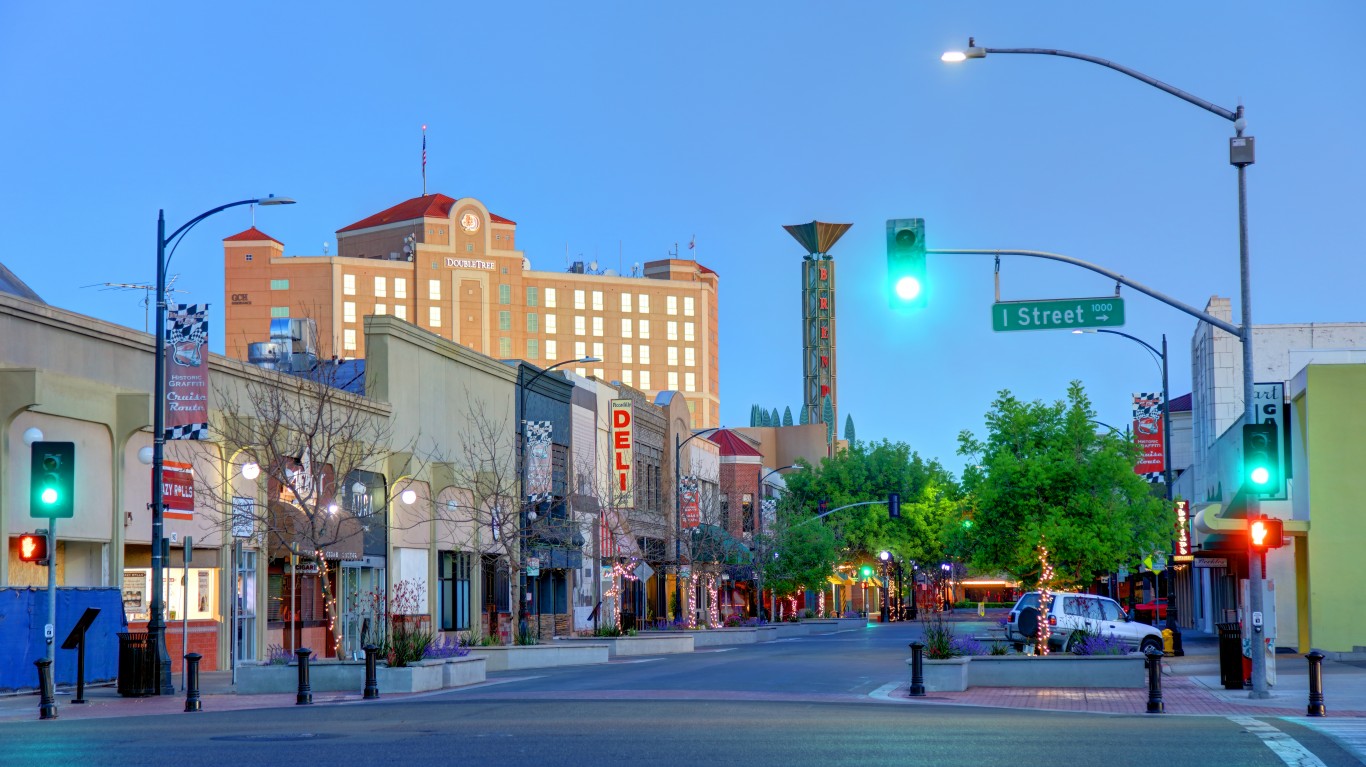
Source: DenisTangneyJr / iStock Unreleased via Getty Images
48. Modesto, CA
> Median monthly rental cost: $1,210
> Share of income typically spent on rent: 31.2% — 85th highest of 384 metros (tied)
> Rental occupied housing units: 41.3% — 44th highest of 384 metros
> Median home value: $314,100 — 40th highest of 384 metros

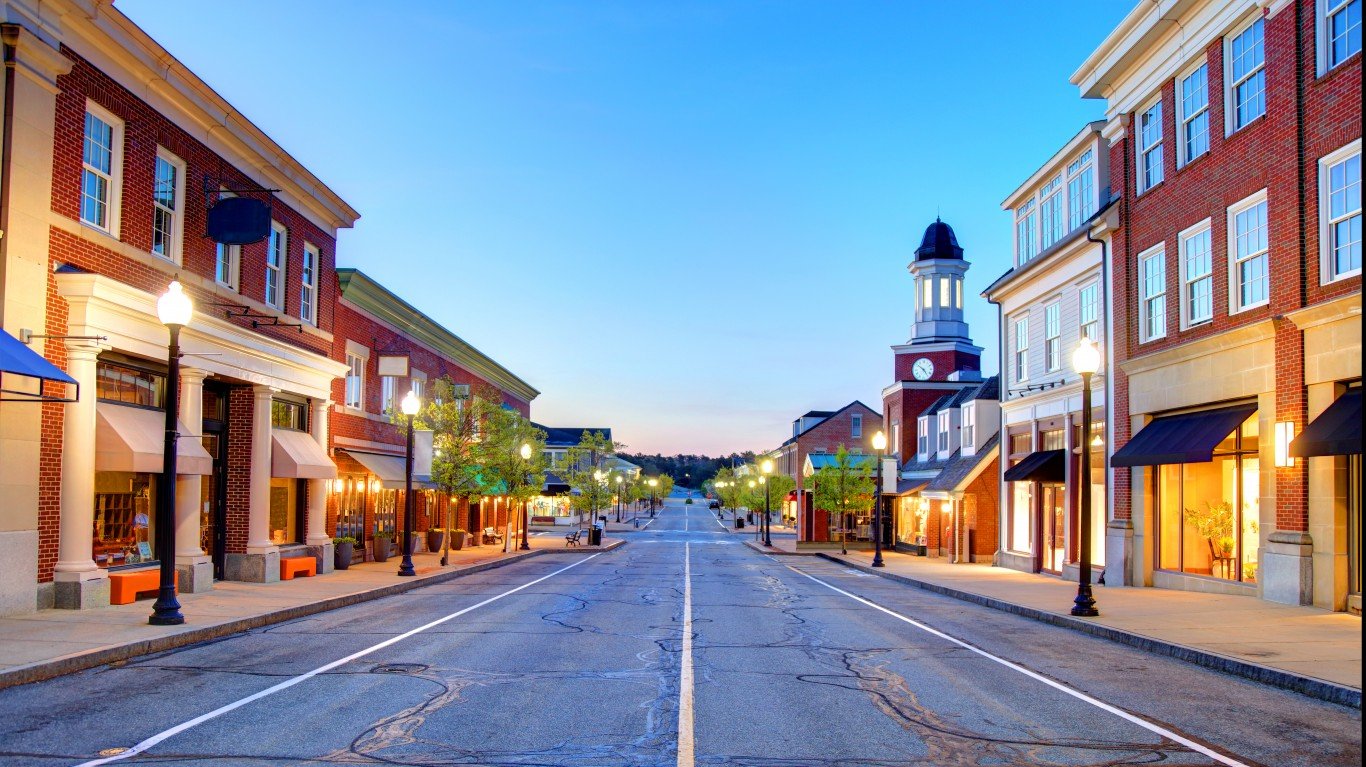
Source: Sean Pavone / iStock via Getty Images
47. Manchester-Nashua, NH
> Median monthly rental cost: $1,217
> Share of income typically spent on rent: 29.2% — 179th highest of 384 metros (tied)
> Rental occupied housing units: 34.3% — 162nd highest of 384 metros
> Median home value: $287,900 — 61st highest of 384 metros
[in-text-ad-2]
Source: CampPhoto / iStock via Getty Images
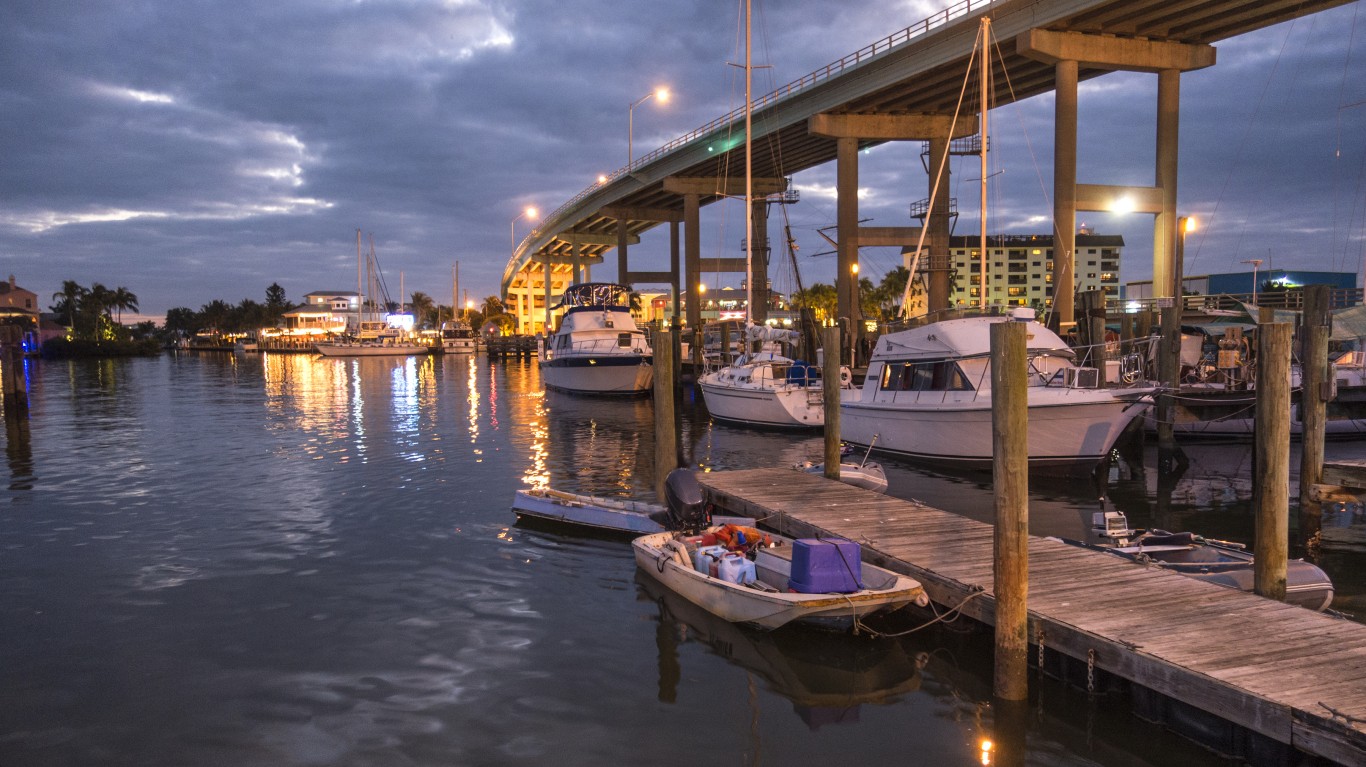
46. Cape Coral-Fort Myers, FL
> Median monthly rental cost: $1,225
> Share of income typically spent on rent: 31.9% — 61st highest of 384 metros (tied)
> Rental occupied housing units: 27.3% — 43rd lowest of 384 metros
> Median home value: $235,300 — 114th highest of 384 metros
Source: Jacob Boomsma / iStock via Getty Images
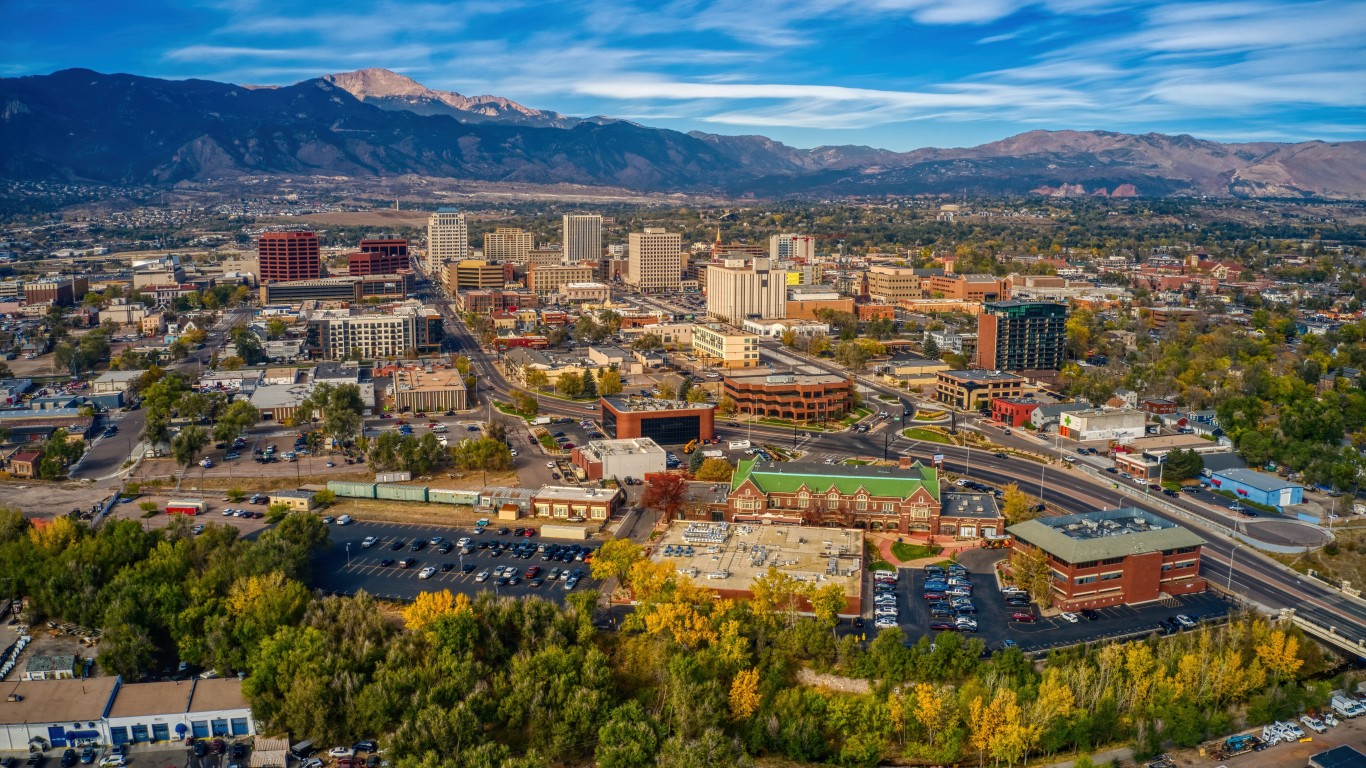
45. Colorado Springs, CO
> Median monthly rental cost: $1,232
> Share of income typically spent on rent: 31.4% — 78th highest of 384 metros (tied)
> Rental occupied housing units: 34.2% — 168th highest of 384 metros
> Median home value: $300,400 — 49th highest of 384 metros
[in-text-ad]

Source: DenisTangneyJr / iStock via Getty Images
44. Midland, TX
> Median monthly rental cost: $1,239
> Share of income typically spent on rent: 26.8% — 36th lowest of 384 metros (tied)
> Rental occupied housing units: 33.2% — 192nd highest of 384 metros
> Median home value: $231,100 — 117th highest of 384 metros
 24/7 Wall St.
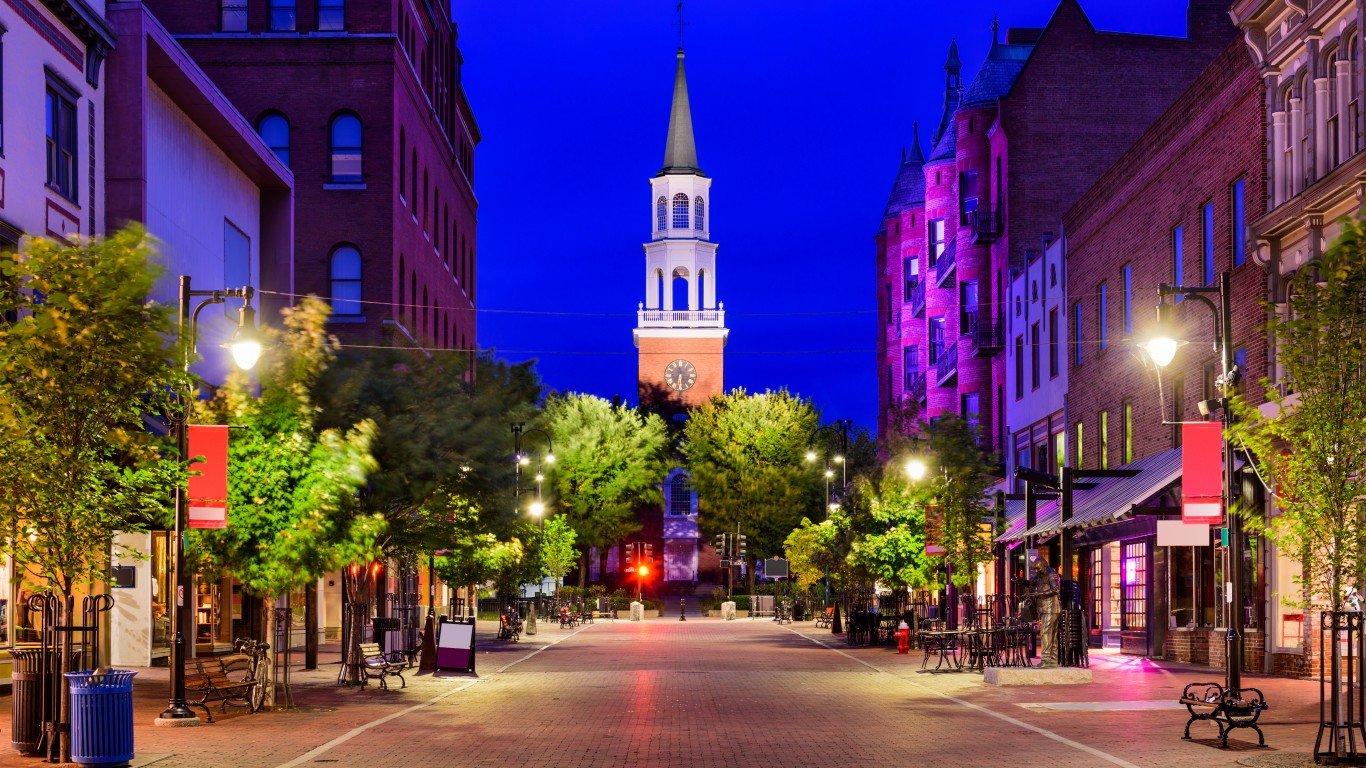
Source: SeanPavonePhoto / iStock via Getty Images
43. Burlington-South Burlington, VT
> Median monthly rental cost: $1,248
> Share of income typically spent on rent: 31.7% — 65th highest of 384 metros (tied)
> Rental occupied housing units: 33.2% — 191st lowest of 384 metros
> Median home value: $285,200 — 62nd highest of 384 metros
Source: Ryan McGill / iStock via Getty Images
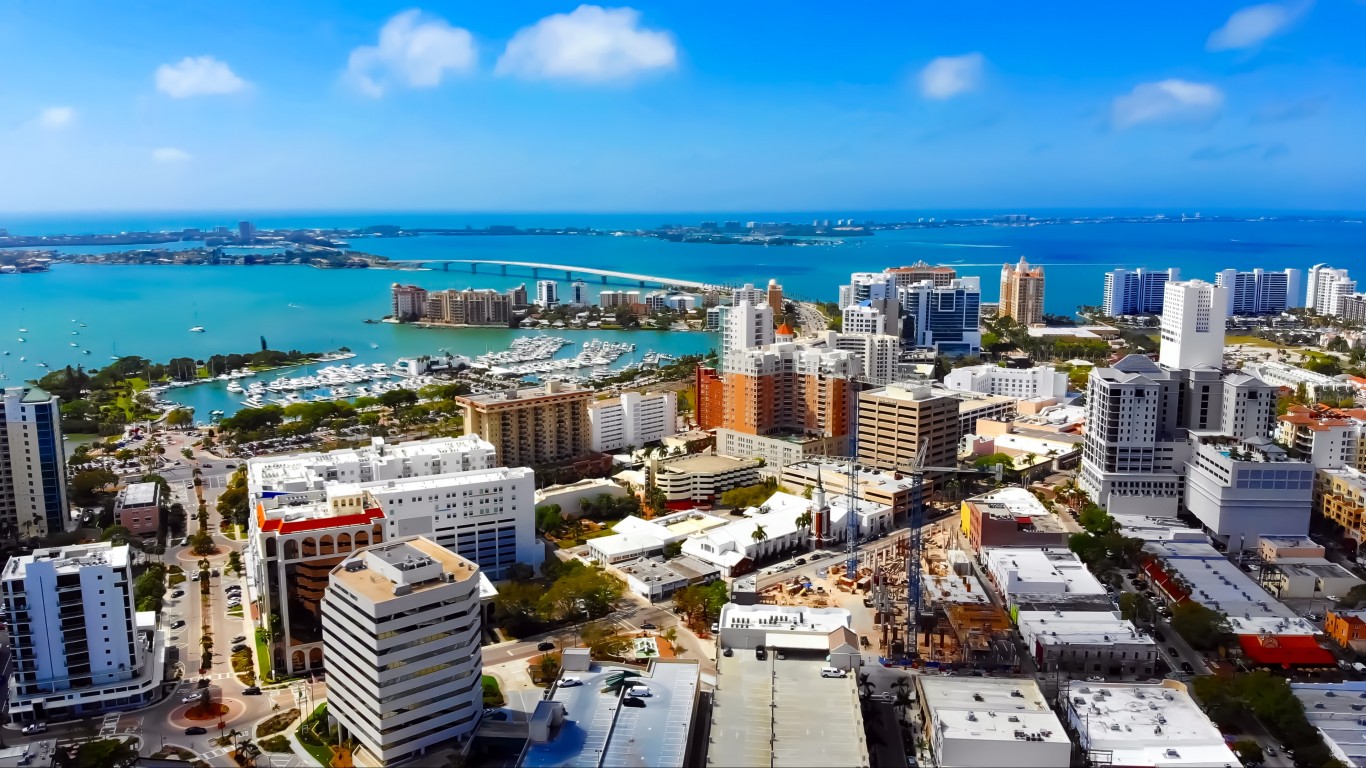
42. North Port-Sarasota-Bradenton, FL
> Median monthly rental cost: $1,259
> Share of income typically spent on rent: 32.4% — 45th highest of 384 metros (tied)
> Rental occupied housing units: 24.9% — 21st lowest of 384 metros
> Median home value: $261,100 — 82nd highest of 384 metros
[in-text-ad-2]

Source: BrianPIrwin / iStock Editorial via Getty Images
41. Charlottesville, VA
> Median monthly rental cost: $1,260
> Share of income typically spent on rent: 29.4% — 165th highest of 384 metros (tied)
> Rental occupied housing units: 36.2% — 115th highest of 384 metros
> Median home value: $304,700 — 44th highest of 384 metros (tied)

Source: TomasSereda / iStock via Getty Images
40. Poughkeepsie-Newburgh-Middletown, NY
> Median monthly rental cost: $1,267
> Share of income typically spent on rent: 32.2% — 50th highest of 384 metros (tied)
> Rental occupied housing units: 32.0% — 152nd lowest of 384 metros
> Median home value: $284,300 — 65th highest of 384 metros
[in-text-ad]

Source: SeanPavonePhoto / iStock via Getty Images
39. Orlando-Kissimmee-Sanford, FL
> Median monthly rental cost: $1,273
> Share of income typically spent on rent: 32.6% — 39th highest of 384 metros (tied)
> Rental occupied housing units: 38.1% — 78th highest of 384 metros
> Median home value: $242,100 — 105th highest of 384 metros
 24/7 Wall St.
Source: scottsfj40 / iStock via Getty Images
38. Olympia-Lacey-Tumwater, WA
> Median monthly rental cost: $1,275
> Share of income typically spent on rent: 31.1% — 87th highest of 384 metros (tied)
> Rental occupied housing units: 34.0% — 174th highest of 384 metros
> Median home value: $315,600 — 39th highest of 384 metros
Source: Jacob Boomsma / iStock via Getty Images
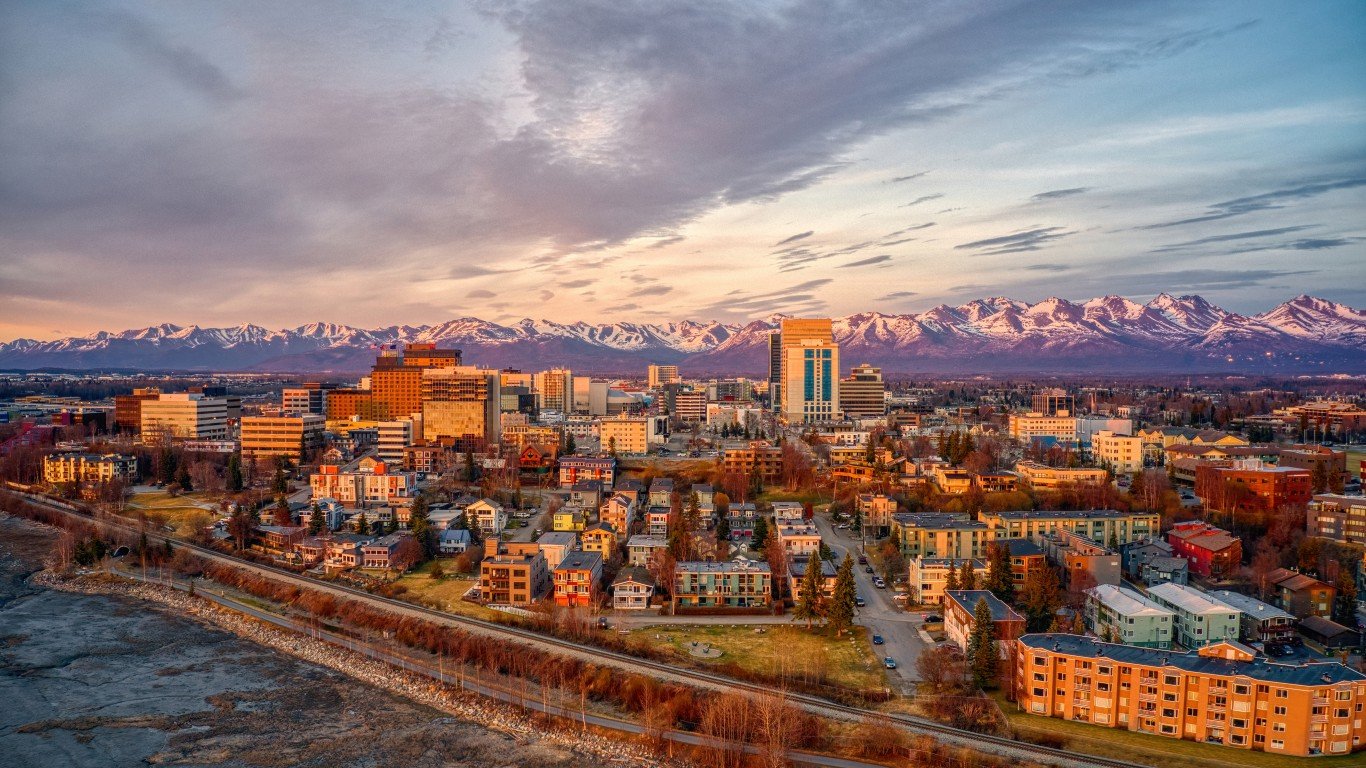
37. Anchorage, AK
> Median monthly rental cost: $1,277
> Share of income typically spent on rent: 28.7% — 155th lowest of 384 metros (tied)
> Rental occupied housing units: 34.4% — 157th highest of 384 metros
> Median home value: $301,100 — 48th highest of 384 metros
[in-text-ad-2]

Source: DenisTangneyJr / iStock via Getty Images
36. Stockton, CA
> Median monthly rental cost: $1,286
> Share of income typically spent on rent: 31.9% — 61st highest of 384 metros (tied)
> Rental occupied housing units: 42.3% — 34th highest of 384 metros
> Median home value: $367,900 — 28th highest of 384 metros

Source: DMartinez-Photo / iStock via Getty Images
35. Fairbanks, AK
> Median monthly rental cost: $1,297
> Share of income typically spent on rent: 27.3% — 65th lowest of 384 metros (tied)
> Rental occupied housing units: 41.1% — 45th highest of 384 metros
> Median home value: $240,300 — 107th highest of 384 metros
[in-text-ad]
Source: JamesBrey / iStock via Getty Images
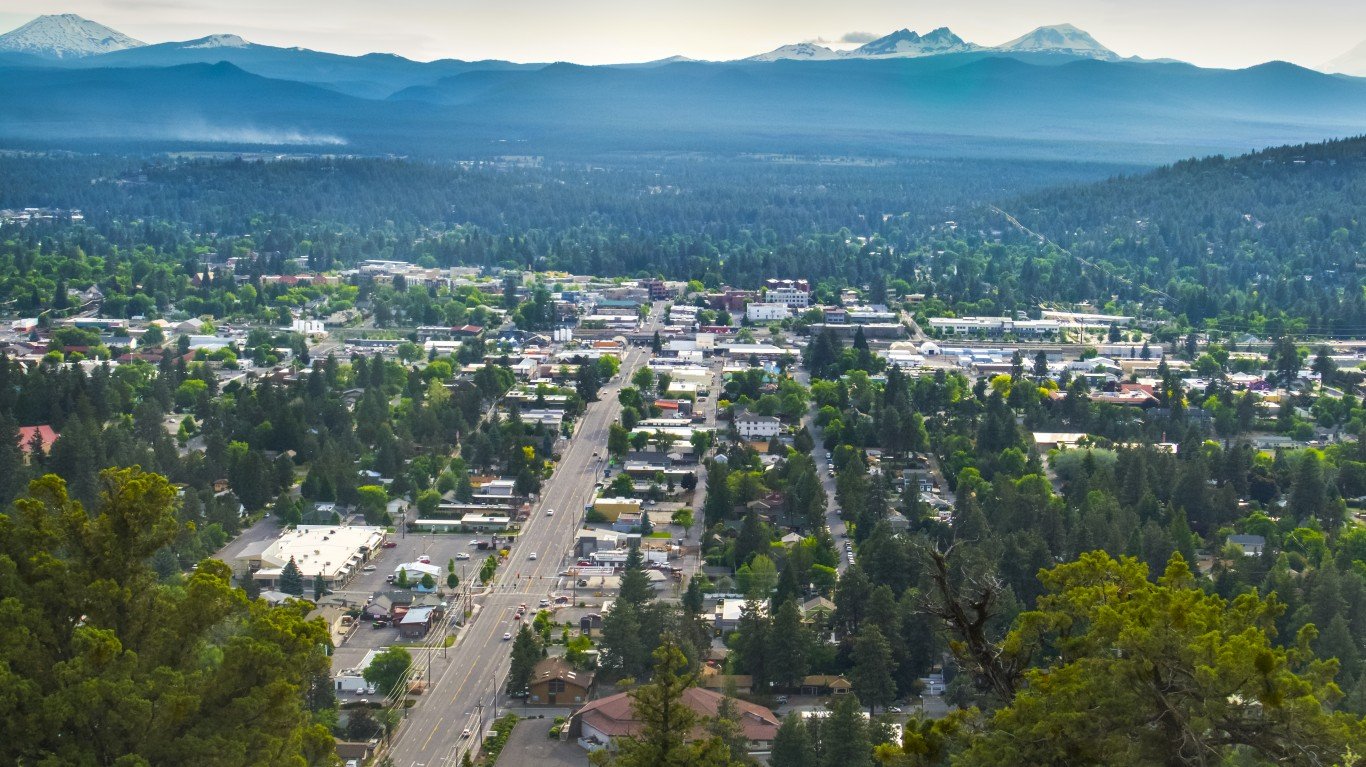
34. Bend, OR
> Median monthly rental cost: $1,306
> Share of income typically spent on rent: 30.9% — 97th highest of 384 metros (tied)
> Rental occupied housing units: 32.1% — 155th lowest of 384 metros
> Median home value: $389,300 — 26th highest of 384 metros

Source: Ultima_Gaina / iStock via Getty Images
33. Trenton-Princeton, NJ
> Median monthly rental cost: $1,311
> Share of income typically spent on rent: 30.6% — 109th highest of 384 metros (tied)
> Rental occupied housing units: 36.5% — 108th highest of 384 metros
> Median home value: $290,100 — 59th highest of 384 metros

Source: Kruck20 / iStock via Getty Images
32. Baltimore-Columbia-Towson, MD
> Median monthly rental cost: $1,324
> Share of income typically spent on rent: 29.4% — 165th highest of 384 metros (tied)
> Rental occupied housing units: 33.4% — 188th highest of 384 metros
> Median home value: $307,200 — 41st highest of 384 metros
[in-text-ad-2]

Source: Raymond Palmer / iStock via Getty Images
31. Austin-Round Rock-Georgetown, TX
> Median monthly rental cost: $1,326
> Share of income typically spent on rent: 28.7% — 155th lowest of 384 metros (tied)
> Rental occupied housing units: 41.4% — 42nd highest of 384 metros
> Median home value: $303,300 — 46th highest of 384 metros
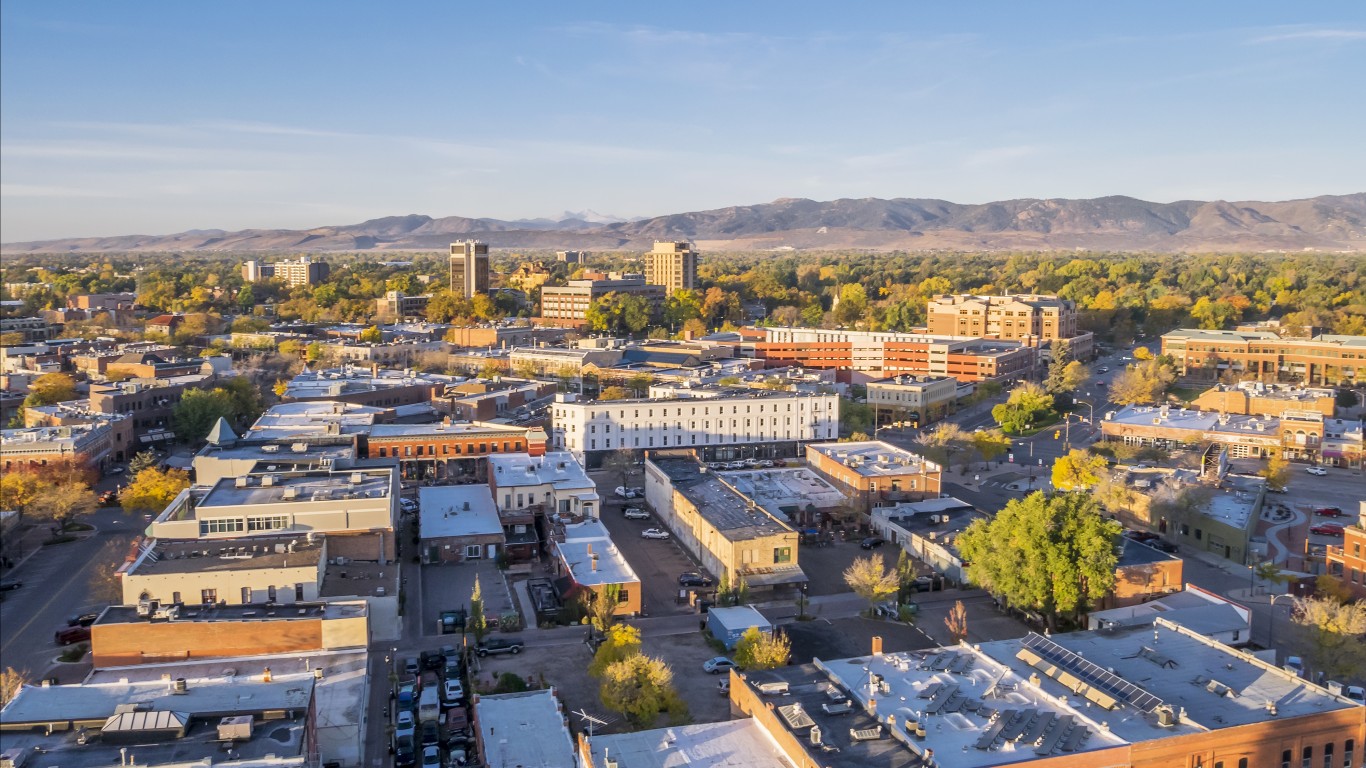
Source: marekuliasz / iStock via Getty Images
30. Fort Collins, CO
> Median monthly rental cost: $1,340
> Share of income typically spent on rent: 32.4% — 45th highest of 384 metros (tied)
> Rental occupied housing units: 33.7% — 182nd highest of 384 metros
> Median home value: $390,600 — 25th highest of 384 metros
[in-text-ad]

Source: jbentley09 / iStock via Getty Images
29. Portland-Vancouver-Hillsboro, OR-WA
> Median monthly rental cost: $1,345
> Share of income typically spent on rent: 29.9% — 138th highest of 384 metros (tied)
> Rental occupied housing units: 37.7% — 83rd highest of 384 metros
> Median home value: $392,000 — 24th highest of 384 metros

Source: jmoor17 / iStock via Getty Images
28. Bremerton-Silverdale-Port Orchard, WA
> Median monthly rental cost: $1,349
> Share of income typically spent on rent: 29.4% — 165th highest of 384 metros (tied)
> Rental occupied housing units: 31.9% — 148th lowest of 384 metros
> Median home value: $362,700 — 30th highest of 384 metros
Source: DenisTangneyJr / iStock via Getty Images
27. Barnstable Town, MA
> Median monthly rental cost: $1,362
> Share of income typically spent on rent: 32.8% — 36th highest of 384 metros (tied)
> Rental occupied housing units: 20.4% — 6th lowest of 384 metros
> Median home value: $414,000 — 21st highest of 384 metros
[in-text-ad-2]

Source: DenisTangneyJr / iStock via Getty Images
26. Sacramento-Roseville-Folsom, CA
> Median monthly rental cost: $1,364
> Share of income typically spent on rent: 32.0% — 56th highest of 384 metros (tied)
> Rental occupied housing units: 38.8% — 70th highest of 384 metros
> Median home value: $412,400 — 22nd highest of 384 metros

Source: Sean Pavone / iStock via Getty Images
25. Naples-Marco Island, FL
> Median monthly rental cost: $1,374
> Share of income typically spent on rent: 33.9% — 16th highest of 384 metros (tied)
> Rental occupied housing units: 25.6% — 29th lowest of 384 metros
> Median home value: $366,600 — 29th highest of 384 metros
[in-text-ad]
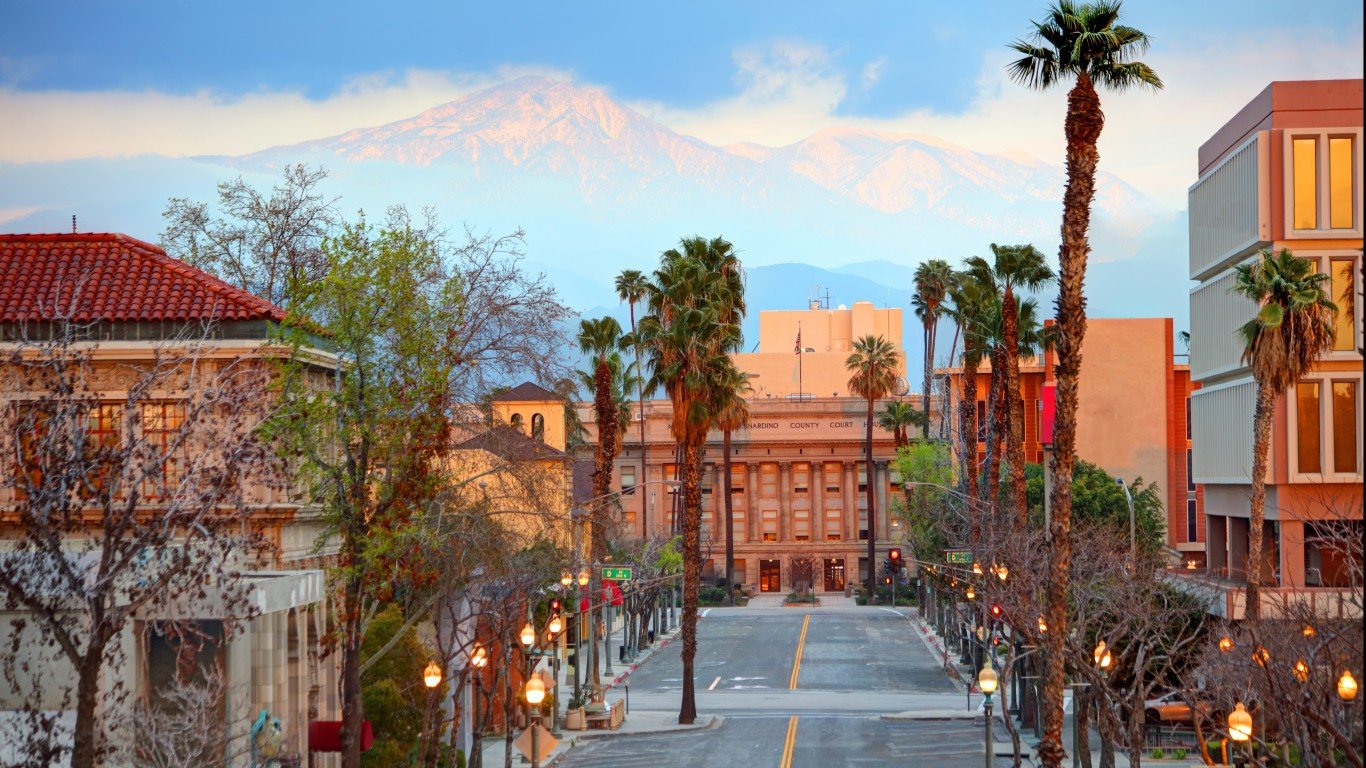
Source: DenisTangneyJr / iStock via Getty Images
24. Riverside-San Bernardino-Ontario, CA
> Median monthly rental cost: $1,387
> Share of income typically spent on rent: 33.9% — 16th highest of 384 metros (tied)
> Rental occupied housing units: 35.9% — 122nd highest of 384 metros
> Median home value: $360,100 — 31st highest of 384 metros
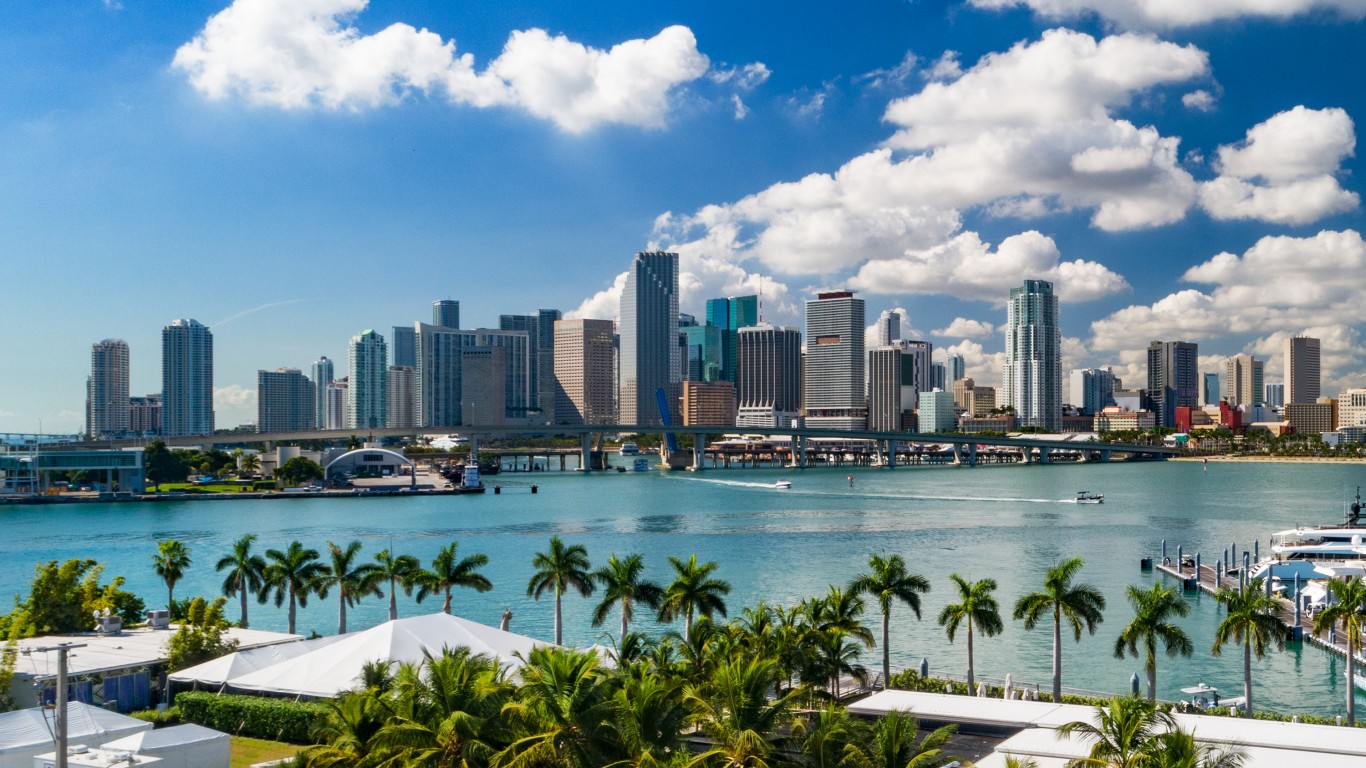
Source: Davel5957 / iStock via Getty Images
23. Miami-Fort Lauderdale-Pompano Beach, FL
> Median monthly rental cost: $1,408
> Share of income typically spent on rent: 36.8% — 4th highest of 384 metros
> Rental occupied housing units: 40.2% — 57th highest of 384 metros
> Median home value: $298,400 — 53rd highest of 384 metros

22. California-Lexington Park, MD
> Median monthly rental cost: $1,436
> Share of income typically spent on rent: 26.5% — 29th lowest of 384 metros (tied)
> Rental occupied housing units: 29.7% — 87th lowest of 384 metros
> Median home value: $318,500 — 38th highest of 384 metros
[in-text-ad-2]

Source: Kruck20 / iStock via Getty Images
21. Denver-Aurora-Lakewood, CO
> Median monthly rental cost: $1,446
> Share of income typically spent on rent: 30.1% — 127th highest of 384 metros (tied)
> Rental occupied housing units: 35.2% — 135th highest of 384 metros
> Median home value: $411,800 — 23rd highest of 384 metros

Source: TomasSereda / iStock via Getty Images
20. New York-Newark-Jersey City, NY-NJ-PA
> Median monthly rental cost: $1,483
> Share of income typically spent on rent: 31.0% — 95th highest of 384 metros (tied)
> Rental occupied housing units: 48.4% — 6th highest of 384 metros
> Median home value: $465,400 — 16th highest of 384 metros
[in-text-ad]
Source: DenisTangneyJr / iStock via Getty Images
19. Bridgeport-Stamford-Norwalk, CT
> Median monthly rental cost: $1,511
> Share of income typically spent on rent: 32.2% — 50th highest of 384 metros (tied)
> Rental occupied housing units: 33.3% — 190th highest of 384 metros
> Median home value: $433,000 — 20th highest of 384 metros

Source: bon9 / iStock via Getty Images
18. San Luis Obispo-Paso Robles, CA
> Median monthly rental cost: $1,535
> Share of income typically spent on rent: 32.5% — 41st highest of 384 metros (tied)
> Rental occupied housing units: 37.3% — 94th highest of 384 metros
> Median home value: $605,200 — 11th highest of 384 metros
Source: unclegene / iStock via Getty Images
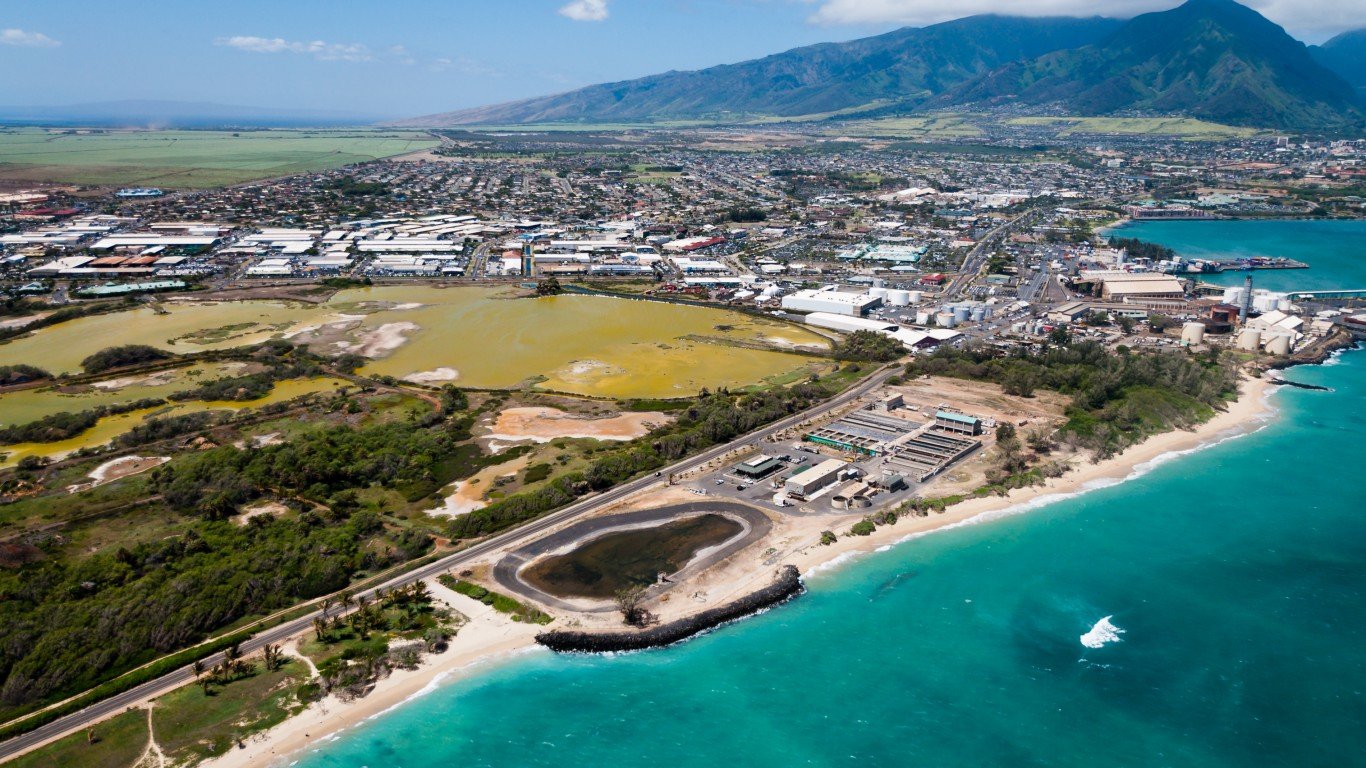
17. Kahului-Wailuku-Lahaina, HI
> Median monthly rental cost: $1,543
> Share of income typically spent on rent: 30.6% — 109th highest of 384 metros (tied)
> Rental occupied housing units: 37.5% — 91st highest of 384 metros
> Median home value: $657,400 — 6th highest of 384 metros
[in-text-ad-2]

Source: Vladone / iStock via Getty Images
16. Boston-Cambridge-Newton, MA-NH
> Median monthly rental cost: $1,555
> Share of income typically spent on rent: 29.3% — 173rd highest of 384 metros (tied)
> Rental occupied housing units: 38.3% — 75th highest of 384 metros
> Median home value: $461,500 — 17th highest of 384 metros

Source: beklaus / E+ via Getty Images
15. Boulder, CO
> Median monthly rental cost: $1,582
> Share of income typically spent on rent: 33.7% — 19th highest of 384 metros
> Rental occupied housing units: 36.4% — 112th highest of 384 metros
> Median home value: $539,100 — 14th highest of 384 metros
[in-text-ad]
Source: aiisha5 / iStock via Getty Images
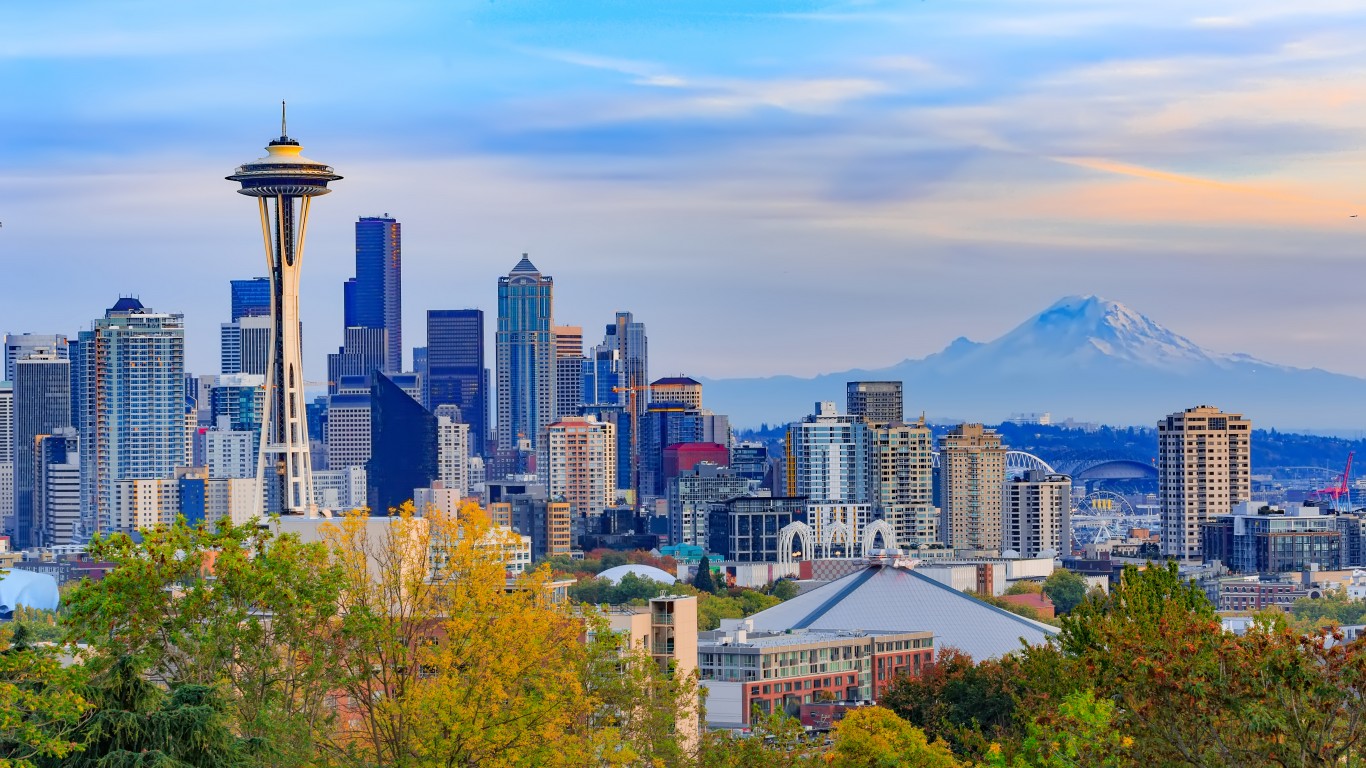
14. Seattle-Tacoma-Bellevue, WA
> Median monthly rental cost: $1,589
> Share of income typically spent on rent: 28.8% — 163rd lowest of 384 metros (tied)
> Rental occupied housing units: 39.8% — 63rd highest of 384 metros
> Median home value: $471,900 — 15th highest of 384 metros

13. Salinas, CA
> Median monthly rental cost: $1,600
> Share of income typically spent on rent: 32.5% — 41st highest of 384 metros (tied)
> Rental occupied housing units: 48.2% — 7th highest of 384 metros
> Median home value: $559,400 — 13th highest of 384 metros

Source: DutcherAerials / E+ via Getty Images
12. Los Angeles-Long Beach-Anaheim, CA
> Median monthly rental cost: $1,624
> Share of income typically spent on rent: 33.6% — 20th highest of 384 metros (tied)
> Rental occupied housing units: 51.3% — the highest of 384 metros
> Median home value: $641,300 — 7th highest of 384 metros
[in-text-ad-2]

Source: BackyardProduction / iStock via Getty Images
11. Vallejo, CA
> Median monthly rental cost: $1,684
> Share of income typically spent on rent: 31.6% — 68th highest of 384 metros (tied)
> Rental occupied housing units: 37.9% — 80th highest of 384 metros
> Median home value: $437,900 — 18th highest of 384 metros
Source: travelview / iStock via Getty Images
10. Santa Maria-Santa Barbara, CA
> Median monthly rental cost: $1,697
> Share of income typically spent on rent: 32.8% — 36th highest of 384 metros (tied)
> Rental occupied housing units: 47.7% — 9th highest of 384 metros
> Median home value: $610,300 — 9th highest of 384 metros
[in-text-ad]

Source: Matt Anderson / iStock via Getty Images
9. Washington-Arlington-Alexandria, DC-VA-MD-WV
> Median monthly rental cost: $1,718
> Share of income typically spent on rent: 28.7% — 155th lowest of 384 metros (tied)
> Rental occupied housing units: 36.1% — 119th highest of 384 metros
> Median home value: $436,600 — 19th highest of 384 metros
 24/7 Wall St.
Source: f8grapher / iStock via Getty Images
8. San Diego-Chula Vista-Carlsbad, CA
> Median monthly rental cost: $1,732
> Share of income typically spent on rent: 33.3% — 27th highest of 384 metros (tied)
> Rental occupied housing units: 46.1% — 13th highest of 384 metros
> Median home value: $595,600 — 12th highest of 384 metros

Source: Bob Corson / iStock via Getty Images
7. Santa Rosa-Petaluma, CA
> Median monthly rental cost: $1,743
> Share of income typically spent on rent: 32.3% — 47th highest of 384 metros (tied)
> Rental occupied housing units: 38.7% — 71st highest of 384 metros
> Median home value: $640,000 — 8th highest of 384 metros
[in-text-ad-2]
Source: MasaoTaira / iStock via Getty Images
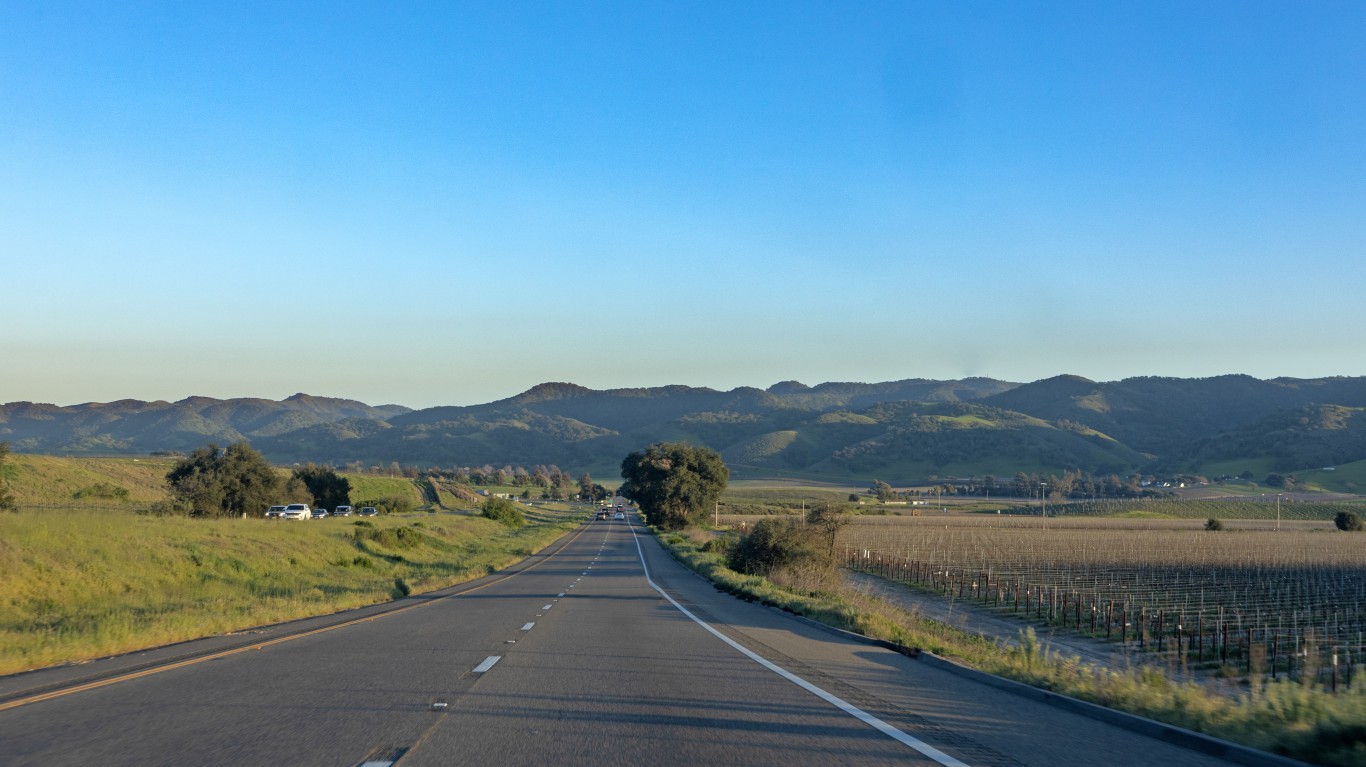
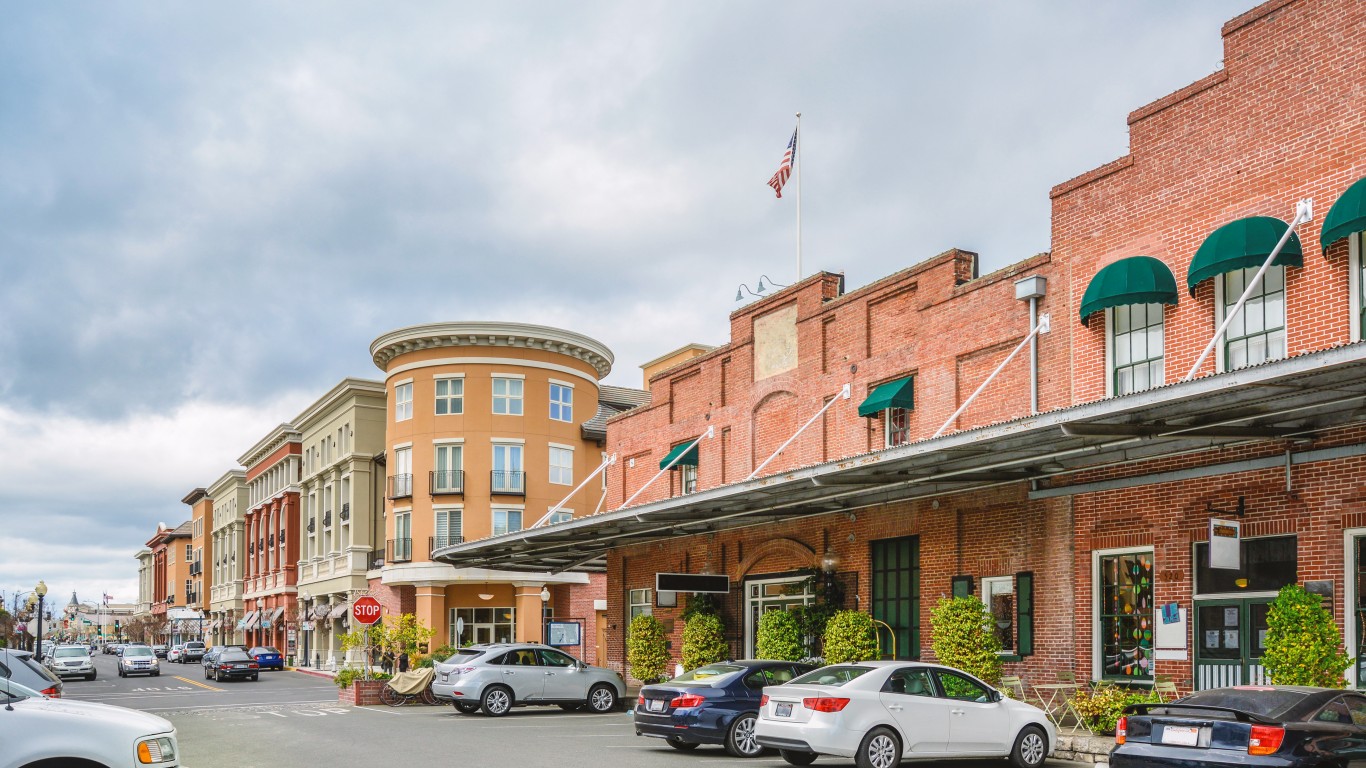
6. Napa, CA
> Median monthly rental cost: $1,775
> Share of income typically spent on rent: 31.4% — 78th highest of 384 metros (tied)
> Rental occupied housing units: 35.2% — 137th highest of 384 metros
> Median home value: $666,900 — 5th highest of 384 metros

5. Urban Honolulu, HI
> Median monthly rental cost: $1,779
> Share of income typically spent on rent: 33.4% — 25th highest of 384 metros (tied)
> Rental occupied housing units: 42.5% — 33rd highest of 384 metros
> Median home value: $702,300 — 4th highest of 384 metros
[in-text-ad]

Source: GomezDavid / E+ via Getty Images
4. Santa Cruz-Watsonville, CA
> Median monthly rental cost: $1,843
> Share of income typically spent on rent: 33.3% — 27th highest of 384 metros (tied)
> Rental occupied housing units: 39.7% — 66th highest of 384 metros
> Median home value: $787,000 — 3rd highest of 384 metros
 24/7 Wall St.
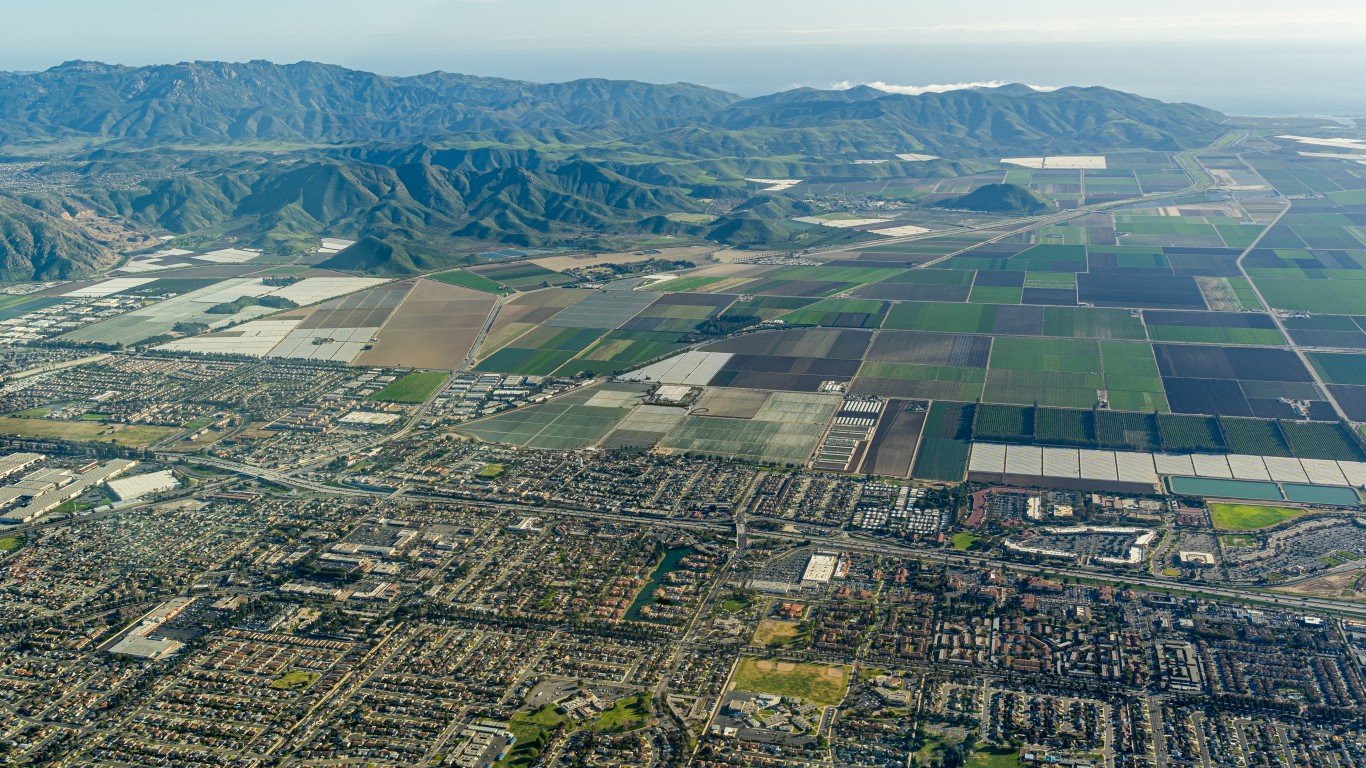
Source: jjwithers / iStock via Getty Images
3. Oxnard-Thousand Oaks-Ventura, CA
> Median monthly rental cost: $1,854
> Share of income typically spent on rent: 34.2% — 13th highest of 384 metros (tied)
> Rental occupied housing units: 36.7% — 104th highest of 384 metros
> Median home value: $609,200 — 10th highest of 384 metros

Source: bluejayphoto / iStock via Getty Images
2. San Francisco-Oakland-Berkeley, CA
> Median monthly rental cost: $2,021
> Share of income typically spent on rent: 28.1% — 116th lowest of 384 metros (tied)
> Rental occupied housing units: 45.0% — 19th highest of 384 metros
> Median home value: $888,500 — 2nd highest of 384 metros
[in-text-ad-2]
Source: GerardoBrucker / iStock via Getty Images
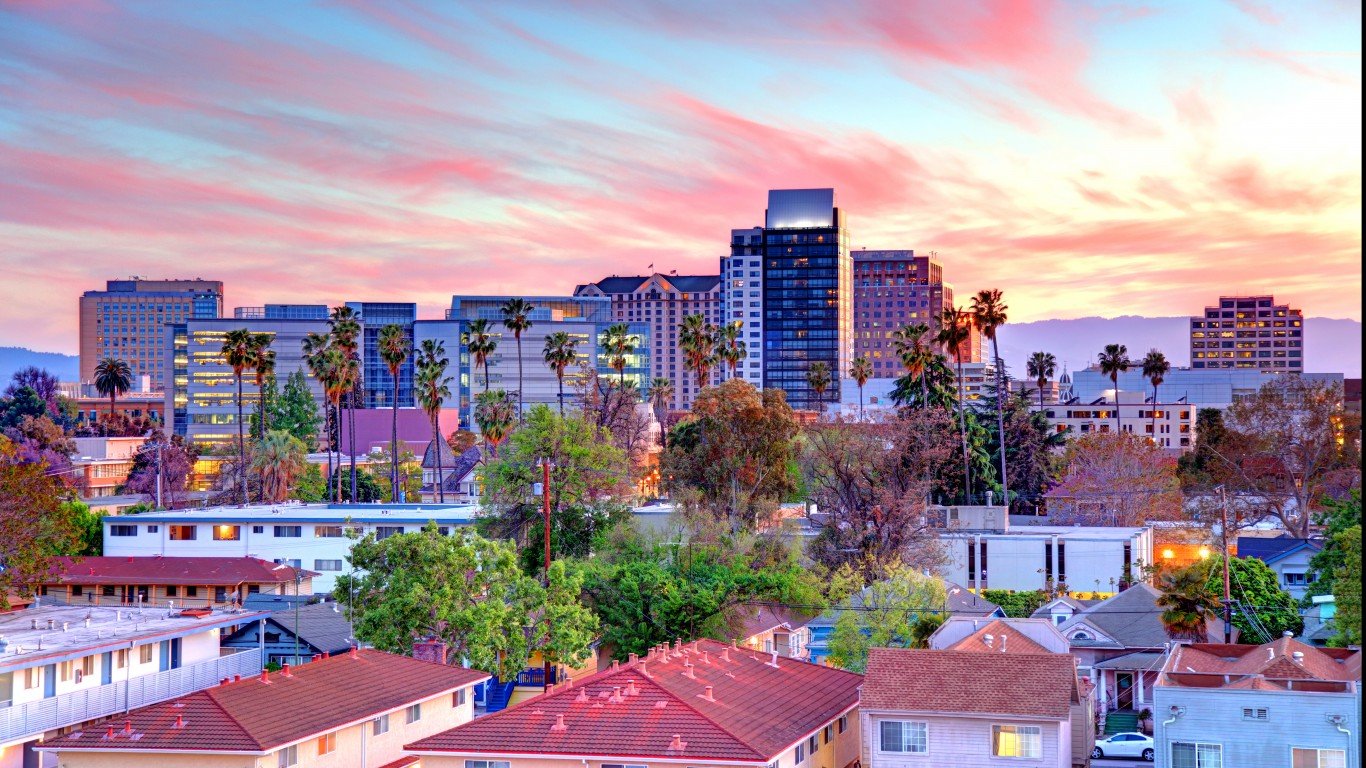
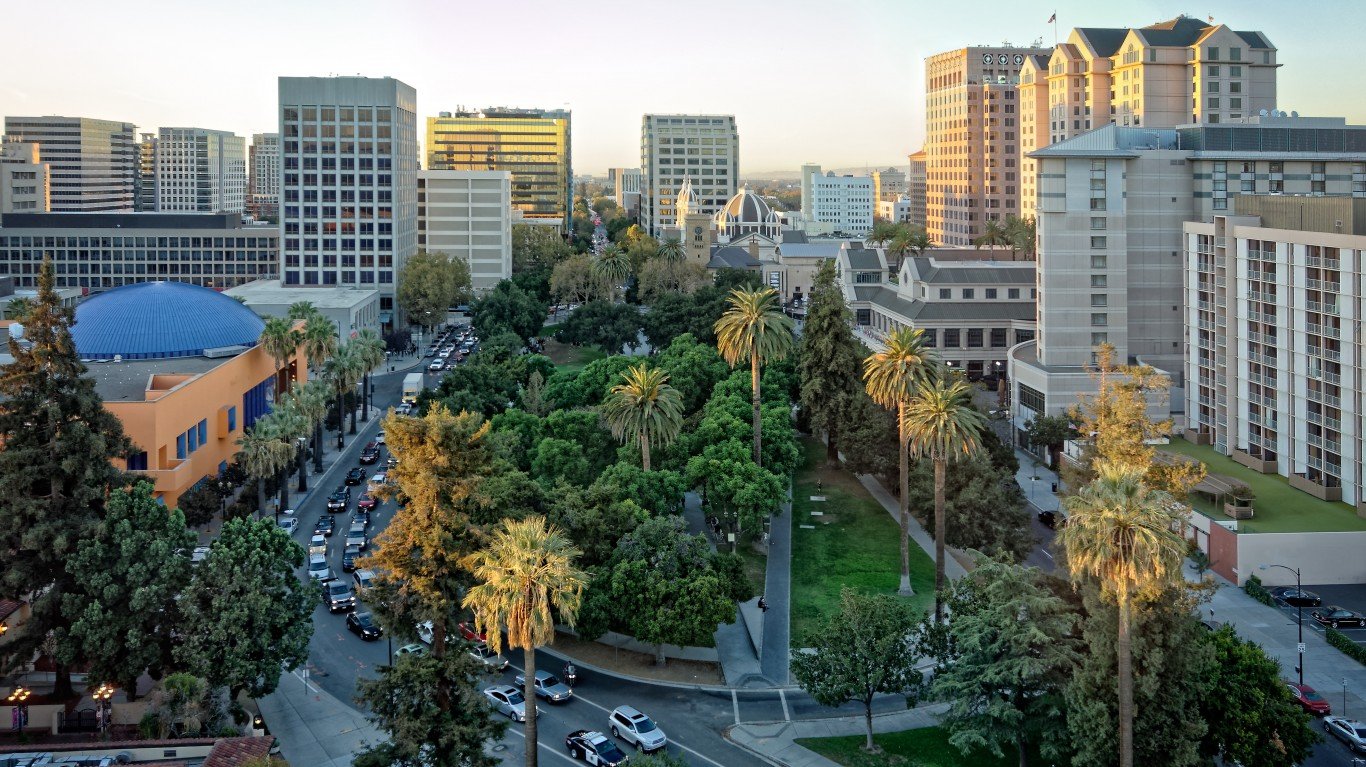
1. San Jose-Sunnyvale-Santa Clara, CA
> Median monthly rental cost: $2,365
> Share of income typically spent on rent: 28.0% — 110th lowest of 384 metros (tied)
> Rental occupied housing units: 43.4% — 29th highest of 384 metros
> Median home value: $1,041,800 — the highest of 384 metros
Methodology
To determine the metros with the highest rent, 24/7 Wall St. reviewed five-year estimates of median gross rent from the U.S. Census Bureau’s 2020 American Community Survey.
We used the 384 metropolitan statistical areas as delineated by the United States Office of Management and Budget and used by the Census Bureau as our definition of metros.
Metros were ranked based on the median gross rent. To break ties, we used the median gross rent as a share of household income.
Additional information on median gross rent as a share of household income, share of households occupied by renters, and median home value are also five-year estimates from the 2020 ACS. Because the Census Bureau didn’t release one-year estimates for 2020 due to data collection issues caused by the COVID-19 pandemic, all ACS data are five-year estimates.
Sponsored: Want to Retire Early? Here’s a Great First Step
Want retirement to come a few years earlier than you’d planned? Or are you ready to retire now, but want an extra set of eyes on your finances?
Now you can speak with up to 3 financial experts in your area for FREE. By simply clicking here you can begin to match with financial professionals who can help you build your plan to retire early. And the best part? The first conversation with them is free.
Click here to match with up to 3 financial pros who would be excited to help you make financial decisions.
Thank you for reading! Have some feedback for us?
Contact the 24/7 Wall St. editorial team.