
In the more than three years since the COVID-19 pandemic hit, the expectations for the American worker — specifically in relation to working in-office — have changed. Millions of Americans now work from home full-time, or have adopted a hybrid schedule, going into the office for part of the week and staying home the rest. A recent Gallup study found that 45% of full-time workers in the United States – and two-thirds of white-collar workers – were doing their job remotely at least some of the time. Even as the pandemic continues to fade into the background, this remnant of social distancing by all accounts appears to be a permanent fixture.
The shift is proving to be a positive development for millions of Americans. Gallup reports that over 90% of remote workers hope that the trend continues, citing the lack of commute time as the chief benefit. (Here is a look at the state where the most people are working from home.)
According to the U.S. Census Bureau, the average commute time in the United States is 26.9 minutes. For those who travel to and from work every Monday through Friday, this translates to about 4.5 hours per week, or nearly 10 days a year.
Of course, commute times vary from person to person, but in some parts of the country, workers who are still commuting tend to have far less travel time than others. Using census data, 24/7 Wall St. identified the county or county equivalent with the shortest commute in every state.
Among the counties on this list, average commute times range from as little as five minutes to no more than 26 minutes. In most counties on this list, the average commuter spends at least two and a half days less time commuting annually than the average commuter across the state as a whole.
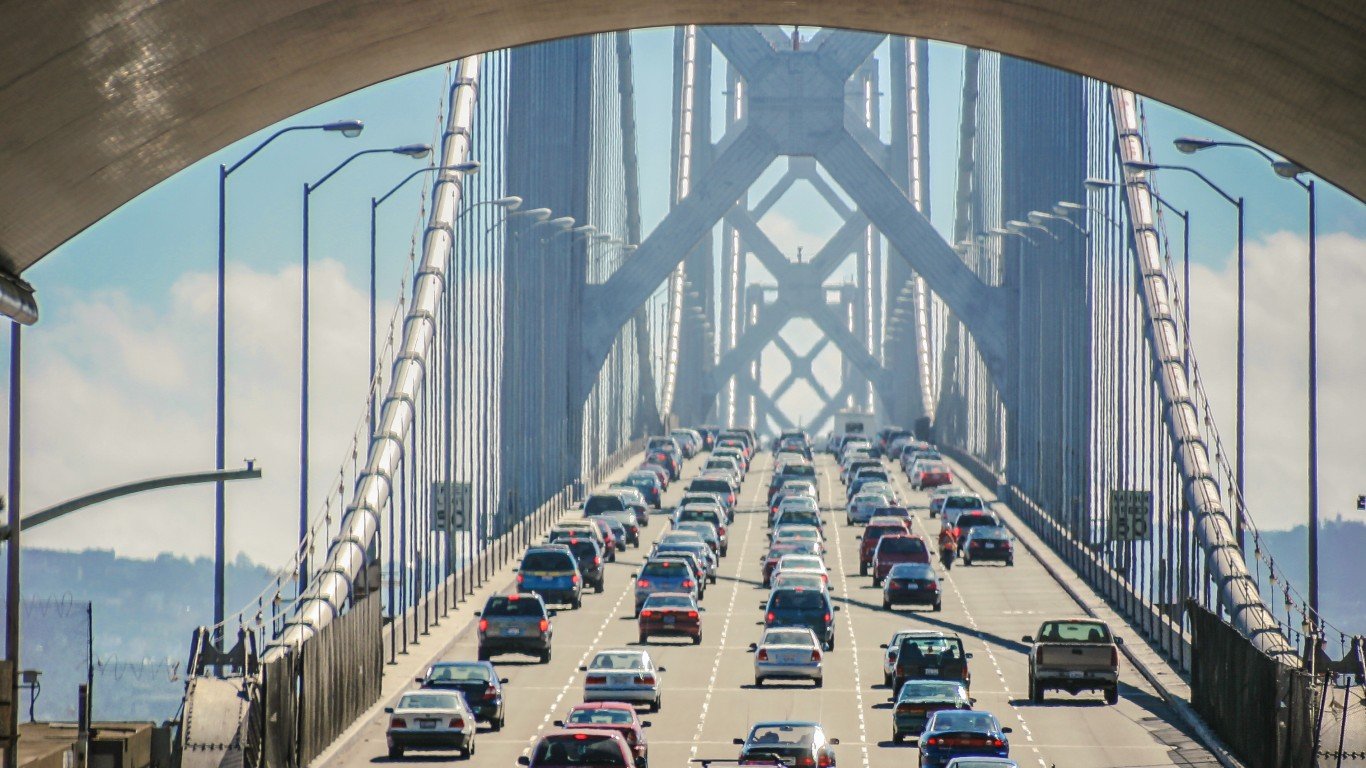
In most counties on this list, the share of commuters using public transit is below the state average. In most cases, public transportation is less direct than simply driving from door to door, adding to overall commute time. Here is a look at the cities where people lose the most time driving each year.
Click here to see the county with the shortest commute in every state
Click here to read our detailed methodology

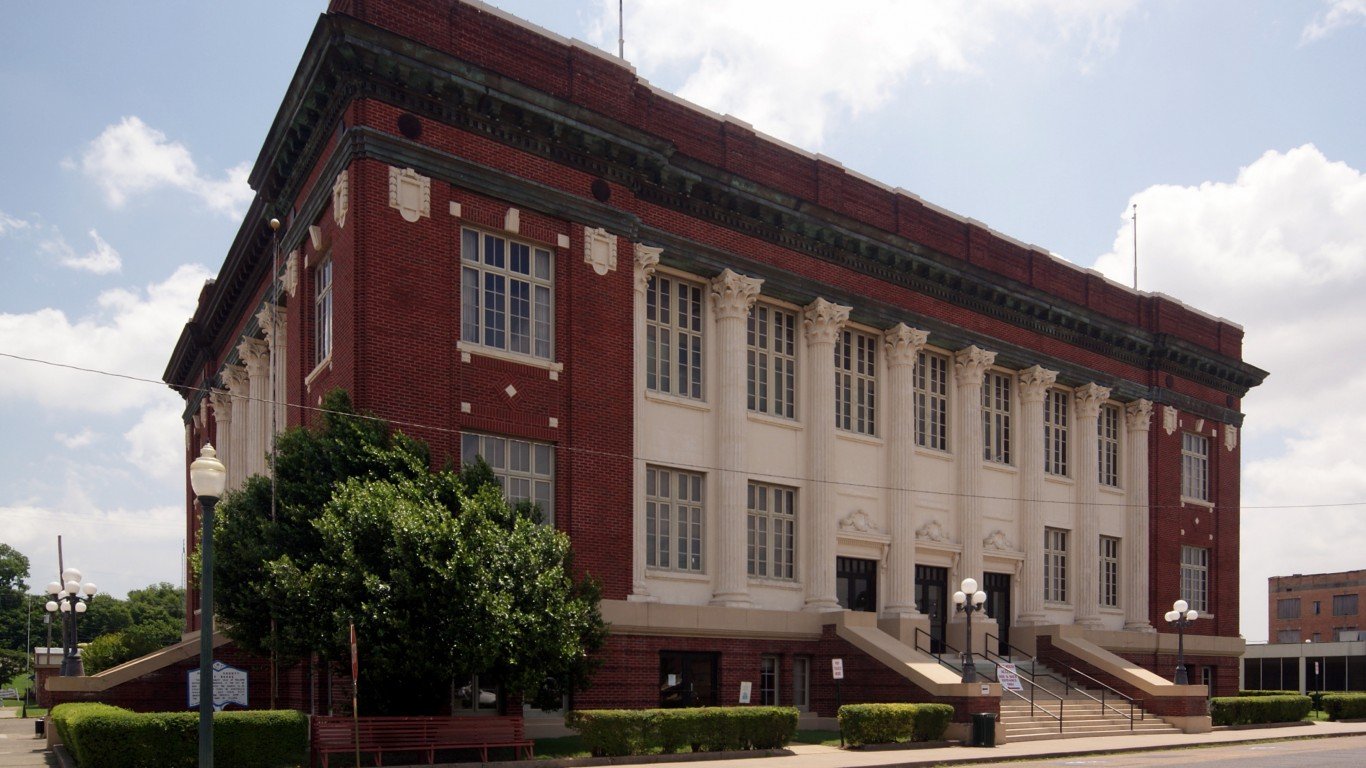
Alabama: Escambia County
> Avg. commute time (minutes): 20.9 (Alabama: 25.2)
> Share of commuters driving alone: 91.3% (Alabama: 84.9%)
> Share of commuters carpooling: 6.9% (Alabama: 8.3%)
> Share of commuters using public transit: 0.3% (Alabama: 0.3%)
> No. of counties considered in ranking: 67
[in-text-ad]

Source: Vipersniper / iStock via Getty Images
Alaska: Aleutians East Borough
> Avg. commute time (minutes): 5.2 (Alaska: 18.9)
> Share of commuters driving alone: 26.4% (Alaska: 68.1%)
> Share of commuters carpooling: 6.5% (Alaska: 12.1%)
> Share of commuters using public transit: 0.1% (Alaska: 1.2%)
> No. of counties considered in ranking: 22
 24/7 Wall St.
Source: MCCAIG / iStock via Getty Images
Arizona: La Paz County
> Avg. commute time (minutes): 14.4 (Arizona: 25.8)
> Share of commuters driving alone: 81.0% (Arizona: 74.5%)
> Share of commuters carpooling: 11.0% (Arizona: 10.7%)
> Share of commuters using public transit: 0.0% (Arizona: 1.6%)
> No. of counties considered in ranking: 15
Source: BOB WESTON / iStock via Getty Images
Arkansas: Phillips County
> Avg. commute time (minutes): 16.2 (Arkansas: 21.8)
> Share of commuters driving alone: 86.5% (Arkansas: 82.3%)
> Share of commuters carpooling: 10.0% (Arkansas: 10.2%)
> Share of commuters using public transit: 0.0% reported (Arkansas: 0.3%)
> No. of counties considered in ranking: 75
[in-text-ad-2]

California: Del Norte County
> Avg. commute time (minutes): 15.6 (California: 29.8)
> Share of commuters driving alone: 74.4% (California: 72.1%)
> Share of commuters carpooling: 14.2% (California: 10.0%)
> Share of commuters using public transit: 0.3% (California: 4.6%)
> No. of counties considered in ranking: 57

Source: BOB WESTON / iStock via Getty Images
Colorado: Baca County
> Avg. commute time (minutes): 12.5 (Colorado: 25.8)
> Share of commuters driving alone: 80.0% (Colorado: 72.9%)
> Share of commuters carpooling: 7.5% (Colorado: 8.6%)
> Share of commuters using public transit: 0.0% reported (Colorado: 2.8%)
> No. of counties considered in ranking: 56
[in-text-ad]

Source: SeanPavonePhoto / iStock via Getty Images
Connecticut: Hartford County
> Avg. commute time (minutes): 23.4 (Connecticut: 26.7)
> Share of commuters driving alone: 78.8% (Connecticut: 76.3%)
> Share of commuters carpooling: 7.7% (Connecticut: 7.8%)
> Share of commuters using public transit: 3.1% (Connecticut: 4.4%)
> No. of counties considered in ranking: 8
 24/7 Wall St.
Source: Robert Kirk / iStock via Getty Images
Delaware: New Castle County
> Avg. commute time (minutes): 26.0 (Delaware: 26.2)
> Share of commuters driving alone: 77.0% (Delaware: 78.8%)
> Share of commuters carpooling: 8.7% (Delaware: 8.6%)
> Share of commuters using public transit: 3.3% (Delaware: 2.2%)
> No. of counties considered in ranking: 3

Source: felixmizioznikov / iStock via Getty Images
Florida: Monroe County
> Avg. commute time (minutes): 18.4 (Florida: 27.9)
> Share of commuters driving alone: 68.0% (Florida: 77.7%)
> Share of commuters carpooling: 7.4% (Florida: 9.2%)
> Share of commuters using public transit: 0.8% (Florida: 1.6%)
> No. of counties considered in ranking: 67
[in-text-ad-2]

Source: SeanPavonePhoto / iStock via Getty Images
Georgia: Chattahoochee County
> Avg. commute time (minutes): 11.1 (Georgia: 28.7)
> Share of commuters driving alone: 53.4% (Georgia: 77.7%)
> Share of commuters carpooling: 11.7% (Georgia: 9.3%)
> Share of commuters using public transit: 0.9% (Georgia: 1.9%)
> No. of counties considered in ranking: 154

Source: Joshua Hicks / iStock via Getty Images
Hawaii: Kauai County
> Avg. commute time (minutes): 21.5 (Hawaii: 27.1)
> Share of commuters driving alone: 77.3% (Hawaii: 67.6%)
> Share of commuters carpooling: 10.4% (Hawaii: 13.4%)
> Share of commuters using public transit: 0.9% (Hawaii: 5.5%)
> No. of counties considered in ranking: 4
[in-text-ad]

Idaho: Lemhi County
> Avg. commute time (minutes): 12.5 (Idaho: 21.2)
> Share of commuters driving alone: 72.9% (Idaho: 77.8%)
> Share of commuters carpooling: 9.9% (Idaho: 9.3%)
> Share of commuters using public transit: 0.0% reported (Idaho: 0.6%)
> No. of counties considered in ranking: 41
 24/7 Wall St.
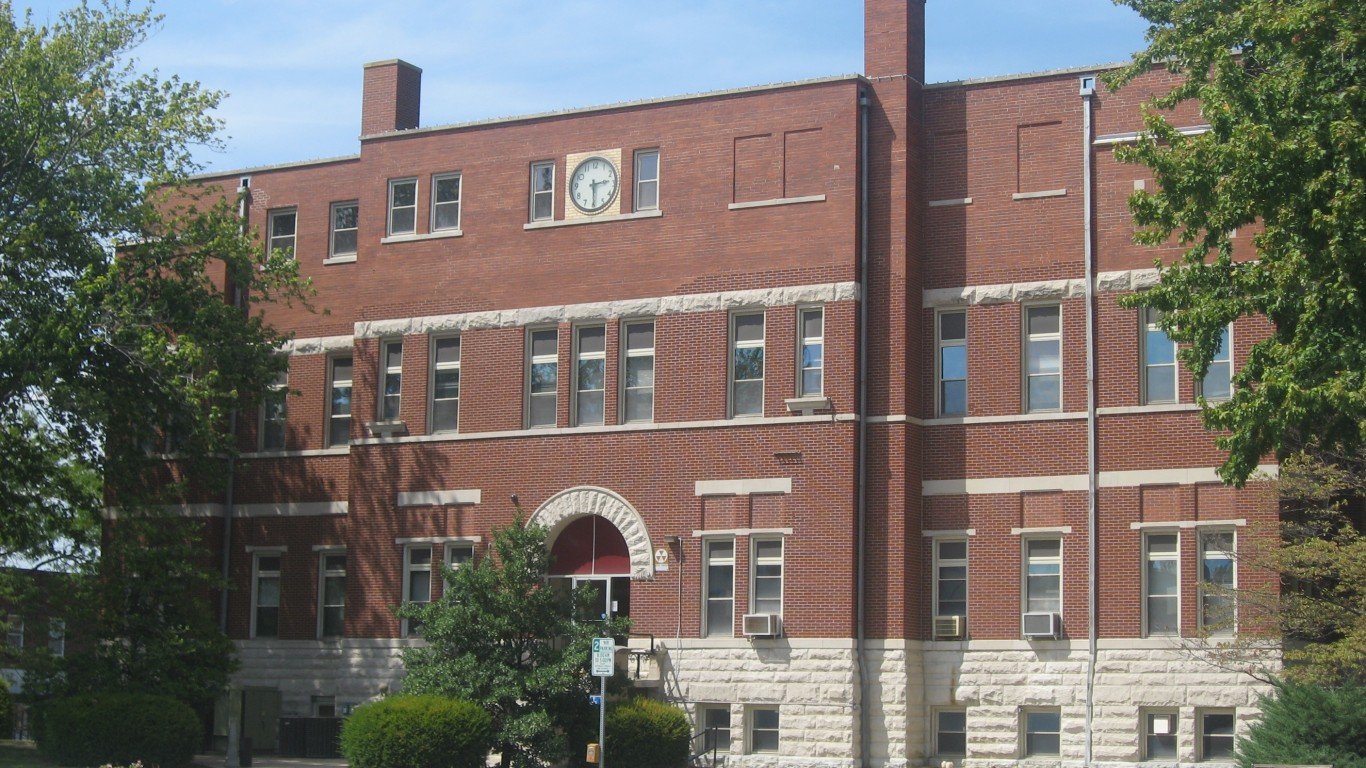
Source: Public Domain / Wikimedia Commons
Illinois: Crawford County
> Avg. commute time (minutes): 16.1 (Illinois: 29.0)
> Share of commuters driving alone: 84.4% (Illinois: 71.5%)
> Share of commuters carpooling: 7.1% (Illinois: 7.8%)
> Share of commuters using public transit: 0.1% (Illinois: 8.8%)
> No. of counties considered in ranking: 102

Source: Geoff Eccles / iStock via Getty Images
Indiana: Tippecanoe County
> Avg. commute time (minutes): 18.2 (Indiana: 23.9)
> Share of commuters driving alone: 76.2% (Indiana: 81.3%)
> Share of commuters carpooling: 8.5% (Indiana: 9.0%)
> Share of commuters using public transit: 2.8% (Indiana: 0.9%)
> No. of counties considered in ranking: 92
[in-text-ad-2]
Source: Jacob Boomsma / iStock via Getty Images
Iowa: Sioux County
> Avg. commute time (minutes): 13.4 (Iowa: 19.5)
> Share of commuters driving alone: 75.3% (Iowa: 80.2%)
> Share of commuters carpooling: 8.3% (Iowa: 8.0%)
> Share of commuters using public transit: 0.3% (Iowa: 0.9%)
> No. of counties considered in ranking: 99

Source: Ammodramus / Public Domain / Wikimedia Commons
Kansas: Graham County
> Avg. commute time (minutes): 11.2 (Kansas: 19.6)
> Share of commuters driving alone: 78.0% (Kansas: 80.7%)
> Share of commuters carpooling: 5.4% (Kansas: 8.9%)
> Share of commuters using public transit: 0.1% (Kansas: 0.4%)
> No. of counties considered in ranking: 95
[in-text-ad]

Kentucky: Calloway County
> Avg. commute time (minutes): 16.8 (Kentucky: 23.7)
> Share of commuters driving alone: 78.6% (Kentucky: 81.2%)
> Share of commuters carpooling: 8.4% (Kentucky: 9.2%)
> Share of commuters using public transit: 0.2% (Kentucky: 0.9%)
> No. of counties considered in ranking: 119
 24/7 Wall St.
Louisiana: East Carroll Parish
> Avg. commute time (minutes): 14.5 (Louisiana: 25.8)
> Share of commuters driving alone: 93.1% (Louisiana: 81.9%)
> Share of commuters carpooling: 4.0% (Louisiana: 9.0%)
> Share of commuters using public transit: 0.0% reported (Louisiana: 1.1%)
> No. of counties considered in ranking: 64
Source: DenisTangneyJr / iStock via Getty Images
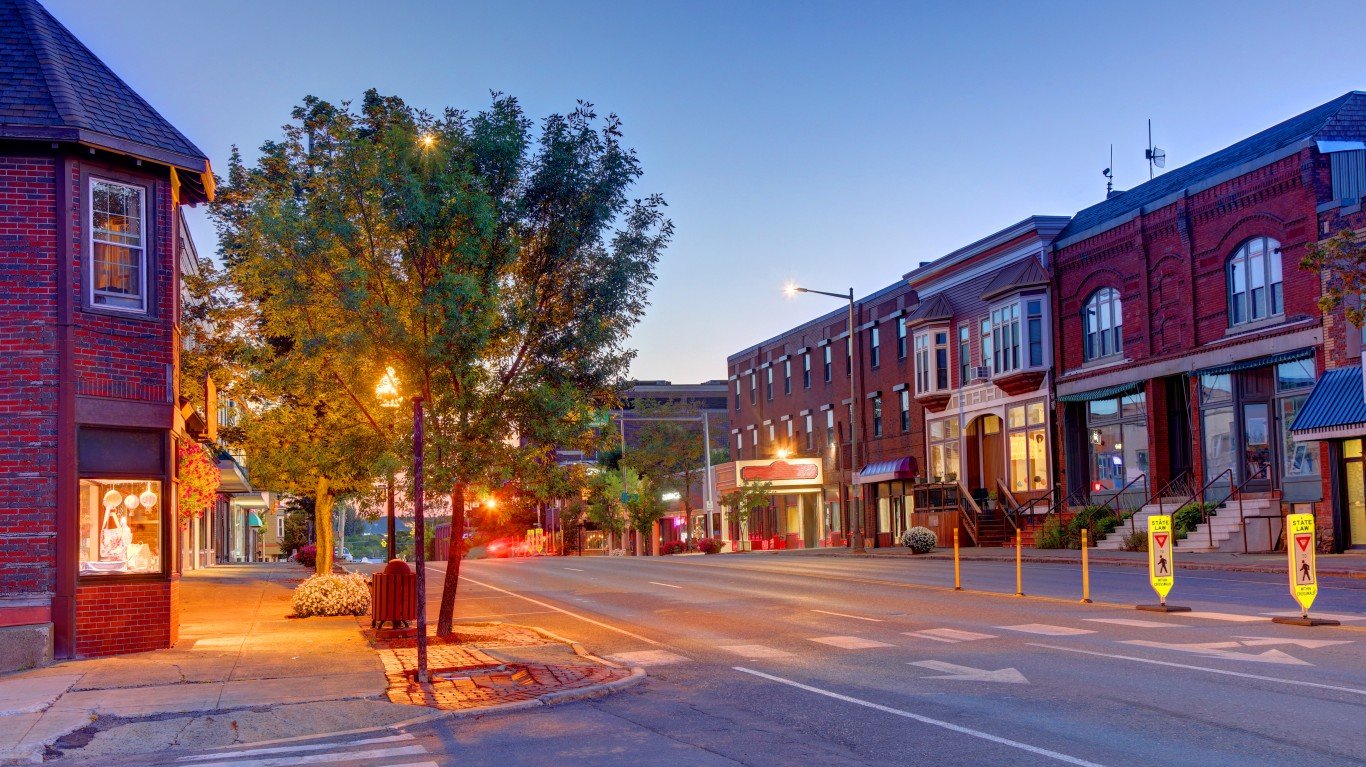
Maine: Aroostook County
> Avg. commute time (minutes): 18.5 (Maine: 24.3)
> Share of commuters driving alone: 81.2% (Maine: 77.2%)
> Share of commuters carpooling: 9.3% (Maine: 9.2%)
> Share of commuters using public transit: 0.1% (Maine: 0.5%)
> No. of counties considered in ranking: 16
[in-text-ad-2]

Source: sgoodwin4813 / iStock via Getty Images
Maryland: Wicomico County
> Avg. commute time (minutes): 22.0 (Maryland: 33.0)
> Share of commuters driving alone: 81.5% (Maryland: 72.1%)
> Share of commuters carpooling: 9.3% (Maryland: 8.6%)
> Share of commuters using public transit: 0.7% (Maryland: 7.4%)
> No. of counties considered in ranking: 24

Source: OlegAlbinsky / E+ via Getty Images
Massachusetts: Nantucket County
> Avg. commute time (minutes): 13.5 (Massachusetts: 30.0)
> Share of commuters driving alone: 70.4% (Massachusetts: 68.0%)
> Share of commuters carpooling: 6.2% (Massachusetts: 7.3%)
> Share of commuters using public transit: 1.2% (Massachusetts: 9.5%)
> No. of counties considered in ranking: 14
[in-text-ad]
 by Charles W. Chapman")
Michigan: Luce County
> Avg. commute time (minutes): 15.5 (Michigan: 24.6)
> Share of commuters driving alone: 77.9% (Michigan: 80.7%)
> Share of commuters carpooling: 12.0% (Michigan: 8.6%)
> Share of commuters using public transit: 0.0% reported (Michigan: 1.3%)
> No. of counties considered in ranking: 82
 24/7 Wall St.
Minnesota: Stevens County
> Avg. commute time (minutes): 11.8 (Minnesota: 23.8)
> Share of commuters driving alone: 74.0% (Minnesota: 76.0%)
> Share of commuters carpooling: 7.8% (Minnesota: 8.1%)
> Share of commuters using public transit: 1.7% (Minnesota: 3.2%)
> No. of counties considered in ranking: 87

Source: BOB WESTON / iStock via Getty Images
Mississippi: Leflore County
> Avg. commute time (minutes): 17.4 (Mississippi: 25.2)
> Share of commuters driving alone: 88.7% (Mississippi: 84.6%)
> Share of commuters carpooling: 6.3% (Mississippi: 9.2%)
> Share of commuters using public transit: 0.8% (Mississippi: 0.3%)
> No. of counties considered in ranking: 81
[in-text-ad-2]
Source: BOB WESTON / iStock via Getty Images
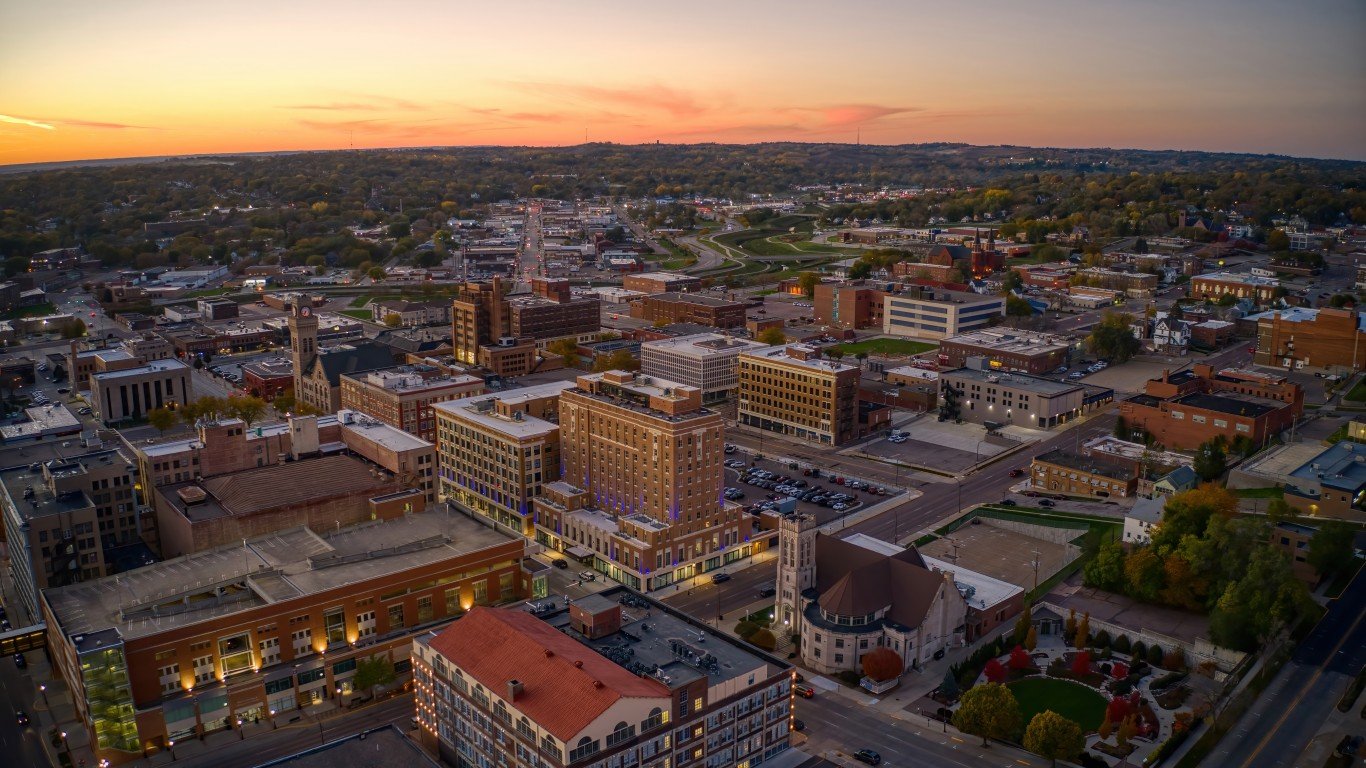
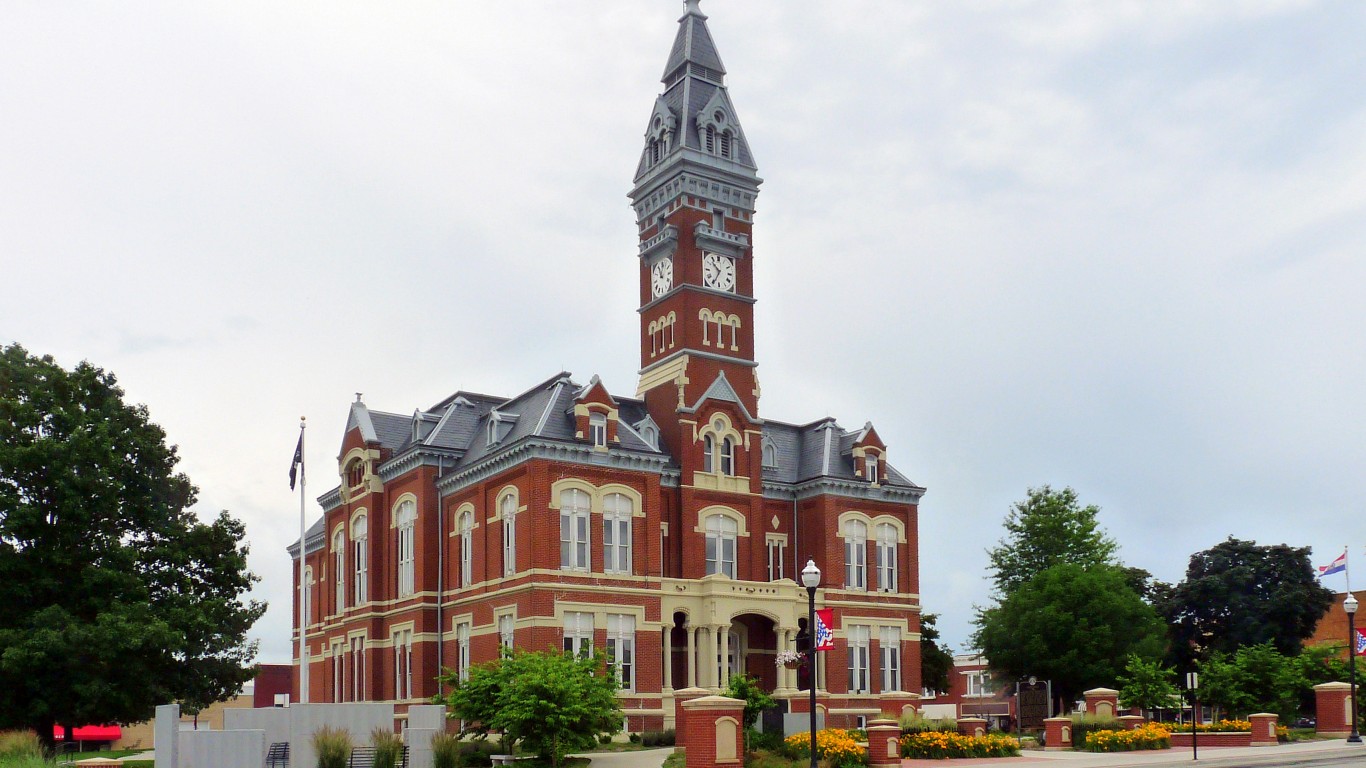
Missouri: Nodaway County
> Avg. commute time (minutes): 15.6 (Missouri: 23.9)
> Share of commuters driving alone: 80.1% (Missouri: 80.8%)
> Share of commuters carpooling: 8.9% (Missouri: 8.4%)
> Share of commuters using public transit: 0.0% (Missouri: 1.2%)
> No. of counties considered in ranking: 114

Montana: Phillips County
> Avg. commute time (minutes): 12.6 (Montana: 18.4)
> Share of commuters driving alone: 60.4% (Montana: 75.2%)
> Share of commuters carpooling: 8.1% (Montana: 9.2%)
> Share of commuters using public transit: 0.6% (Montana: 0.7%)
> No. of counties considered in ranking: 42
[in-text-ad]
Source: BOB WESTON / iStock via Getty Images
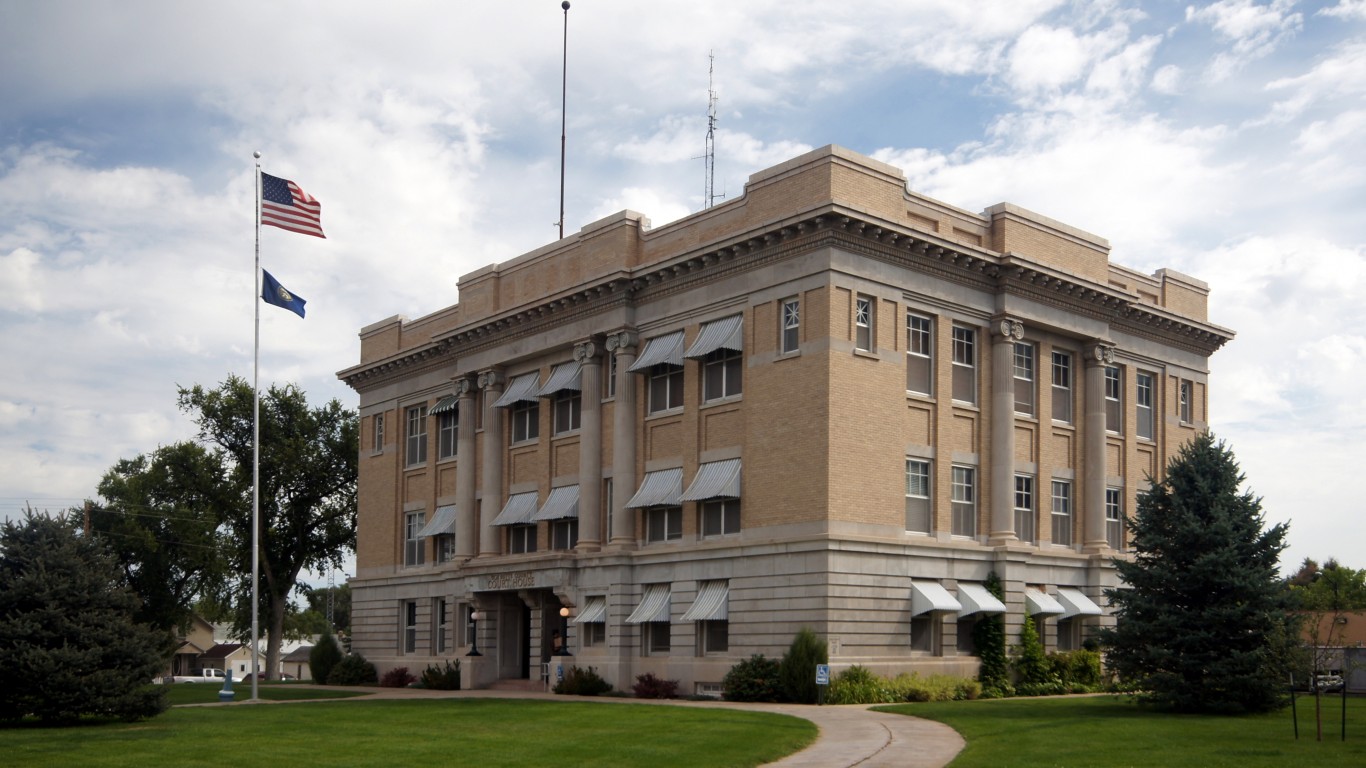
Nebraska: Box Butte County
> Avg. commute time (minutes): 9.9 (Nebraska: 18.9)
> Share of commuters driving alone: 78.8% (Nebraska: 80.7%)
> Share of commuters carpooling: 13.6% (Nebraska: 9.0%)
> Share of commuters using public transit: 0.2% (Nebraska: 0.6%)
> No. of counties considered in ranking: 73
 near 6th Street in Hawthorne, Nevada by Famartin")
Nevada: Mineral County
> Avg. commute time (minutes): 14.1 (Nevada: 24.6)
> Share of commuters driving alone: 77.8% (Nevada: 76.8%)
> Share of commuters carpooling: 9.5% (Nevada: 10.6%)
> Share of commuters using public transit: 0.0% reported (Nevada: 2.9%)
> No. of counties considered in ranking: 15
Source: BOB WESTON / iStock via Getty Images
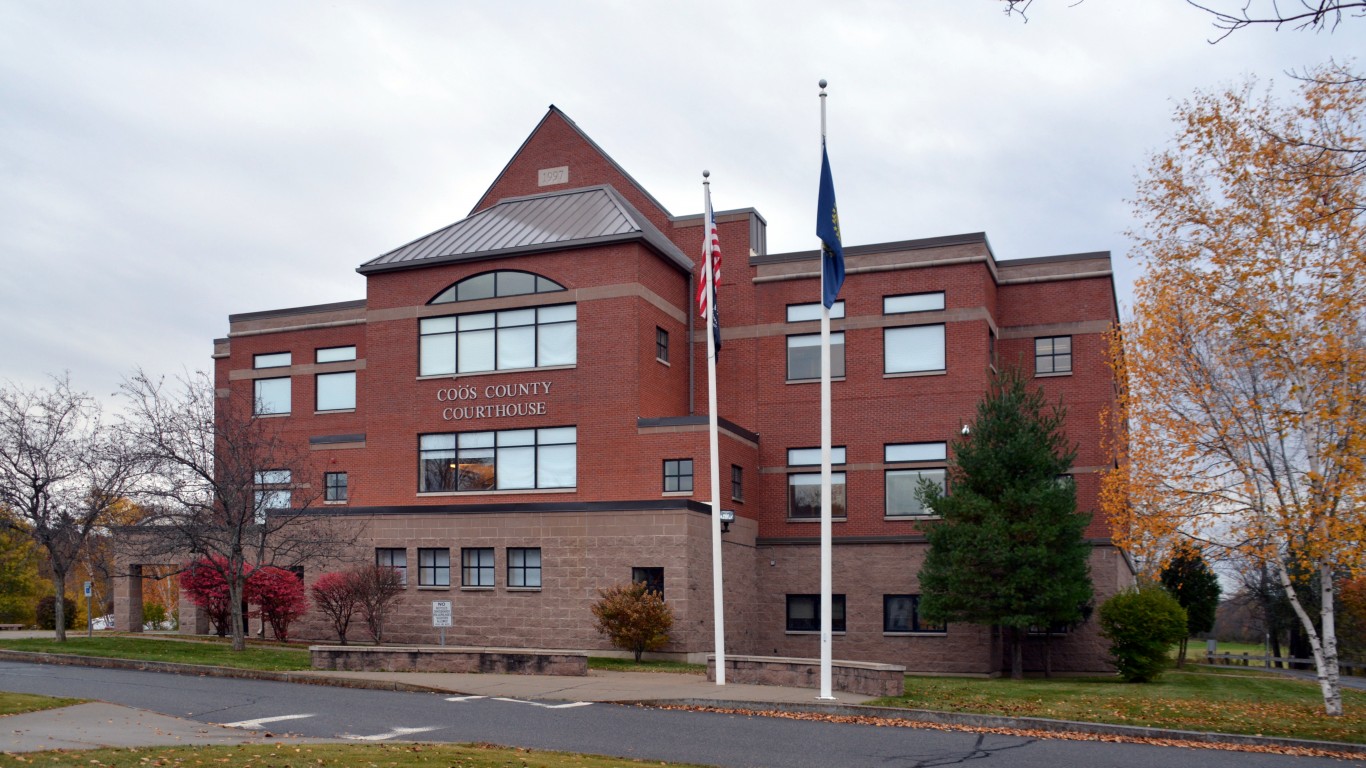
New Hampshire: Coos County
> Avg. commute time (minutes): 22.1 (New Hampshire: 27.4)
> Share of commuters driving alone: 77.2% (New Hampshire: 79.5%)
> Share of commuters carpooling: 9.9% (New Hampshire: 7.7%)
> Share of commuters using public transit: 0.3% (New Hampshire: 0.8%)
> No. of counties considered in ranking: 10
[in-text-ad-2]

Source: Kirkikis / iStock Editorial via Getty Images
New Jersey: Cape May County
> Avg. commute time (minutes): 22.3 (New Jersey: 32.0)
> Share of commuters driving alone: 79.3% (New Jersey: 69.6%)
> Share of commuters carpooling: 7.8% (New Jersey: 7.8%)
> Share of commuters using public transit: 1.4% (New Jersey: 10.8%)
> No. of counties considered in ranking: 21

Source: SWInsider / iStock via Getty Images
New Mexico: Sierra County
> Avg. commute time (minutes): 15.5 (New Mexico: 22.7)
> Share of commuters driving alone: 76.0% (New Mexico: 79.1%)
> Share of commuters carpooling: 5.6% (New Mexico: 10.0%)
> Share of commuters using public transit: 0.5% (New Mexico: 1.0%)
> No. of counties considered in ranking: 30
[in-text-ad]

Source: aceshot / iStock via Getty Images
New York: Chautauqua County
> Avg. commute time (minutes): 18.5 (New York: 33.5)
> Share of commuters driving alone: 79.6% (New York: 52.3%)
> Share of commuters carpooling: 9.2% (New York: 6.4%)
> Share of commuters using public transit: 0.2% (New York: 26.2%)
> No. of counties considered in ranking: 62

Source: BOB WESTON / iStock via Getty Images
North Carolina: Swain County
> Avg. commute time (minutes): 19.0 (North Carolina: 24.9)
> Share of commuters driving alone: 85.2% (North Carolina: 79.3%)
> Share of commuters carpooling: 5.6% (North Carolina: 9.0%)
> Share of commuters using public transit: 0.6% (North Carolina: 1.0%)
> No. of counties considered in ranking: 100

North Dakota: McIntosh County
> Avg. commute time (minutes): 11.0 (North Dakota: 17.6)
> Share of commuters driving alone: 75.8% (North Dakota: 80.8%)
> Share of commuters carpooling: 4.3% (North Dakota: 8.9%)
> Share of commuters using public transit: 0.0% reported (North Dakota: 0.5%)
> No. of counties considered in ranking: 41
[in-text-ad-2]

Source: iip-photo-archive / Flickr
Ohio: Hancock County
> Avg. commute time (minutes): 17.3 (Ohio: 23.7)
> Share of commuters driving alone: 83.4% (Ohio: 81.5%)
> Share of commuters carpooling: 8.7% (Ohio: 7.6%)
> Share of commuters using public transit: 0.4% (Ohio: 1.4%)
> No. of counties considered in ranking: 88

Oklahoma: Texas County
> Avg. commute time (minutes): 13.4 (Oklahoma: 22.0)
> Share of commuters driving alone: 77.6% (Oklahoma: 81.6%)
> Share of commuters carpooling: 14.7% (Oklahoma: 9.7%)
> Share of commuters using public transit: 0.2% (Oklahoma: 0.4%)
> No. of counties considered in ranking: 76
[in-text-ad]

Source: Bobbushphoto / iStock via Getty Images
Oregon: Lake County
> Avg. commute time (minutes): 13.1 (Oregon: 23.9)
> Share of commuters driving alone: 68.7% (Oregon: 70.5%)
> Share of commuters carpooling: 5.7% (Oregon: 9.4%)
> Share of commuters using public transit: 0.1% (Oregon: 4.0%)
> No. of counties considered in ranking: 33

Source: paulsta / iStock via Getty Images
Pennsylvania: Elk County
> Avg. commute time (minutes): 17.4 (Pennsylvania: 27.1)
> Share of commuters driving alone: 83.5% (Pennsylvania: 74.4%)
> Share of commuters carpooling: 10.0% (Pennsylvania: 8.2%)
> Share of commuters using public transit: 0.3% (Pennsylvania: 5.2%)
> No. of counties considered in ranking: 67
Source: Image Source / Image Source via Getty Images
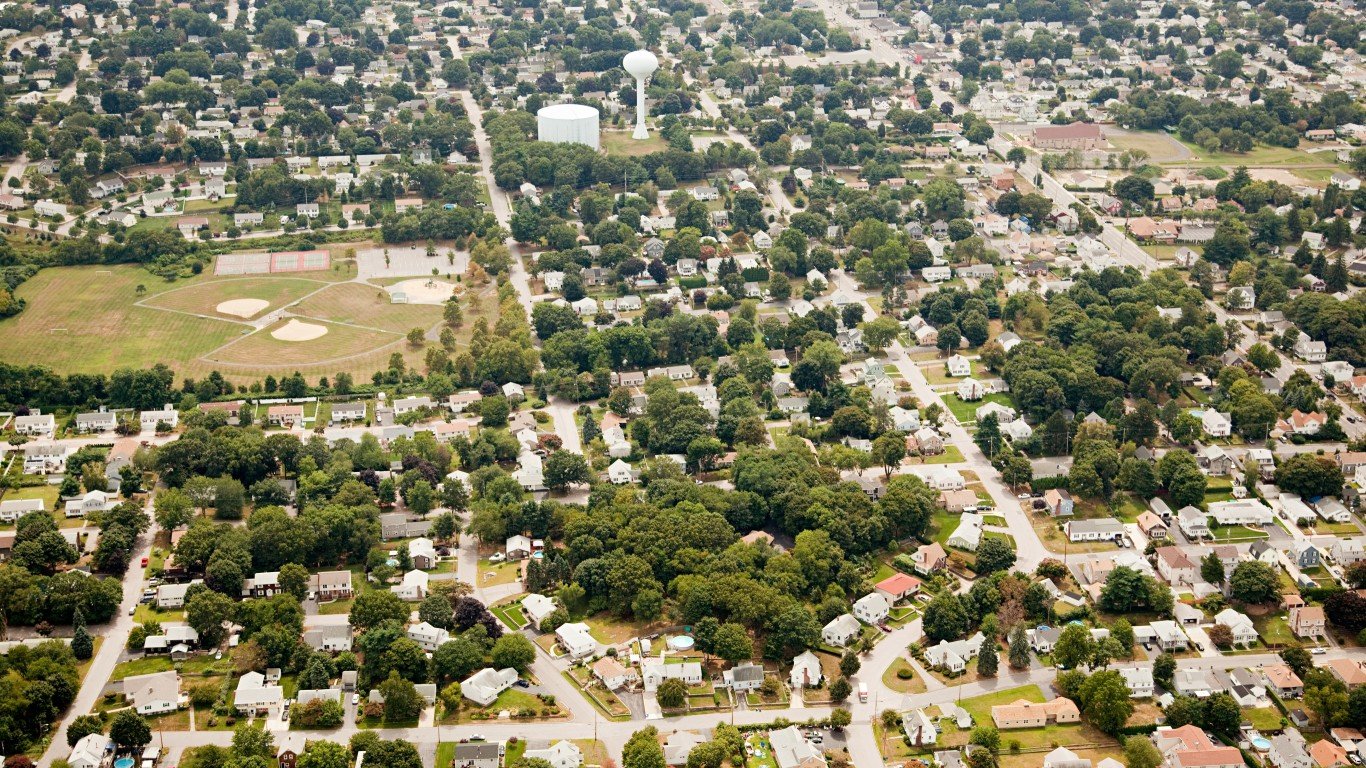
Rhode Island: Newport County
> Avg. commute time (minutes): 22.7 (Rhode Island: 25.3)
> Share of commuters driving alone: 77.3% (Rhode Island: 79.7%)
> Share of commuters carpooling: 5.6% (Rhode Island: 8.1%)
> Share of commuters using public transit: 1.4% (Rhode Island: 2.2%)
> No. of counties considered in ranking: 5
[in-text-ad-2]

South Carolina: Greenwood County
> Avg. commute time (minutes): 20.6 (South Carolina: 25.1)
> Share of commuters driving alone: 85.4% (South Carolina: 81.5%)
> Share of commuters carpooling: 10.5% (South Carolina: 8.9%)
> Share of commuters using public transit: 0.5% (South Carolina: 0.5%)
> No. of counties considered in ranking: 46

Source: ChrisBoswell / Getty Images
South Dakota: Hughes County
> Avg. commute time (minutes): 12.0 (South Dakota: 17.3)
> Share of commuters driving alone: 78.4% (South Dakota: 80.0%)
> Share of commuters carpooling: 13.1% (South Dakota: 8.1%)
> Share of commuters using public transit: 1.0% (South Dakota: 0.5%)
> No. of counties considered in ranking: 51
[in-text-ad]

Tennessee: Madison County
> Avg. commute time (minutes): 18.5 (Tennessee: 25.4)
> Share of commuters driving alone: 80.6% (Tennessee: 81.9%)
> Share of commuters carpooling: 9.6% (Tennessee: 8.8%)
> Share of commuters using public transit: 0.5% (Tennessee: 0.6%)
> No. of counties considered in ranking: 95
Source: BOB WESTON / iStock via Getty Images
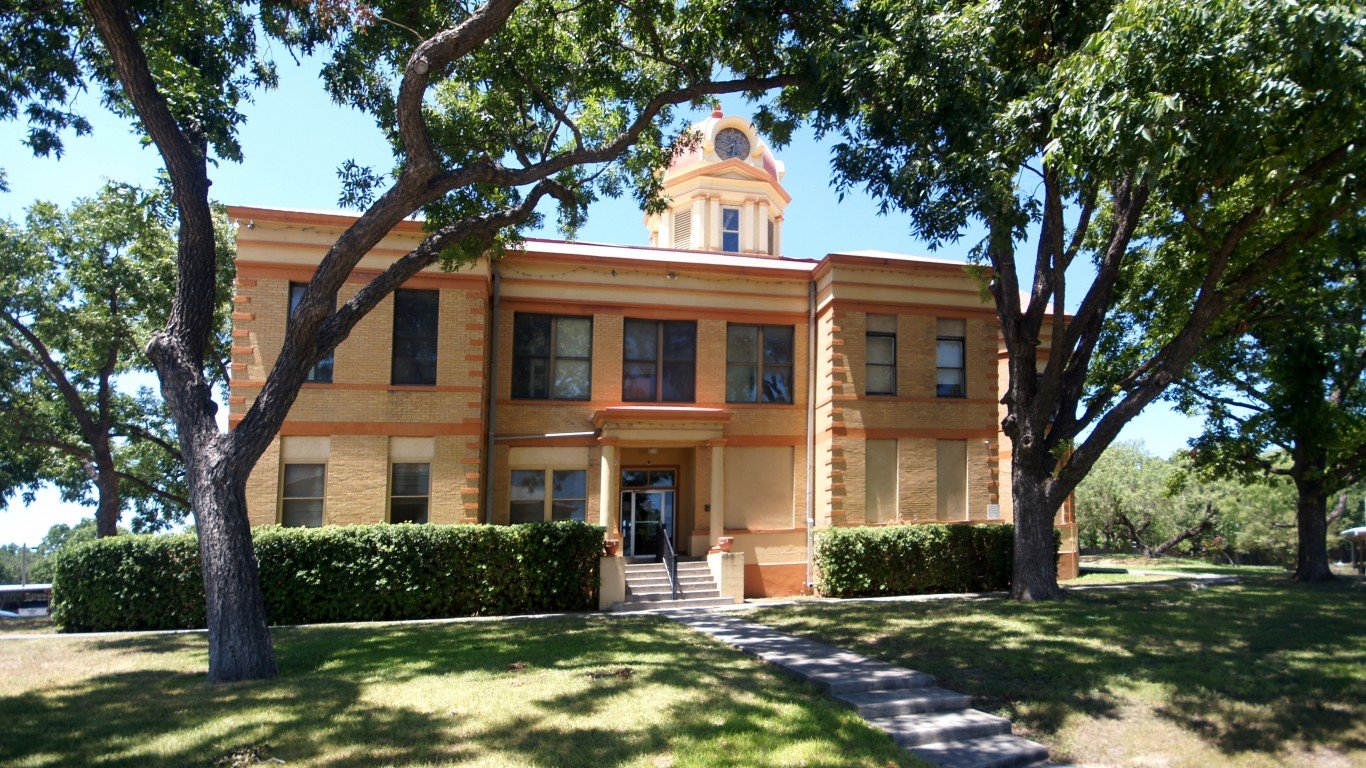
Texas: Kinney County
> Avg. commute time (minutes): 8.4 (Texas: 26.6)
> Share of commuters driving alone: 78.3% (Texas: 78.7%)
> Share of commuters carpooling: 3.6% (Texas: 9.9%)
> Share of commuters using public transit: 0.2% (Texas: 1.3%)
> No. of counties considered in ranking: 225

Source: Different_Brian / iStock via Getty Images
Utah: Kane County
> Avg. commute time (minutes): 11.2 (Utah: 22.0)
> Share of commuters driving alone: 72.4% (Utah: 74.4%)
> Share of commuters carpooling: 10.4% (Utah: 10.4%)
> Share of commuters using public transit: 0.2% (Utah: 2.2%)
> No. of counties considered in ranking: 25
[in-text-ad-2]

Source: EPasqualli / iStock via Getty Images
Vermont: Bennington County
> Avg. commute time (minutes): 20.4 (Vermont: 23.3)
> Share of commuters driving alone: 74.9% (Vermont: 74.4%)
> Share of commuters carpooling: 6.3% (Vermont: 8.5%)
> Share of commuters using public transit: 0.4% (Vermont: 1.2%)
> No. of counties considered in ranking: 14

Virginia: Norton city
> Avg. commute time (minutes): 11.8 (Virginia: 28.6)
> Share of commuters driving alone: 79.4% (Virginia: 74.9%)
> Share of commuters carpooling: 9.6% (Virginia: 8.9%)
> Share of commuters using public transit: 6.9% (Virginia: 4.0%)
> No. of counties considered in ranking: 132
[in-text-ad]
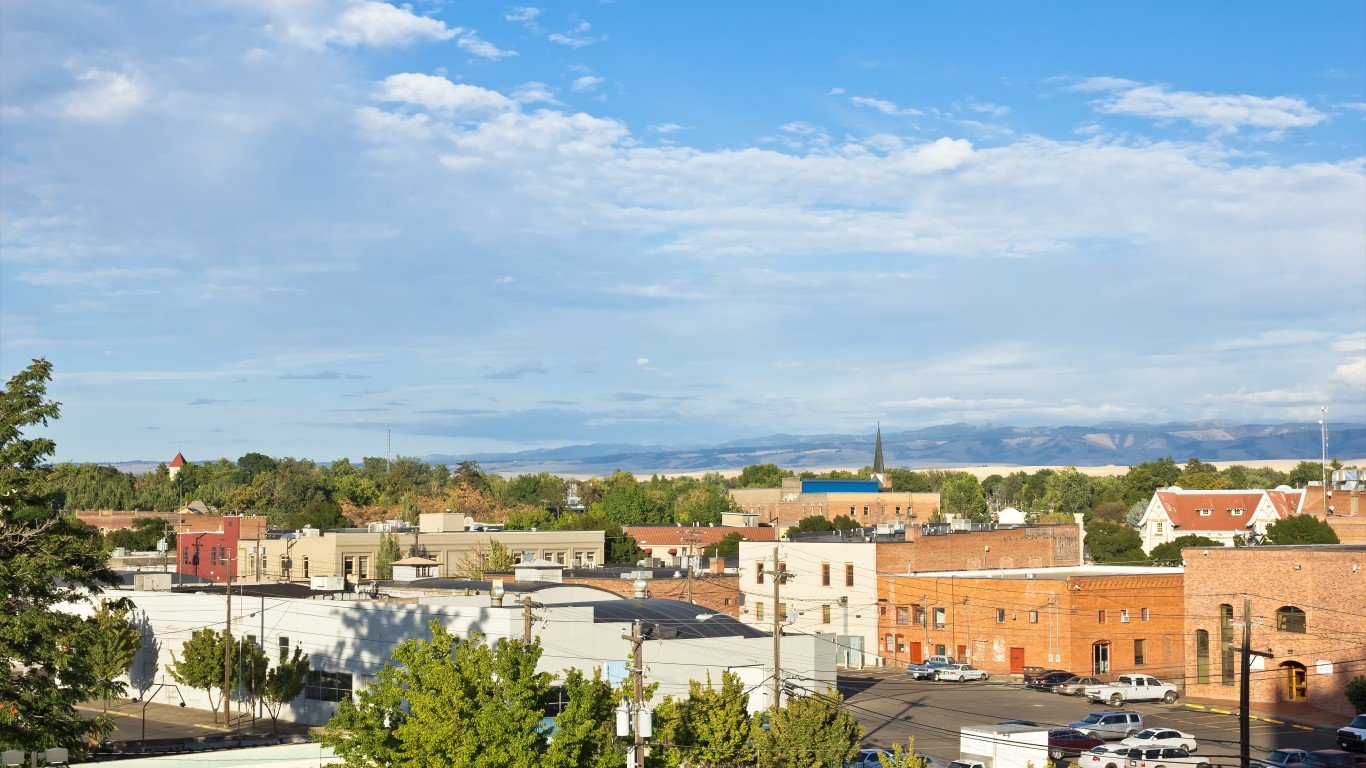
Source: JohnnyH5 / iStock via Getty Images
Washington: Walla Walla County
> Avg. commute time (minutes): 15.8 (Washington: 28.0)
> Share of commuters driving alone: 71.8% (Washington: 69.7%)
> Share of commuters carpooling: 9.8% (Washington: 9.7%)
> Share of commuters using public transit: 1.0% (Washington: 6.0%)
> No. of counties considered in ranking: 38

West Virginia: Wood County
> Avg. commute time (minutes): 19.5 (West Virginia: 26.1)
> Share of commuters driving alone: 82.8% (West Virginia: 82.0%)
> Share of commuters carpooling: 9.6% (West Virginia: 8.6%)
> Share of commuters using public transit: 0.8% (West Virginia: 0.8%)
> No. of counties considered in ranking: 55

Source: JamesBrey / E+ via Getty Images
Wisconsin: Door County
> Avg. commute time (minutes): 17.0 (Wisconsin: 22.2)
> Share of commuters driving alone: 80.8% (Wisconsin: 79.9%)
> Share of commuters carpooling: 7.8% (Wisconsin: 7.7%)
> Share of commuters using public transit: 0.2% (Wisconsin: 1.5%)
> No. of counties considered in ranking: 72
[in-text-ad-2]

Wyoming: Washakie County
> Avg. commute time (minutes): 12.7 (Wyoming: 17.9)
> Share of commuters driving alone: 83.8% (Wyoming: 77.4%)
> Share of commuters carpooling: 4.6% (Wyoming: 10.0%)
> Share of commuters using public transit: 0.0% reported (Wyoming: 1.0%)
> No. of counties considered in ranking: 22
Methodology
To determine the county or county equivalent with the shortest commute in each state, 24/7 Wall St. reviewed five-year estimates of average commute times from the U.S. Census Bureau’s 2020 American Community Survey.
Counties were excluded if average commute time estimates were not available in the 2020 ACS, if there were fewer than 1,000 workers 16 years and over who did not work from home, or if the sampling error associated with a county’s data was deemed too high.
The sampling error was defined as too high if the coefficient of variation — a statistical assessment of how reliable an estimate is — for a county’s average commute time was above 15% and greater than two standard deviations above the mean CV for all counties’ average commute times. We similarly excluded counties that had a sampling error too high for their population, using the same definition.
Counties and county equivalents were ranked based on their average commute time. To break ties, we used the share of workers with a commute of 15 minutes or less.
Additional information on the share of commuters driving alone, carpooling, and using public transit are also five-year estimates from the 2020 ACS. Because the Census Bureau didn’t release one-year estimates for 2020 due to data collection issues caused by the COVID-19 pandemic, all ACS data are five-year estimates.
Take This Retirement Quiz To Get Matched With An Advisor Now (Sponsored)
Are you ready for retirement? Planning for retirement can be overwhelming, that’s why it could be a good idea to speak to a fiduciary financial advisor about your goals today.
Start by taking this retirement quiz right here from SmartAsset that will match you with up to 3 financial advisors that serve your area and beyond in 5 minutes. Smart Asset is now matching over 50,000 people a month.
Click here now to get started.
Thank you for reading! Have some feedback for us?
Contact the 24/7 Wall St. editorial team.
Editors' Picks