
Rising inflation, a changing labor market, an ongoing pandemic, tax hikes, and climate change are but some of the significant challenges Americans face. Some cities nationwide are better able to address these issues, while others are behind. And Americans are abandoning cities that do not meet their needs.
The U.S. Census Bureau determined that in 2021, over 27 million Americans moved to a different residence. While the 2021 U.S. moving rate of 8.4% is lower than in recent years, Americans are still on the move. In a survey of 1,000 Americans who changed residence in 2021, Move.org found that many were seeking lower cost of living, lower taxes, and better weather. People who moved also factored climate change into their decision.
To identify the 25 cities Americans are abandoning, 24/7 Wall St. used population data from the Census Bureau’s Population and Housing Unit Estimates Program. We ranked metropolitan areas based on the percentage change in population due to net migration between July 1, 2020 and July 1, 2021. Net migration refers to the difference between the number of people moving into an area and the number of people moving out of the area during a specific time period.
California leads the list of out-migration with seven of the 25 cities on the list. Four of the cities that U.S. residents are abandoning are in Texas, and three are in Illinois. Notably, all listed cities in Texas and Illinois have unemployment rates that are higher than the national average. Decatur, Illinois, at No. 13, has the highest unemployment rate of cities on the list, at 6.7%.
In some cities, high home prices outweigh the enticement of low unemployment. For example, despite having lower unemployment rates than the national average of 3.6%, both San Jose, California, and San Francisco are among the top five cities that Americans are abandoning, losing about 2.5% of their population in the 12-month period. Both cities lead the median home value within the list, coming in at $1,041,800 and $888,500, respectively. (These are cities with skyrocketing home prices this summer)
Climate change may also be a factor into domestic migration decisions. While some may seek to move to places with warmer weather and affordable living, several such communities must also contend with natural disasters. Napa, California, at No. 15, has experienced increasing wildfire threats for a number of years. Lake Charles, Louisiana, the No. 1 city that Americans are abandoning, was hit hard by hurricanes, suffering two major storms within a six-week span in 2020. (This is the American city where hurricanes would cause the most damage.)
Click here to see the cities Americans are abandoning
Click here to read our detailed methodology

Source: DenisTangneyJr / iStock Unreleased via Getty Images
25. San Angelo, TX
Population change due to migration, 2020-2021: -0.7% (-890)
Total population change, 2020-2021: -0.5% (-666)
Unemployment rate, April 2022: 3.7%
Median home value: $148,600
Total population: 122,344
[in-text-ad]

Source: JulieHewitt / Getty Images
24. Santa Maria-Santa Barbara, CA
Population change due to migration, 2020-2021: -0.7% (-3,327)
Total population change, 2020-2021: -0.4% (-1,621)
Unemployment rate, April 2022: 3.4%
Median home value: $610,300
Total population: 446,475

23. Danville, IL
Population change due to migration, 2020-2021: -0.8% (-559)
Total population change, 2020-2021: -1.1% (-788)
Unemployment rate, April 2022: 5.6%
Median home value: $80,900
Total population: 73,095

Source: Sean Pavone / iStock via Getty Images
22. Boston-Cambridge-Newton, MA-NH
Population change due to migration, 2020-2021: -0.8% (-37,535)
Total population change, 2020-2021: -0.7% (-36,579)
Unemployment rate, April 2022: 3.6%
Median home value: $461,500
Total population: 4,899,932
[in-text-ad-2]

Source: DenisTangneyJr / iStock via Getty Images
21. Laredo, TX
Population change due to migration, 2020-2021: -0.8% (-2,086)
Total population change, 2020-2021: +0.3% (+711)
Unemployment rate, April 2022: 4.8%
Median home value: $135,000
Total population: 267,945

Source: Sean Pavone / iStock via Getty Images
20. Shreveport-Bossier City, LA
Population change due to migration, 2020-2021: -0.8% (-3,180)
Total population change, 2020-2021: -0.9% (-3,370)
Unemployment rate, April 2022: 4.0%
Median home value: $156,900
Total population: 389,155
[in-text-ad]

Source: DenisTangneyJr / E+ via Getty Images
19. Casper, WY
Population change due to migration, 2020-2021: -0.8% (-650)
Total population change, 2020-2021: -0.8% (-674)
Unemployment rate, April 2022: 4.4%
Median home value: $215,400
Total population: 79,555

Source: Solidago / iStock Unreleased via Getty Images
18. Salinas, CA
Population change due to migration, 2020-2021: -0.8% (-3,683)
Total population change, 2020-2021: -0.3% (-1,175)
Unemployment rate, April 2022: 5.8%
Median home value: $559,400
Total population: 437,325

Source: Matt Anderson / iStock via Getty Images
17. Washington-Arlington-Alexandria, DC-VA-MD-WV
Population change due to migration, 2020-2021: -0.8% (-54,211)
Total population change, 2020-2021: -0.5% (-29,280)
Unemployment rate, April 2022: 3.6%
Median home value: $436,600
Total population: 6,356,434
[in-text-ad-2]

Source: DenisTangneyJr / iStock via Getty Images
16. Grand Forks, ND-MN
Population change due to migration, 2020-2021: -0.9% (-894)
Total population change, 2020-2021: -0.6% (-651)
Unemployment rate, April 2022: 2.3%
Median home value: $195,500
Total population: 103,462

Source: MasaoTaira / iStock via Getty Images
15. Napa, CA
Population change due to migration, 2020-2021: -0.9% (-1,222)
Total population change, 2020-2021: -1.0% (-1,401)
Unemployment rate, April 2022: 3.4%
Median home value: $666,900
Total population: 136,207
[in-text-ad]

Source: DenisTangneyJr / iStock via Getty Images
14. Manhattan, KS
Population change due to migration, 2020-2021: -0.9% (-1,243)
Total population change, 2020-2021: -0.2% (-203)
Unemployment rate, April 2022: 2.2%
Median home value: $180,500
Total population: 133,932

Source: JHVEPhoto / iStock Editorial via Getty Images
13. Decatur, IL
Population change due to migration, 2020-2021: -0.9% (-976)
Total population change, 2020-2021: -1.2% (-1,215)
Unemployment rate, April 2022: 6.7%
Median home value: $103,100
Total population: 102,432
Source: greta6 / iStock Editorial via Getty Images
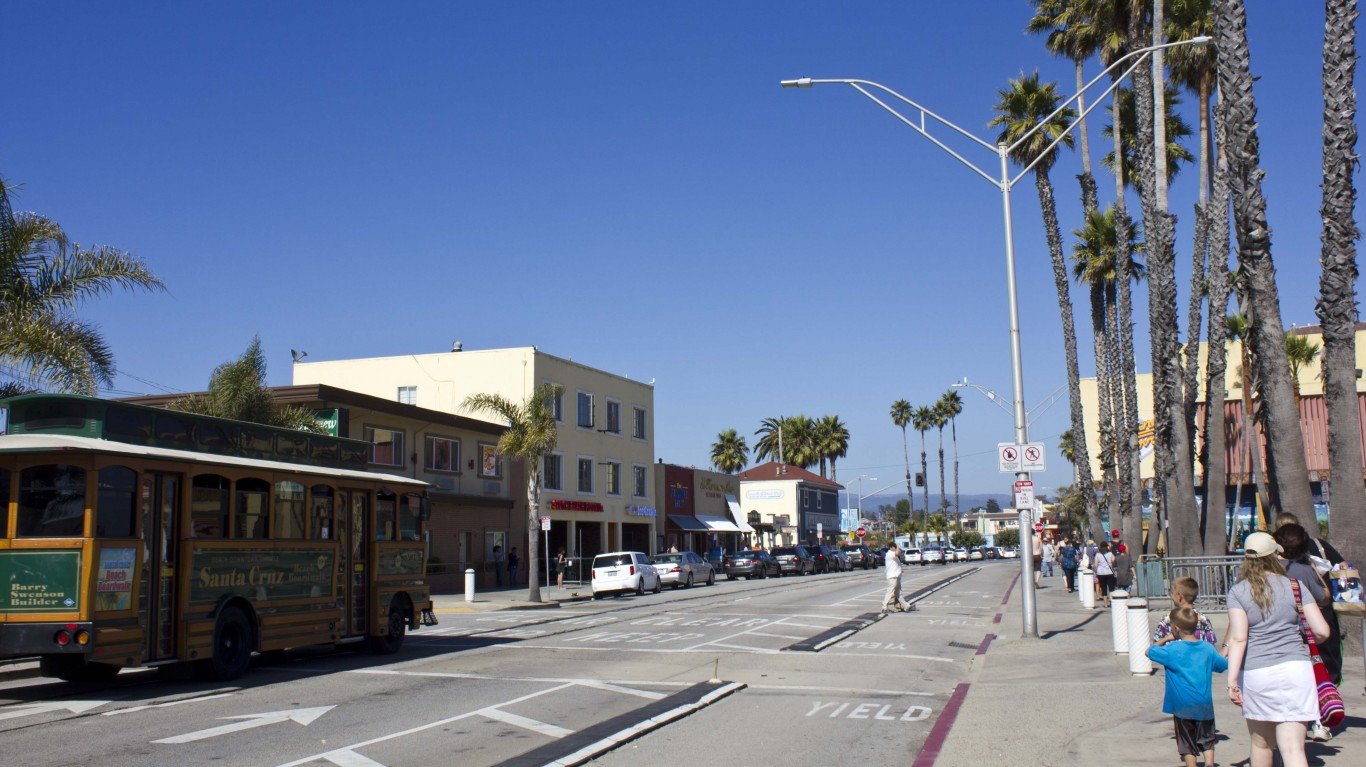
12. Santa Cruz-Watsonville, CA
Population change due to migration, 2020-2021: -1.0% (-2,602)
Total population change, 2020-2021: -0.9% (-2,561)
Unemployment rate, April 2022: 4.4%
Median home value: $787,000
Total population: 267,792
[in-text-ad-2]

Source: JaySi / iStock via Getty Images
11. Chicago-Naperville-Elgin, IL-IN-WI
Population change due to migration, 2020-2021: -1.1% (-102,613)
Total population change, 2020-2021: -1.0% (-91,671)
Unemployment rate, April 2022: 4.4%
Median home value: $247,400
Total population: 9,509,934

Source: BOB WESTON / iStock via Getty Images
10. Enid, OK
Population change due to migration, 2020-2021: -1.1% (-691)
Total population change, 2020-2021: -1.1% (-703)
Unemployment rate, April 2022: 2.6%
Median home value: $119,000
Total population: 61,926
[in-text-ad]

Source: Cheri Alguire / iStock Editorial via Getty Images
9. Grand Island, NE
Population change due to migration, 2020-2021: -1.1% (-854)
Total population change, 2020-2021: -0.9% (-710)
Unemployment rate, April 2022: 2.1%
Median home value: $150,600
Total population: 76,175
 24/7 Wall St.
Source: Art Wager / iStock via Getty Images
8. Urban Honolulu, HI
Population change due to migration, 2020-2021: -1.4% (-13,686)
Total population change, 2020-2021: -1.2% (-12,337)
Unemployment rate, April 2022: 3.7%
Median home value: $702,300
Total population: 1,000,890

Source: Ron and Patty Thomas / E+ via Getty Images
7. Los Angeles-Long Beach-Anaheim, CA
Population change due to migration, 2020-2021: -1.5% (-199,539)
Total population change, 2020-2021: -1.3% (-175,913)
Unemployment rate, April 2022: 5.0%
Median home value: $641,300
Total population: 12,997,353
[in-text-ad-2]

Source: TomasSereda / iStock via Getty Images
6. New York-Newark-Jersey City, NY-NJ-PA
Population change due to migration, 2020-2021: -1.8% (-361,774)
Total population change, 2020-2021: -1.6% (-327,955)
Unemployment rate, April 2022: 4.8%
Median home value: $465,400
Total population: 19,768,458

Source: DenisTangneyJr / iStock via Getty Images
5. Midland, TX
Population change due to migration, 2020-2021: -2.1% (-3,763)
Total population change, 2020-2021: -1.3% (-2,291)
Unemployment rate, April 2022: 4.0%
Median home value: $231,100
Total population: 173,180
[in-text-ad]

Source: DenisTangneyJr / iStock via Getty Images
4. San Jose-Sunnyvale-Santa Clara, CA
Population change due to migration, 2020-2021: -2.5% (-49,412)
Total population change, 2020-2021: -2.2% (-42,920)
Unemployment rate, April 2022: 2.8%
Median home value: $1,041,800
Total population: 1,952,185
 24/7 Wall St.
Source: bluejayphoto / iStock via Getty Images
3. San Francisco-Oakland-Berkeley, CA
Population change due to migration, 2020-2021: -2.6% (-123,885)
Total population change, 2020-2021: -2.5% (-116,385)
Unemployment rate, April 2022: 3.3%
Median home value: $888,500
Total population: 4,623,264

Source: DenisTangneyJr / iStock via Getty Images
2. Odessa, TX
Population change due to migration, 2020-2021: -3.6% (-5,878)
Total population change, 2020-2021: -2.6% (-4,376)
Unemployment rate, April 2022: 5.8%
Median home value: $147,900
Total population: 161,091
[in-text-ad-2]

Source: DenisTangneyJr / iStock via Getty Images
1. Lake Charles, LA
Population change due to migration, 2020-2021: -5.3% (-11,824)
Total population change, 2020-2021: -5.3% (-11,673)
Unemployment rate, April 2022: 3.9%
Median home value: $159,600
Total population: 210,362
Methodology
To determine the cities Americans are abandoning, 24/7 Wall St. reviewed data from the U.S. Census Bureau’s Population and Housing Unit Estimates program. Metropolitan statistical areas were ranked based on the percentage change in population due to net migration from July 1, 2020 to July 1, 2021.
Supplemental data on total population change — including change due to births and deaths — also came from the Census Bureau PEP program. Data on median home value came from the Census Bureau’s 2020 American Community and figures are five-year estimates. Unemployment rates for April 2022 came from the U.S. Bureau of Labor Statistics and are not seasonally adjusted.
Take This Retirement Quiz To Get Matched With An Advisor Now (Sponsored)
Are you ready for retirement? Planning for retirement can be overwhelming, that’s why it could be a good idea to speak to a fiduciary financial advisor about your goals today.
Start by taking this retirement quiz right here from SmartAsset that will match you with up to 3 financial advisors that serve your area and beyond in 5 minutes. Smart Asset is now matching over 50,000 people a month.
Click here now to get started.
Thank you for reading! Have some feedback for us?
Contact the 24/7 Wall St. editorial team.
Editors' Picks