
With the pandemic facilitating remote work and allowing more Americans to move to places away from their jobs, some are taking the opportunity to move to more desired areas, be it for warmer weather or more affordable housing markets and cost of living. With rising inflation and other challenges Americans are flocking to cities that meet their evolving needs.
The U.S. Census Bureau determined that in 2021, over 27 million Americans moved to a different residence. While the 2021 U.S. moving rate of 8.4% is lower than in recent years, Americans are still on the move. In a survey of 1,000 Americans who changed residence in 2021, Move.org found that many were seeking better weather, lower taxes, and a lower cost of living. (These are the cities with the cheapest rent.)
To identify the 25 cities Americans are flocking to, 24/7 Wall St. used population data from the Census Bureau’s Population and Housing Unit Estimates Program, ranking metropolitan areas based on the percentage change in population due to net migration between July 1, 2020 and July 1, 2021. Net migration refers to the difference between the number of people moving into an area and the number of people moving out of the area during a specific time period.
Of the 50 states, a resounding leader emerges — Florida. More than half the cities Americans are flocking to are located in the Sunshine State. Remote work opportunities allow employees to enjoy the perks of beach-front locales, recreation opportunities year-round, and a lower cost of living. Not to mention, Florida has no personal income tax and relatively low home values. Six of the eight housing markets on the list with a median home value lower than $200,000 are in Florida, with Sebring-Avon Park, at No. 11, the lowest with a median of $120,500.
Many of the cities Americans are flocking to are sunnier destinations. No. 21, Lake Havasu City-Kingman, Arizona, has 290 average days of sunshine per year, well above the national average of 205 sunny days. In fact, 22 cities on the list have more days of sunshine than average, according to the site, Best Places to Live. Americans are also opting for beach living. Over half the cities Americans are moving to are located within driving distance of a beach. (These are the best American cities for hiking in 2022.)
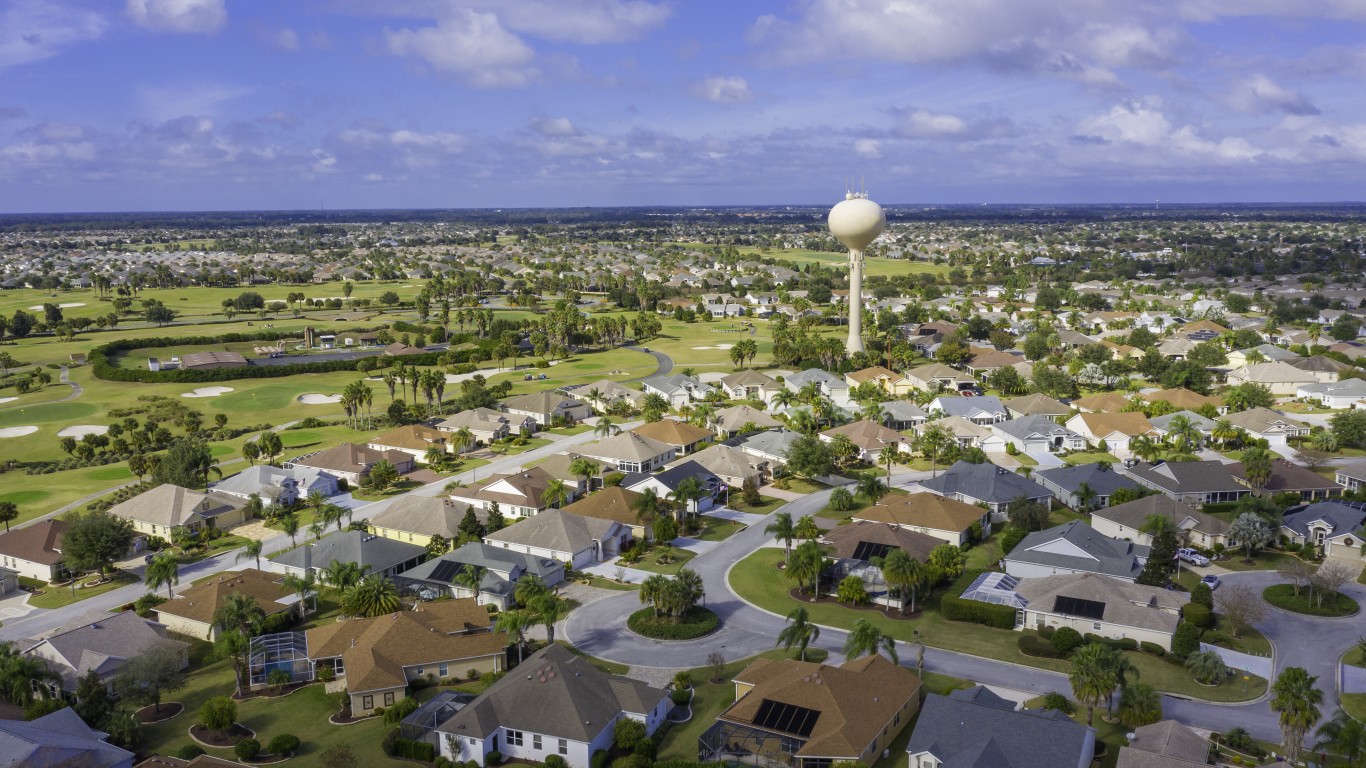
A retiring baby boomer generation may also contribute to migratory shifts in the United States. The No. 1 city Americans are flocking to is The Villages, Florida, with a population increase of 5.4%. This census-designated city is an active adult retirement community. According to the Census Bureau, 84% of the city’s population is 65 and older. The community boasts a variety of recreational activities, performing arts centers, fitness classes, and access to health care.
Click here to see the cities Americans are flocking to
Click here to read our detailed methodology

Source: Courtesy of the Town of Barnstable via Facebook
25. Barnstable Town, MA
Population change due to migration, 2020-2021: +2.4% (+5,448)
Total population change, 2020-2021: +1.5% (+3,442)
Unemployment rate, April 2022: 4.5%
Median home value: $414,000
Total population: 232,411
[in-text-ad]

Source: Sean Pavone / iStock via Getty Images
24. Hilton Head Island-Bluffton, SC
Population change due to migration, 2020-2021: +2.7% (+5,757)
Total population change, 2020-2021: +2.4% (+5,308)
Unemployment rate, April 2022: 3.1%
Median home value: $295,000
Total population: 222,072
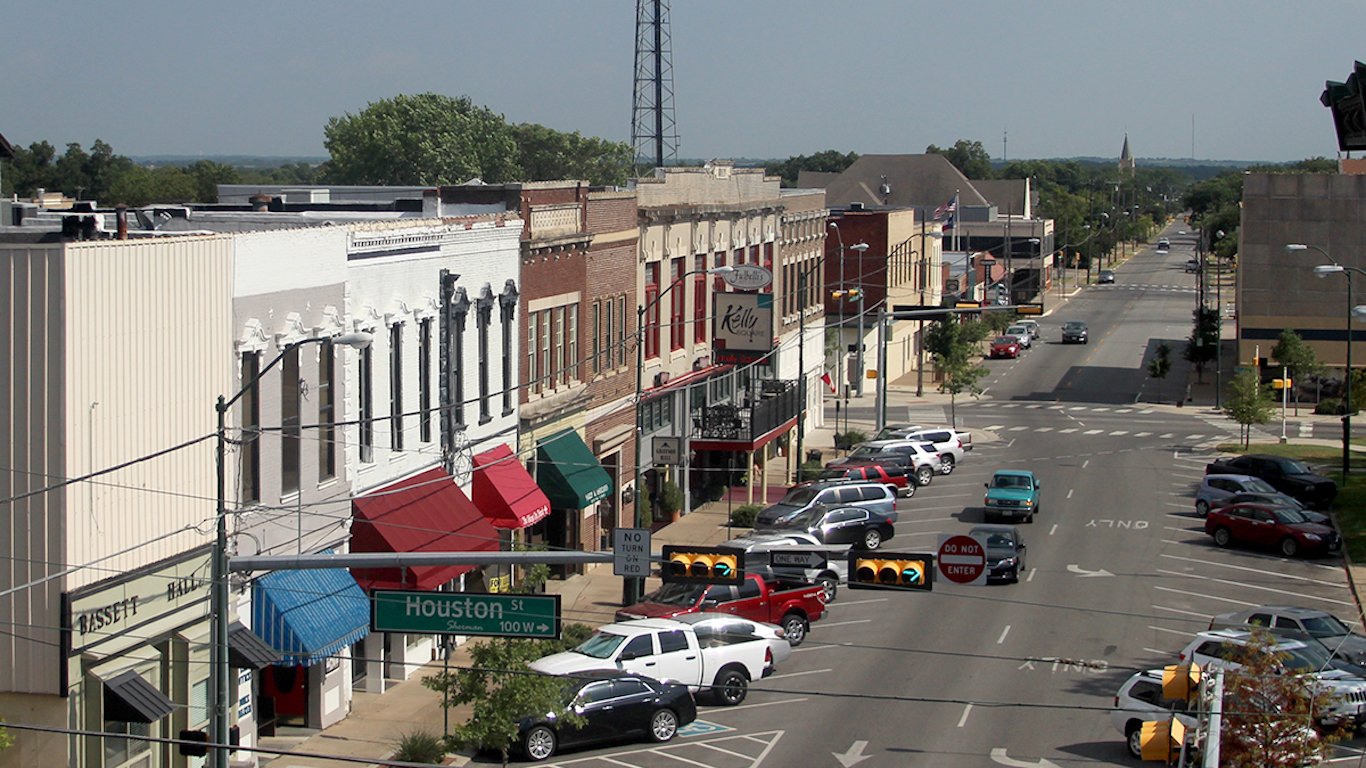
Source: Courtesy of the City of Sherman, TX
23. Sherman-Denison, TX
Population change due to migration, 2020-2021: +2.7% (+3,669)
Total population change, 2020-2021: +2.4% (+3,322)
Unemployment rate, April 2022: 3.6%
Median home value: $152,400
Total population: 139,336

Source: Joesboy / iStock via Getty Images
22. Salisbury, MD-DE
Population change due to migration, 2020-2021: +2.8% (+11,748)
Total population change, 2020-2021: +2.3% (+9,826)
Unemployment rate, April 2022: 4.6%
Median home value: $243,900
Total population: 429,223
[in-text-ad-2]

Source: DenisTangneyJr / E+ via Getty Images
21. Lake Havasu City-Kingman, AZ
Population change due to migration, 2020-2021: +2.8% (+6,045)
Total population change, 2020-2021: +1.7% (+3,622)
Unemployment rate, April 2022: 3.9%
Median home value: $172,100
Total population: 217,692

Source: JamesBrey / iStock via Getty Images
20. Bend, OR
Population change due to migration, 2020-2021: +2.8% (+5,638)
Total population change, 2020-2021: +2.7% (+5,446)
Unemployment rate, April 2022: 3.5%
Median home value: $389,300
Total population: 204,801
[in-text-ad]

Source: Sean Pavone / iStock via Getty Images
19. Naples-Marco Island, FL
Population change due to migration, 2020-2021: +2.8% (+10,724)
Total population change, 2020-2021: +2.4% (+8,901)
Unemployment rate, April 2022: 2.8%
Median home value: $366,600
Total population: 385,980
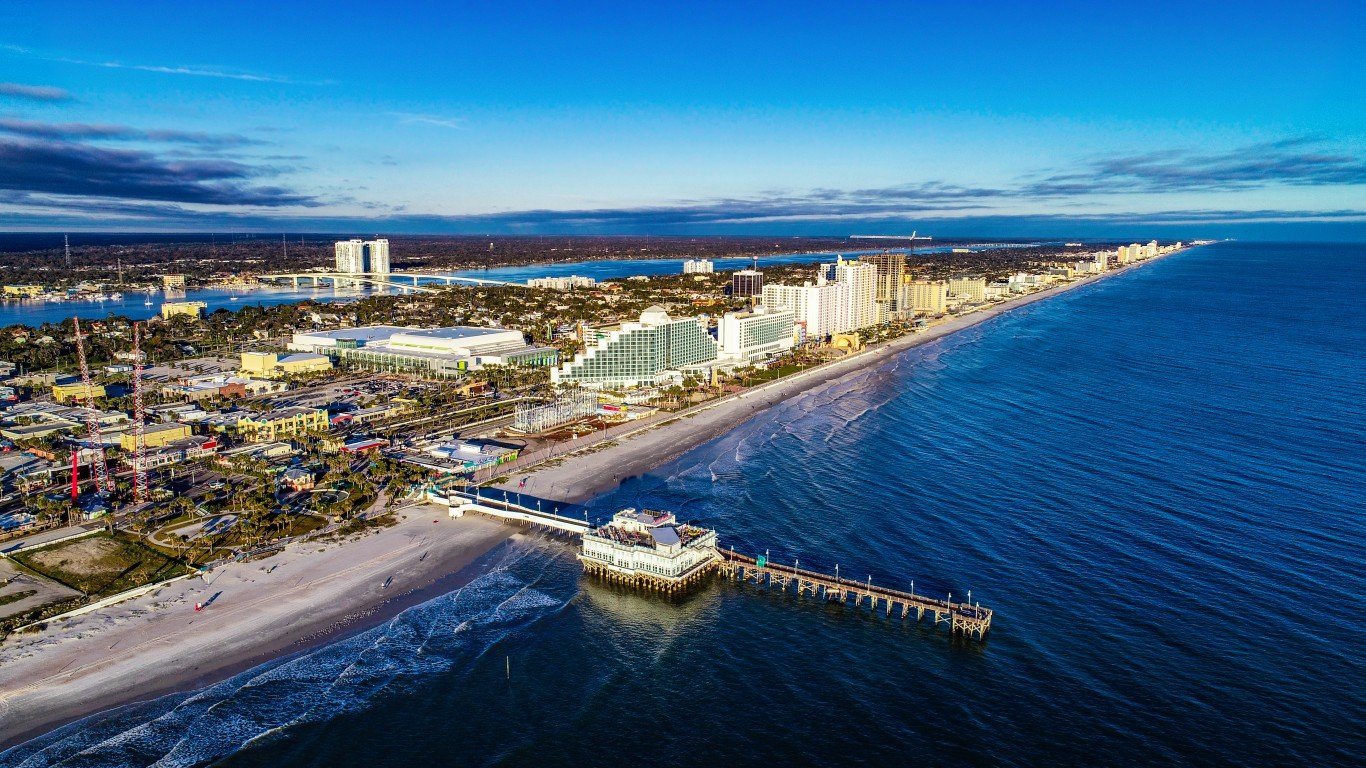
Source: Kruck20 / Getty Images
18. Deltona-Daytona Beach-Ormond Beach, FL
Population change due to migration, 2020-2021: +2.9% (+19,414)
Total population change, 2020-2021: +2.2% (+14,475)
Unemployment rate, April 2022: 3.2%
Median home value: $203,000
Total population: 685,344

Source: benedek / iStock via Getty Images
17. Panama City, FL
Population change due to migration, 2020-2021: +2.9% (+5,105)
Total population change, 2020-2021: +2.7% (+4,707)
Unemployment rate, April 2022: 2.6%
Median home value: $195,000
Total population: 179,168
[in-text-ad-2]

Source: dosecreative / iStock via Getty Images
16. Sebastian-Vero Beach, FL
Population change due to migration, 2020-2021: +2.9% (+4,695)
Total population change, 2020-2021: +2.1% (+3,317)
Unemployment rate, April 2022: 3.6%
Median home value: $220,700
Total population: 163,662
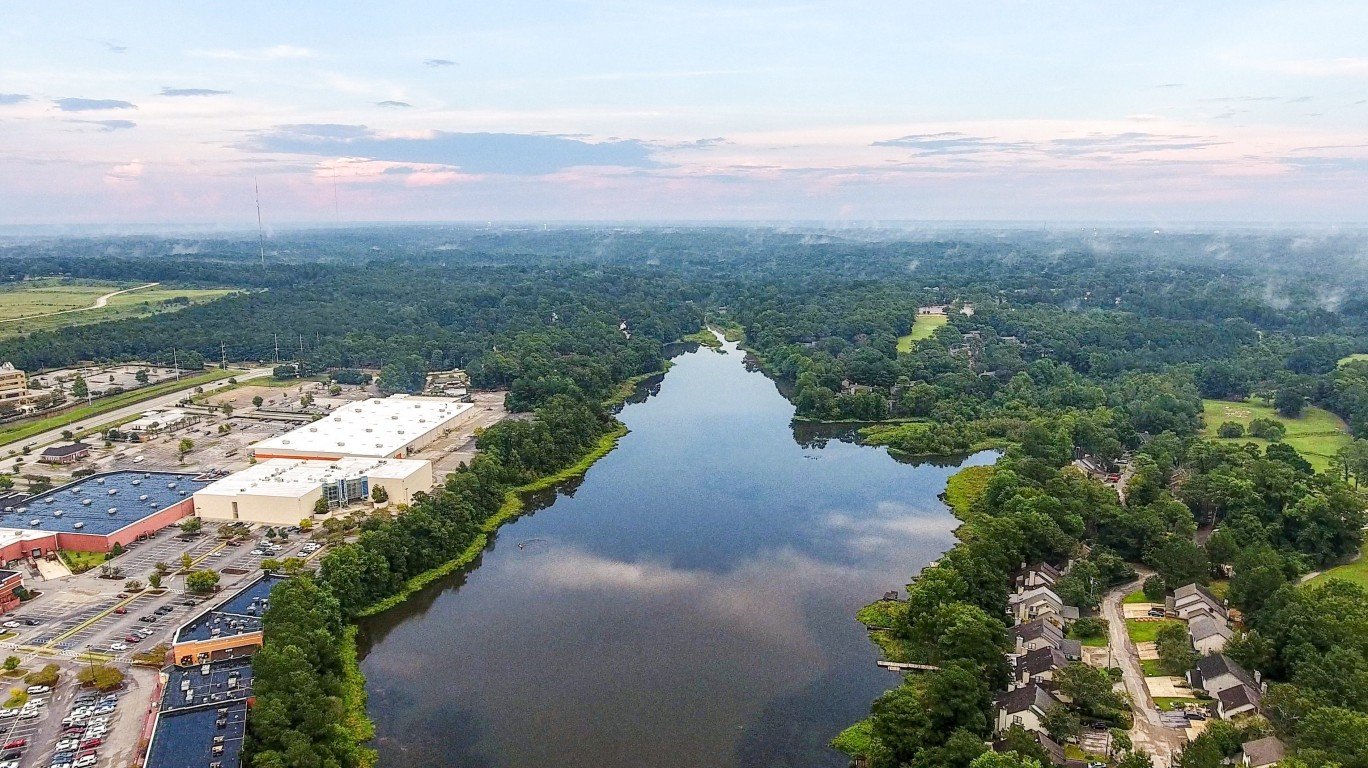
Source: George Dodd / iStock via Getty Images
15. Daphne-Fairhope-Foley, AL
Population change due to migration, 2020-2021: +2.9% (+6,843)
Total population change, 2020-2021: +2.6% (+6,154)
Unemployment rate, April 2022: 2.3%
Median home value: $211,600
Total population: 239,294
[in-text-ad]

Source: Michael Warren / iStock via Getty Images
14. Ocala, FL
Population change due to migration, 2020-2021: +3.0% (+11,440)
Total population change, 2020-2021: +2.3% (+8,545)
Unemployment rate, April 2022: 3.5%
Median home value: $151,700
Total population: 385,915

Source: Althom / iStock Editorial via Getty Images
13. Prescott Valley-Prescott, AZ
Population change due to migration, 2020-2021: +3.1% (+7,268)
Total population change, 2020-2021: +2.2% (+5,186)
Unemployment rate, April 2022: 2.6%
Median home value: $273,300
Total population: 242,253

Source: Seibel Photography LLC / iStock via Getty Images
12. Boise City, ID
Population change due to migration, 2020-2021: +3.2% (+24,261)
Total population change, 2020-2021: +3.3% (+25,687)
Unemployment rate, April 2022: 2.6%
Median home value: $268,500
Total population: 795,268
[in-text-ad-2]
Source: felixmizioznikov / iStock via Getty Images
11. Sebring-Avon Park, FL
Population change due to migration, 2020-2021: +3.2% (+3,213)
Total population change, 2020-2021: +2.0% (+2,074)
Unemployment rate, April 2022: 4.4%
Median home value: $120,500
Total population: 103,296
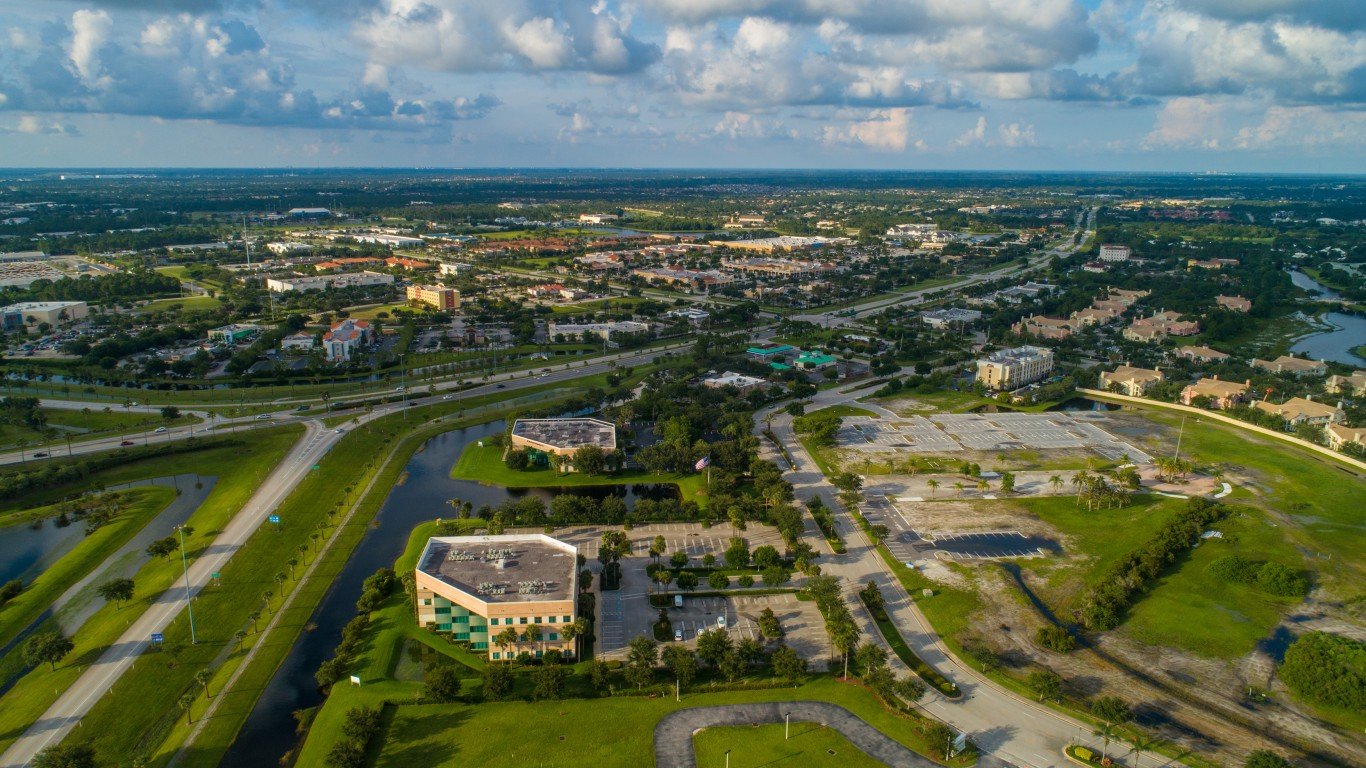
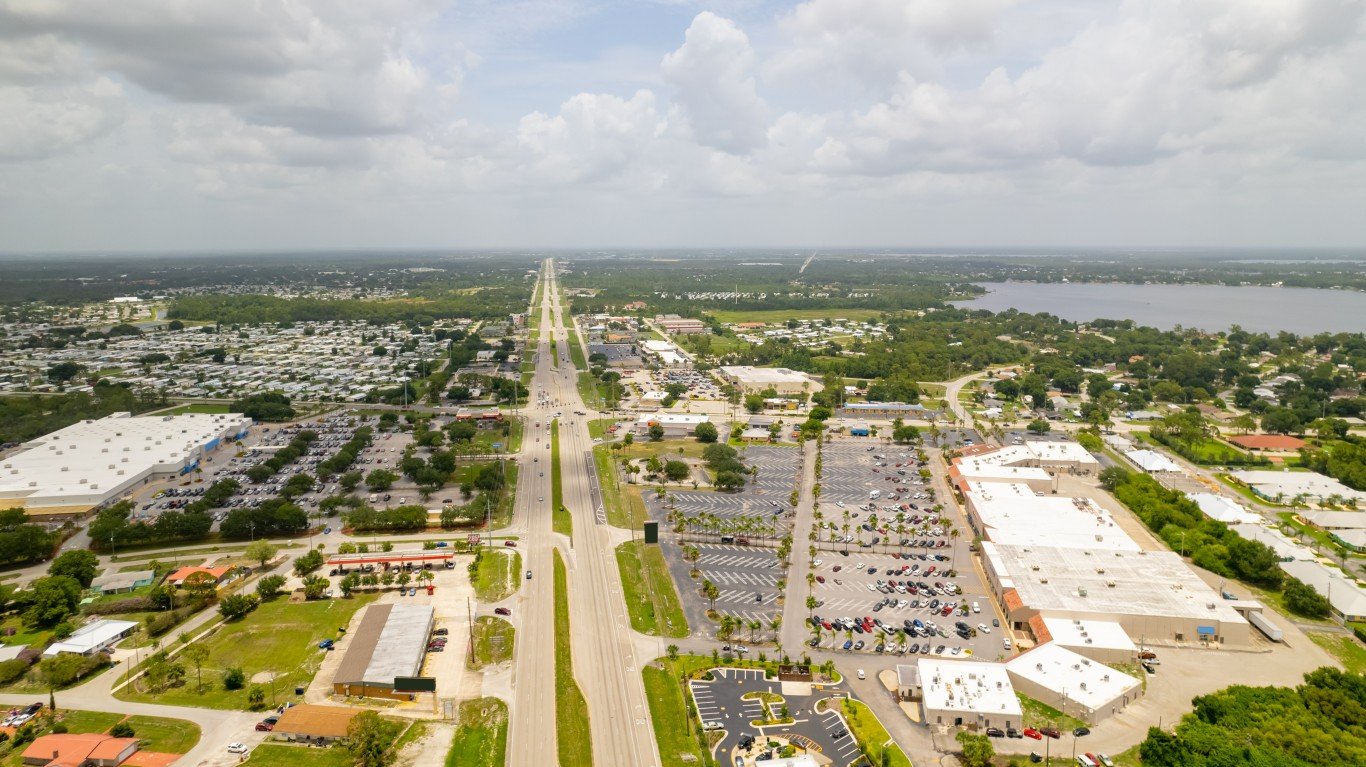
Source: felixmizioznikov / iStock via Getty Images
10. Port St. Lucie, FL
Population change due to migration, 2020-2021: +3.4% (+16,645)
Total population change, 2020-2021: +2.8% (+13,717)
Unemployment rate, April 2022: 3.2%
Median home value: $227,800
Total population: 503,521
[in-text-ad]

Source: Sean Pavone / iStock via Getty Images
9. Lakeland-Winter Haven, FL
Population change due to migration, 2020-2021: +3.5% (+25,517)
Total population change, 2020-2021: +3.3% (+24,287)
Unemployment rate, April 2022: 3.7%
Median home value: $162,400
Total population: 753,520
Source: TriggerPhoto / iStock via Getty Images
8. Cape Coral-Fort Myers, FL
Population change due to migration, 2020-2021: +3.5% (+26,813)
Total population change, 2020-2021: +3.0% (+23,297)
Unemployment rate, April 2022: 2.9%
Median home value: $235,300
Total population: 787,976
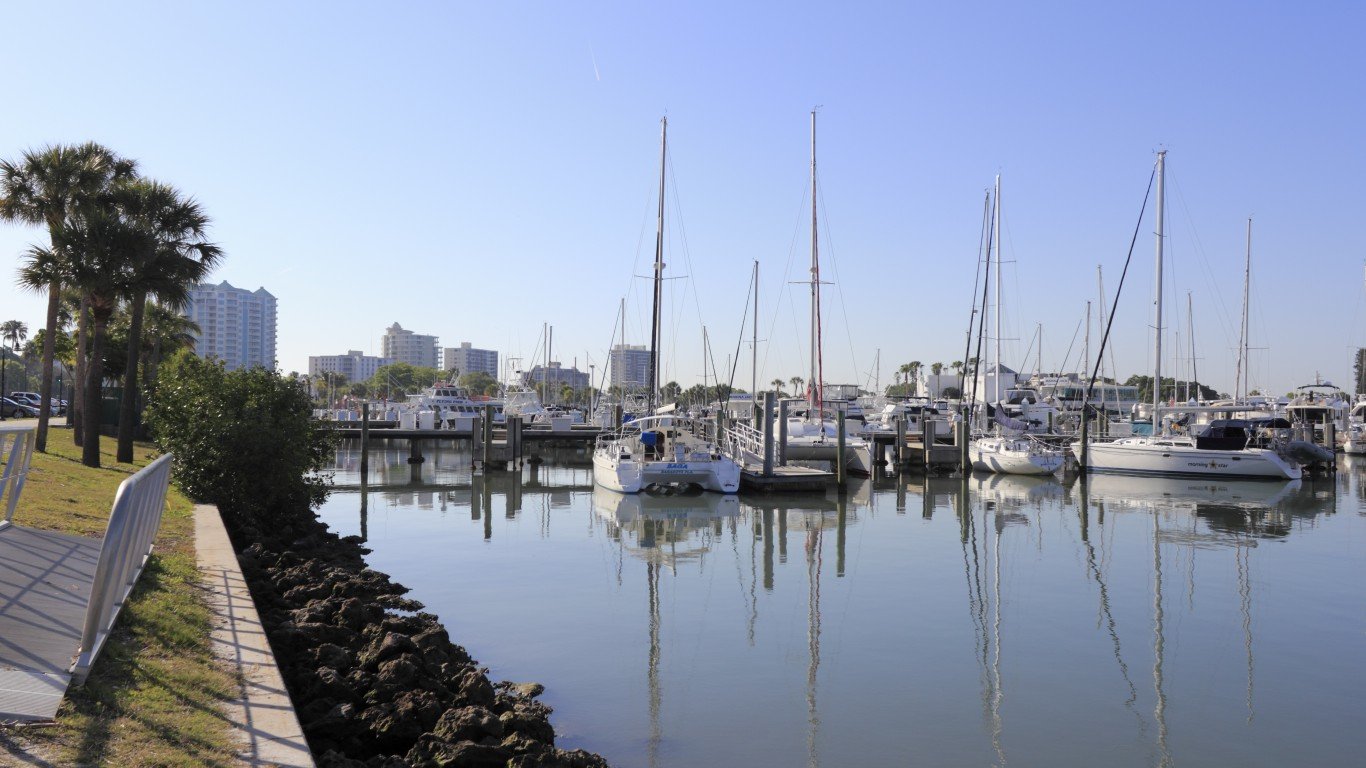
Source: Serenethos / iStock Editorial via Getty Images
7. North Port-Sarasota-Bradenton, FL
Population change due to migration, 2020-2021: +3.5% (+29,691)
Total population change, 2020-2021: +2.7% (+22,653)
Unemployment rate, April 2022: 2.7%
Median home value: $261,100
Total population: 859,760
[in-text-ad-2]

Source: csfotoimages / iStock Editorial via Getty Images
6. Homosassa Springs, FL
Population change due to migration, 2020-2021: +3.9% (+5,977)
Total population change, 2020-2021: +2.4% (+3,680)
Unemployment rate, April 2022: 4.2%
Median home value: $144,100
Total population: 158,083

Source: tristanbnz / iStock via Getty Images
5. Coeur d’Alene, ID
Population change due to migration, 2020-2021: +4.2% (+7,283)
Total population change, 2020-2021: +4.1% (+7,143)
Unemployment rate, April 2022: 3.1%
Median home value: $294,100
Total population: 179,789
[in-text-ad]

Source: Sean Pavone / iStock via Getty Images
4. Myrtle Beach-Conway-North Myrtle Beach, SC-NC
Population change due to migration, 2020-2021: +4.5% (+21,921)
Total population change, 2020-2021: +3.7% (+18,212)
Unemployment rate, April 2022: 4.1%
Median home value: $195,700
Total population: 509,794
 24/7 Wall St.
Source: DenisTangneyJr / iStock via Getty Images
3. St. George, UT
Population change due to migration, 2020-2021: +5.1% (+9,204)
Total population change, 2020-2021: +5.1% (+9,302)
Unemployment rate, April 2022: 2.2%
Median home value: $306,900
Total population: 191,226
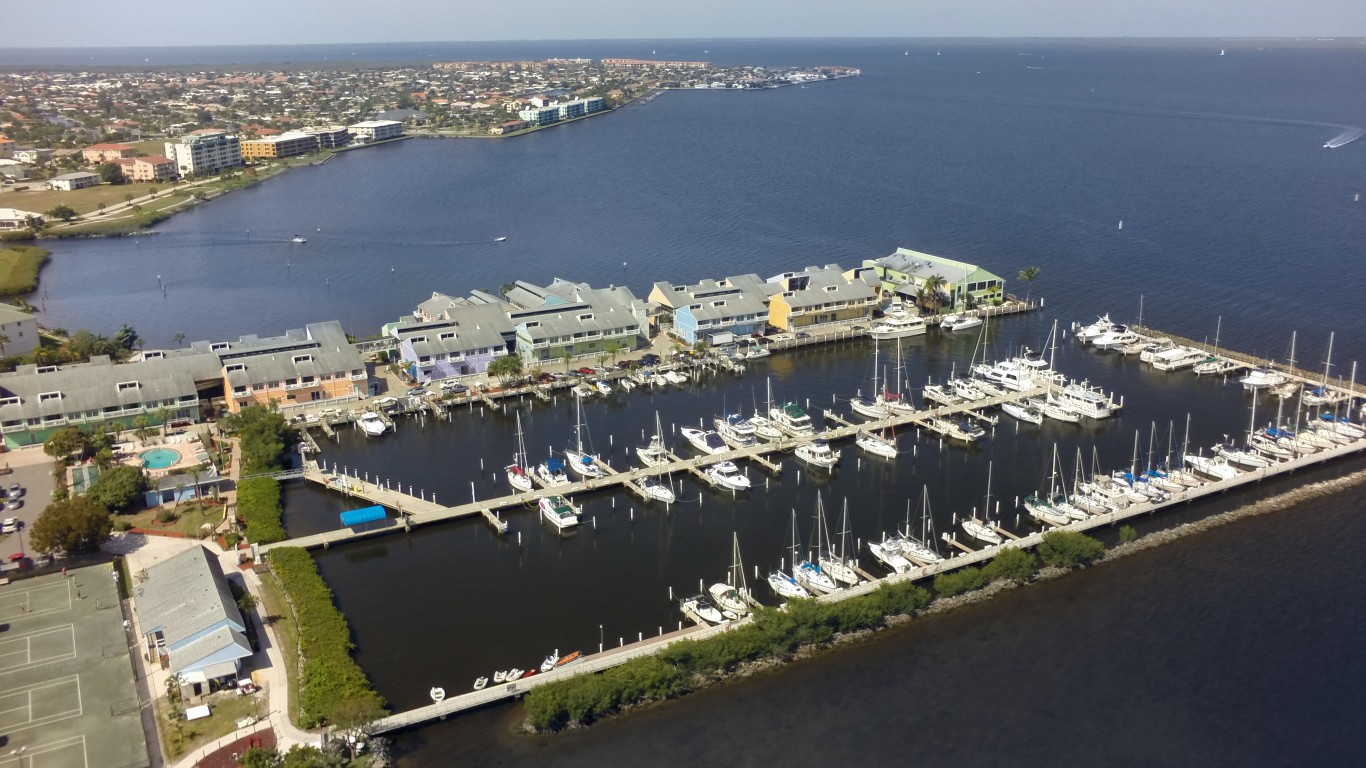
Source: choicegraphx / iStock via Getty Images
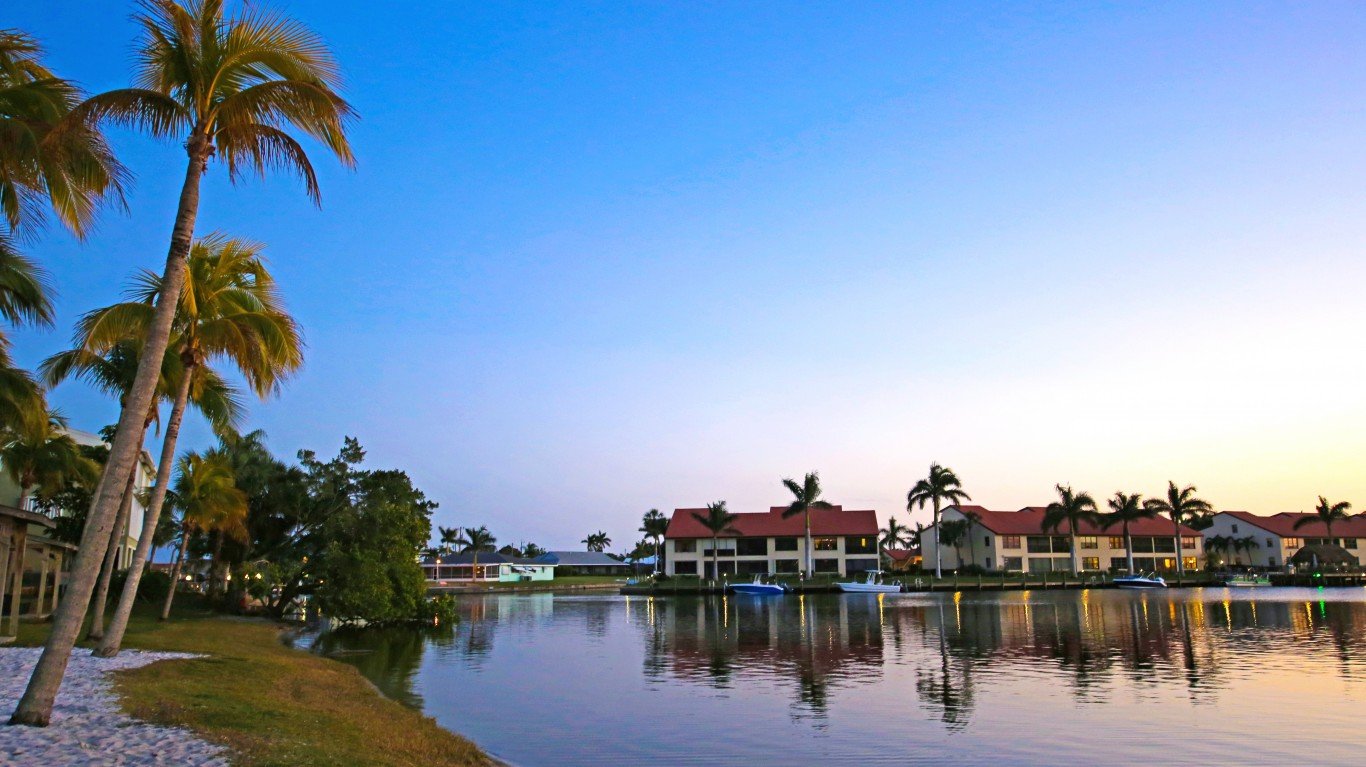
2. Punta Gorda, FL
Population change due to migration, 2020-2021: +5.1% (+9,526)
Total population change, 2020-2021: +3.7% (+6,883)
Unemployment rate, April 2022: 3.1%
Median home value: $209,500
Total population: 194,843
[in-text-ad-2]
Source: Michael Warren / iStock via Getty Images
1. The Villages, FL
Population change due to migration, 2020-2021: +5.4% (+7,105)
Total population change, 2020-2021: +3.6% (+4,741)
Unemployment rate, April 2022: 3.9%
Median home value: $267,100
Total population: 135,638
Methodology
To determine the cities Americans are flocking to, 24/7 Tempo reviewed data from the U.S. Census Bureau’s Population and Housing Unit Estimates program. Metropolitan statistical areas were ranked based on the percentage change in population due to net migration from July 1, 2020 to July 1, 2021.
Supplemental data on total population change — including change due to births and deaths — also came from the Census Bureau PEP program. Data on median home value came from the Census Bureau’s 2020 American Community and are five-year estimates. Unemployment rates for April 2022 came from the U.S. Bureau of Labor Statistics and are not seasonally adjusted.
Sponsored: Find a Qualified Financial Advisor
Finding a qualified financial advisor doesn’t have to be hard. SmartAsset’s free tool matches you with up to 3 fiduciary financial advisors in your area in 5 minutes. Each advisor has been vetted by SmartAsset and is held to a fiduciary standard to act in your best interests. If you’re ready to be matched with local advisors that can help you achieve your financial goals, get started now.
Thank you for reading! Have some feedback for us?
Contact the 24/7 Wall St. editorial team.
Editors' Picks