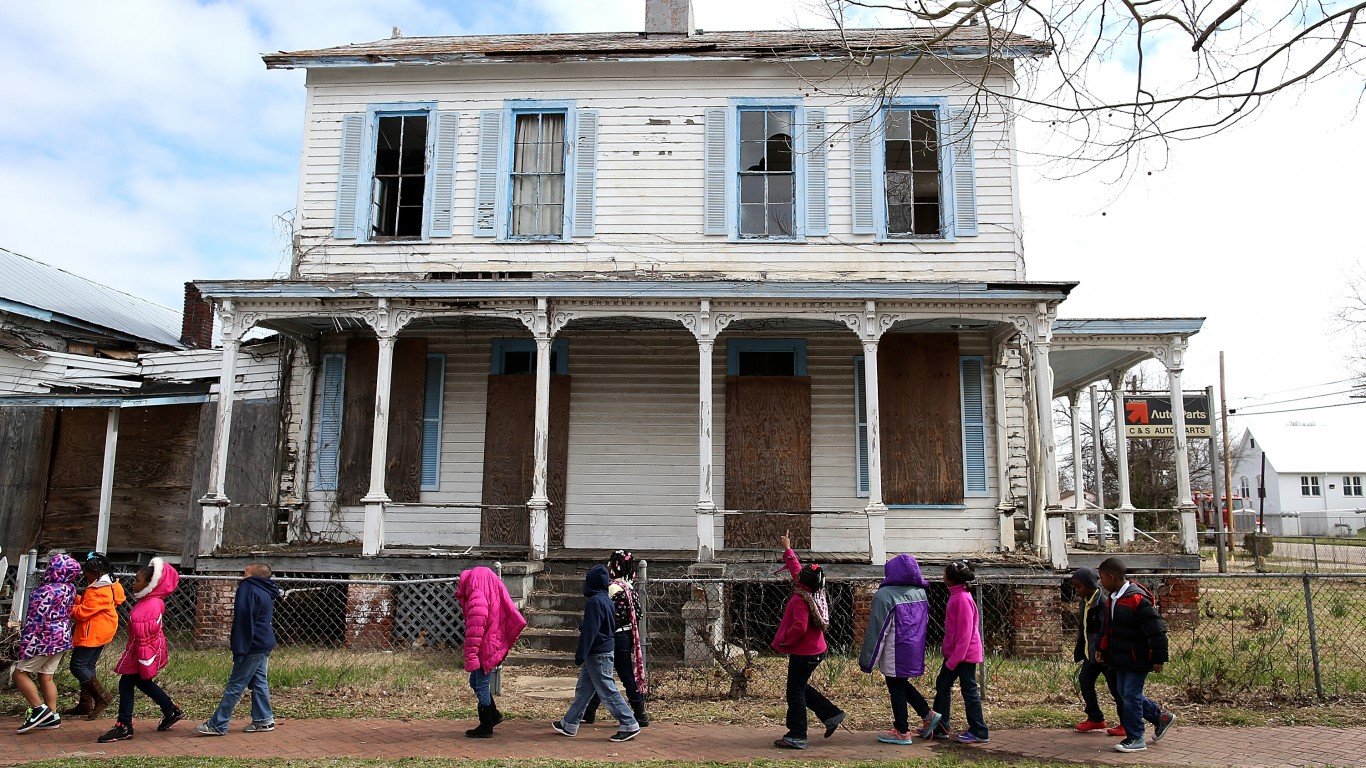
The United States has one of the worst child poverty rates among wealthy, developed countries – and nearly 12.6 million children and youth under age 18 live in households with poverty level incomes. Not only are children at higher risk of poverty, but they are also especially vulnerable to poverty’s harmful effects, both in the immediate and long-term.
Childhood poverty can negatively impact brain development and has been linked with a greater likelihood of chronic illness, shorter life expectancy, and poor emotional and behavioral health. Those who spend some or all of their childhood in poverty are also less likely to succeed in school or be financially secure later in life.
Nationwide, an estimated 17.5% of children under age 18 live below the poverty line. This share varies from place to place, however, and in some parts of the country, child poverty is far more common than average. Using data from the U.S. Census Bureau, 24/7 Wall St. identified the city in every state with the highest child poverty rate.
Among the places on this list, the child poverty rate ranges from 13.4% to over 50% and exceeds the overall statewide child poverty rate in nearly every case. Here is a look at the income a family needs to cover normal living expenses in every state.
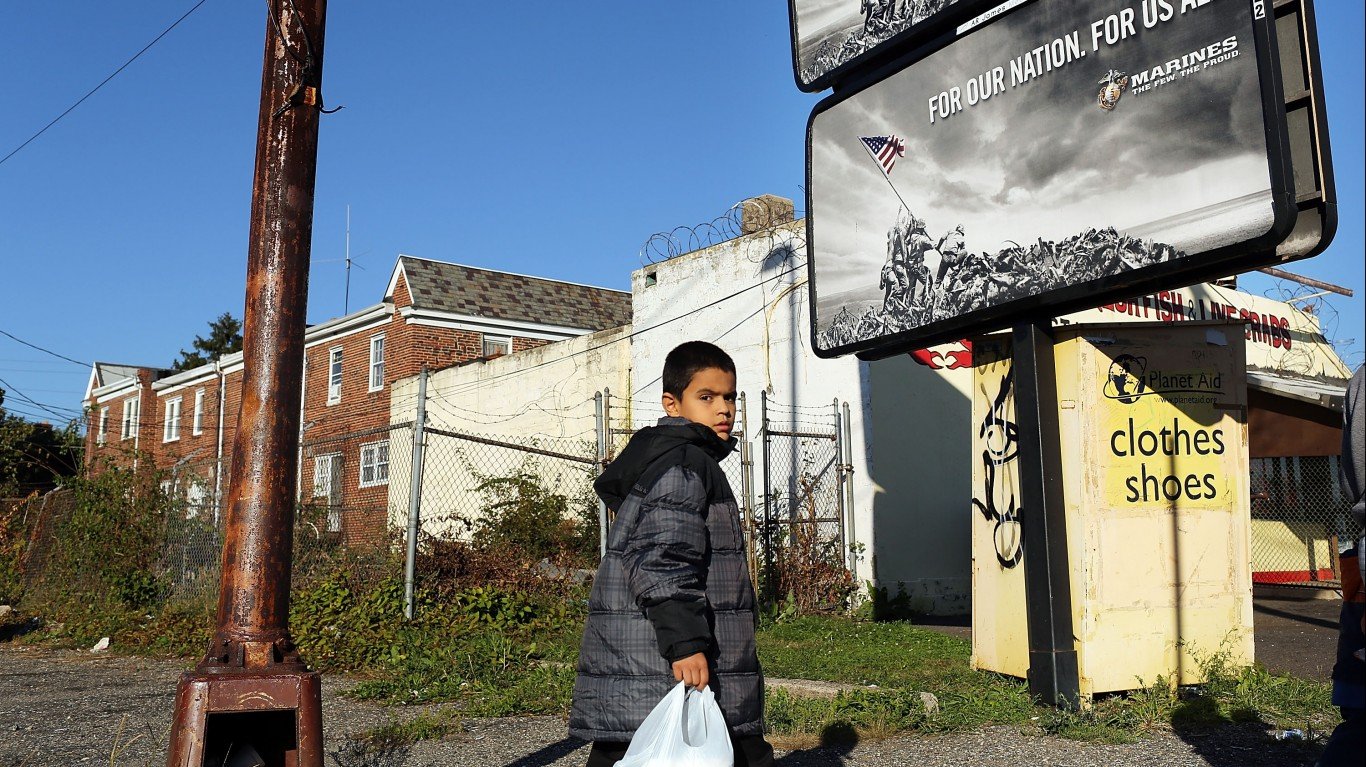
Children raised in mother-only households are far more likely to live in poverty than those in two-adult households, and in most cities on this list, the share of households headed by single mothers exceeds the comparable statewide share.
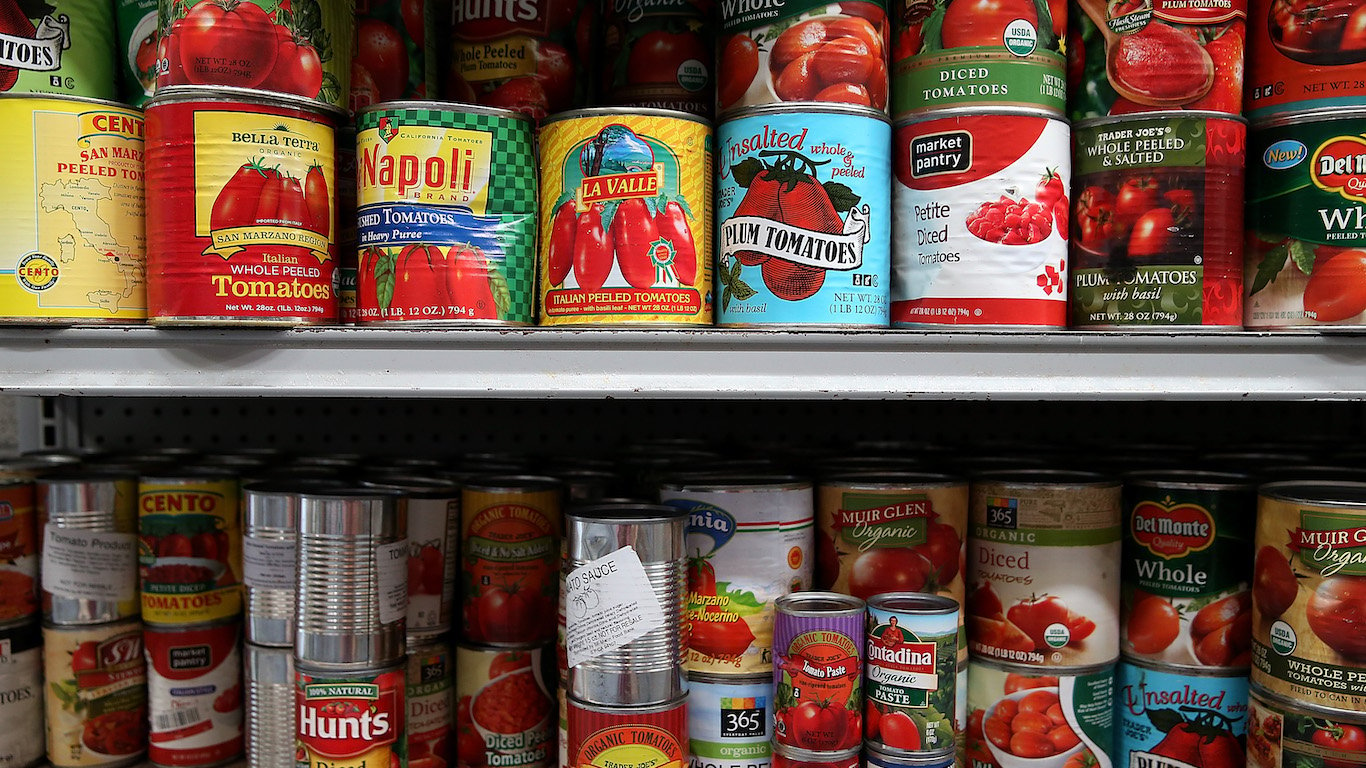
Families in these cities are also more likely to rely on government assistance to afford basic necessities than families in much of the state. The share of households with children that receive SNAP benefits, or food stamps, exceeds the statewide share in all but one city on this list. Here is a look at the cities with the most people on food stamps.
Click here to see the city in every state with the highest child poverty rate.
Click here to read our detailed methodology.

Alabama: Bessemer
> Child poverty rate: 46.5% (Alabama: 22.7%)
> Median family income, households with children: $25,819 (Alabama: $64,790)
> Share of households with children receiving SNAP benefits: 47.6% (Alabama: 22.4%)
> Households headed by single mothers: 27.3% (Alabama: 13.3%)
> No. of cities considered in ranking: 22
[in-text-ad]

Source: Jacob Boomsma / iStock via Getty Images
Alaska: Fairbanks
> Child poverty rate: 13.4% (Alaska: 13.8%)
> Median family income, households with children: $60,953 (Alaska: $88,245)
> Share of households with children receiving SNAP benefits: 17.1% (Alaska: 15.9%)
> Households headed by single mothers: 11.9% (Alaska: 10.6%)
> No. of cities considered in ranking: 3
 24/7 Wall St.
Arizona: San Luis
> Child poverty rate: 33.4% (Arizona: 20.0%)
> Median family income, households with children: $40,114 (Arizona: $69,758)
> Share of households with children receiving SNAP benefits: 40.2% (Arizona: 19.3%)
> Households headed by single mothers: 18.3% (Arizona: 11.9%)
> No. of cities considered in ranking: 36

Arkansas: Pine Bluff
> Child poverty rate: 35.4% (Arkansas: 22.0%)
> Median family income, households with children: $32,626 (Arkansas: $59,204)
> Share of households with children receiving SNAP benefits: 35.6% (Arkansas: 18.7%)
> Households headed by single mothers: 27.6% (Arkansas: 13.2%)
> No. of cities considered in ranking: 18
[in-text-ad-2]
Source: Jacob Boomsma / iStock via Getty Images
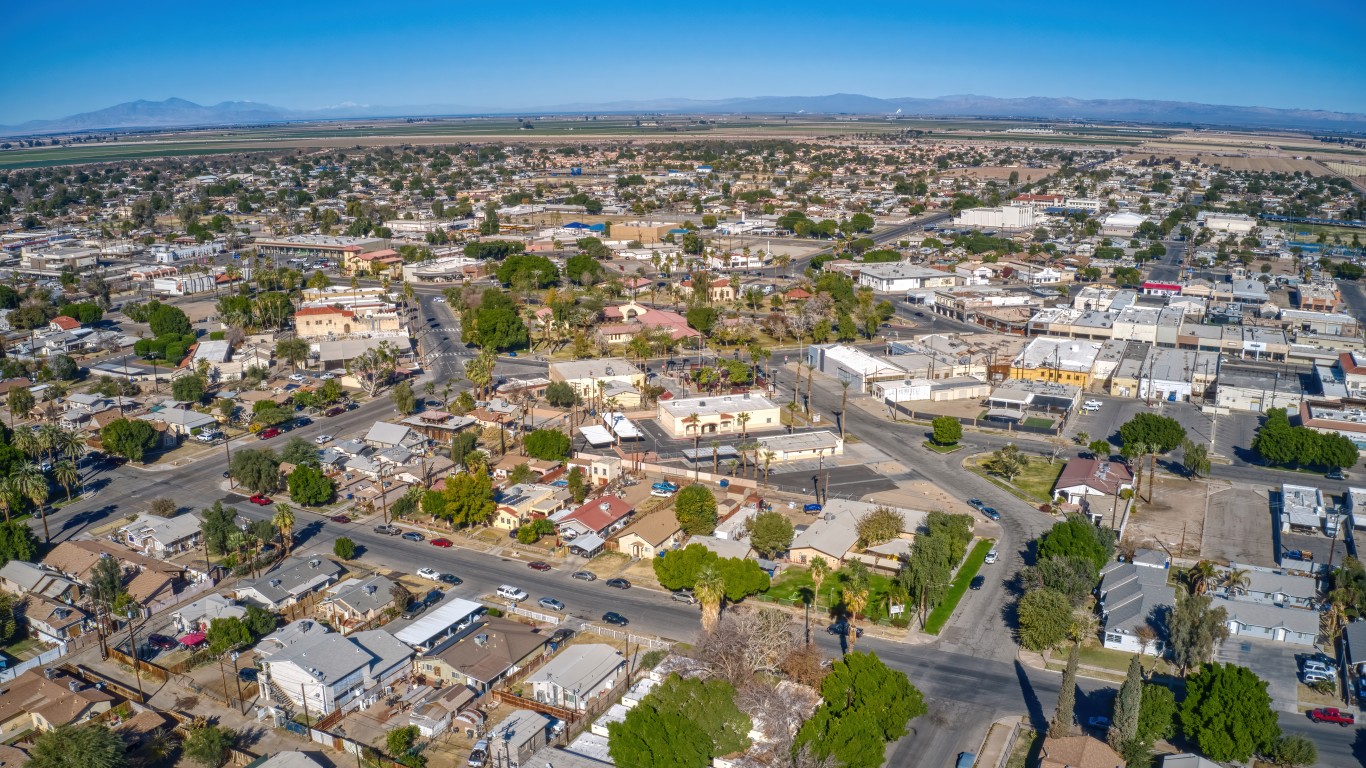
California: Brawley
> Child poverty rate: 44.9% (California: 16.8%)
> Median family income, households with children: $36,670 (California: $84,790)
> Share of households with children receiving SNAP benefits: 45.3% (California: 16.1%)
> Households headed by single mothers: 18.1% (California: 10.8%)
> No. of cities considered in ranking: 294

Source: btimages / iStock via Getty Images
Colorado: Pueblo
> Child poverty rate: 30.8% (Colorado: 11.5%)
> Median family income, households with children: $48,268 (Colorado: $91,425)
> Share of households with children receiving SNAP benefits: 37.5% (Colorado: 11.6%)
> Households headed by single mothers: 18.0% (Colorado: 9.0%)
> No. of cities considered in ranking: 32
[in-text-ad]

Connecticut: New London
> Child poverty rate: 39.5% (Connecticut: 13.0%)
> Median family income, households with children: $34,655 (Connecticut: $100,115)
> Share of households with children receiving SNAP benefits: 34.8% (Connecticut: 15.3%)
> Households headed by single mothers: 24.3% (Connecticut: 11.4%)
> No. of cities considered in ranking: 24
 24/7 Wall St.
Source: ChrisBoswell / iStock via Getty Images
Delaware: Wilmington
> Child poverty rate: 40.9% (Delaware: 17.2%)
> Median family income, households with children: $32,346 (Delaware: $79,268)
> Share of households with children receiving SNAP benefits: 40.4% (Delaware: 19.7%)
> Households headed by single mothers: 28.4% (Delaware: 12.1%)
> No. of cities considered in ranking: 3
Source: GabrielPevide / iStock via Getty Images
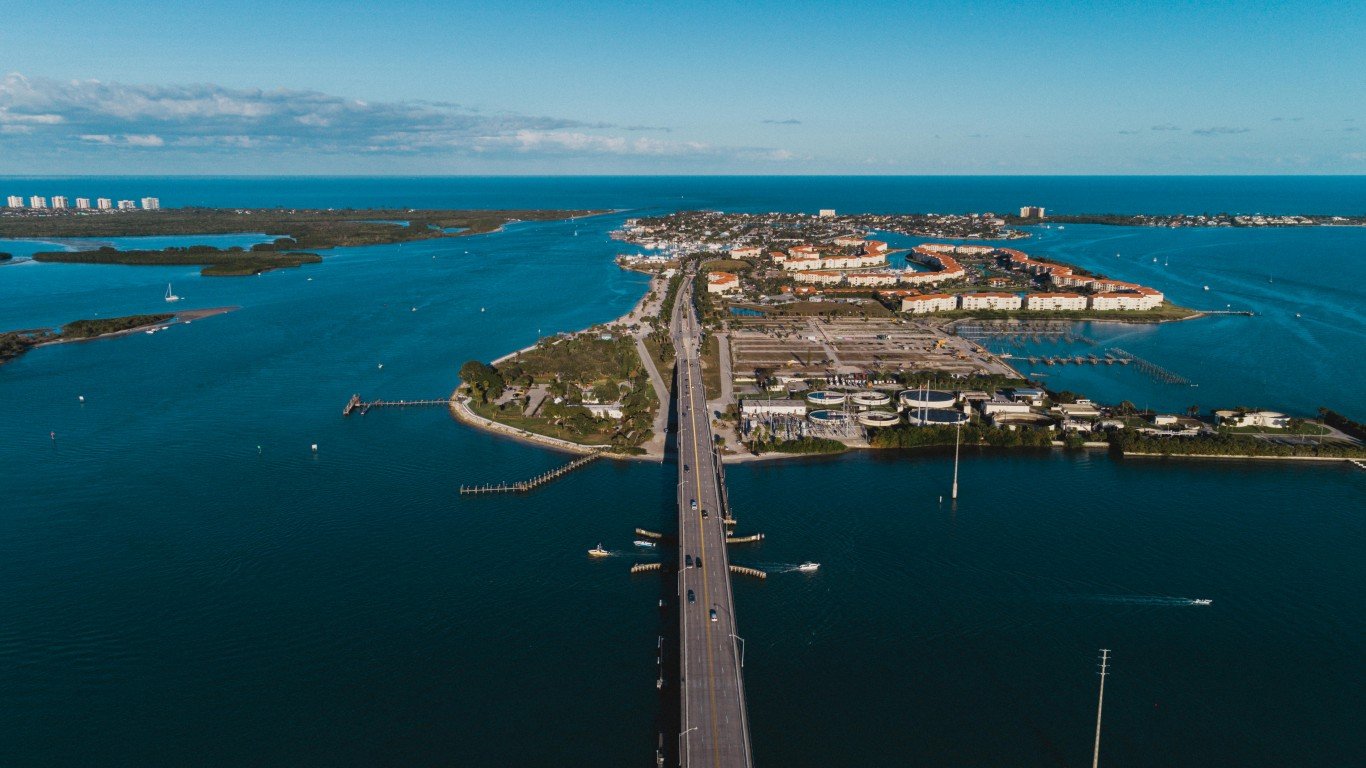
Florida: Fort Pierce
> Child poverty rate: 45.0% (Florida: 18.7%)
> Median family income, households with children: $32,837 (Florida: $65,053)
> Share of households with children receiving SNAP benefits: 48.3% (Florida: 22.7%)
> Households headed by single mothers: 22.2% (Florida: 11.4%)
> No. of cities considered in ranking: 148
[in-text-ad-2]

Source: Page Light Studios / iStock Editorial via Getty Images
Georgia: Carrollton
> Child poverty rate: 42.8% (Georgia: 20.1%)
> Median family income, households with children: $44,736 (Georgia: $70,326)
> Share of households with children receiving SNAP benefits: 37.0% (Georgia: 19.6%)
> Households headed by single mothers: 22.3% (Georgia: 14.3%)
> No. of cities considered in ranking: 45

Source: steinphoto / iStock via Getty Images
Hawaii: Hilo
> Child poverty rate: 22.6% (Hawaii: 11.7%)
> Median family income, households with children: $68,875 (Hawaii: $91,696)
> Share of households with children receiving SNAP benefits: 38.0% (Hawaii: 17.0%)
> Households headed by single mothers: 14.3% (Hawaii: 9.7%)
> No. of cities considered in ranking: 9
[in-text-ad]

Source: Bret-Barton / Getty Images
Idaho: Rexburg
> Child poverty rate: 24.2% (Idaho: 14.4%)
> Median family income, households with children: $50,794 (Idaho: $69,851)
> Share of households with children receiving SNAP benefits: 35.7% (Idaho: 15.3%)
> Households headed by single mothers: 3.9% (Idaho: 8.4%)
> No. of cities considered in ranking: 13
 24/7 Wall St.
Illinois: Danville
> Child poverty rate: 46.9% (Illinois: 16.2%)
> Median family income, households with children: $32,127 (Illinois: $83,907)
> Share of households with children receiving SNAP benefits: 42.3% (Illinois: 19.4%)
> Households headed by single mothers: 25.2% (Illinois: 11.7%)
> No. of cities considered in ranking: 85

Source: DenisTangneyJr / iStock via Getty Images
Indiana: Gary
> Child poverty rate: 54.8% (Indiana: 17.6%)
> Median family income, households with children: $25,623 (Indiana: $70,859)
> Share of households with children receiving SNAP benefits: 47.5% (Indiana: 16.0%)
> Households headed by single mothers: 35.2% (Indiana: 12.0%)
> No. of cities considered in ranking: 38
[in-text-ad-2]

Iowa: Clinton
> Child poverty rate: 26.4% (Iowa: 13.3%)
> Median family income, households with children: $61,442 (Iowa: $79,139)
> Share of households with children receiving SNAP benefits: 27.6% (Iowa: 16.7%)
> Households headed by single mothers: 13.0% (Iowa: 10.3%)
> No. of cities considered in ranking: 18

Source: TriggerPhoto / iStock via Getty Images
Kansas: Kansas City
> Child poverty rate: 27.6% (Kansas: 13.9%)
> Median family income, households with children: $44,293 (Kansas: $74,882)
> Share of households with children receiving SNAP benefits: 20.2% (Kansas: 11.6%)
> Households headed by single mothers: 17.7% (Kansas: 10.4%)
> No. of cities considered in ranking: 15
[in-text-ad]

Source: DenisTangneyJr / E+ via Getty Images
Kentucky: Covington
> Child poverty rate: 35.5% (Kentucky: 22.2%)
> Median family income, households with children: $45,522 (Kentucky: $65,096)
> Share of households with children receiving SNAP benefits: 32.1% (Kentucky: 20.8%)
> Households headed by single mothers: 20.6% (Kentucky: 12.2%)
> No. of cities considered in ranking: 15
 24/7 Wall St.
Source: DenisTangneyJr / iStock via Getty Images
Louisiana: Monroe
> Child poverty rate: 52.1% (Louisiana: 26.3%)
> Median family income, households with children: $28,291 (Louisiana: $61,722)
> Share of households with children receiving SNAP benefits: 47.8% (Louisiana: 24.9%)
> Households headed by single mothers: 30.3% (Louisiana: 16.0%)
> No. of cities considered in ranking: 18

Source: DenisTangneyJr / iStock via Getty Images
Maine: Bangor
> Child poverty rate: 23.9% (Maine: 14.0%)
> Median family income, households with children: $56,083 (Maine: $76,852)
> Share of households with children receiving SNAP benefits: 27.3% (Maine: 18.4%)
> Households headed by single mothers: 17.4% (Maine: 9.1%)
> No. of cities considered in ranking: 3
[in-text-ad-2]

Maryland: Hagerstown
> Child poverty rate: 34.4% (Maryland: 11.6%)
> Median family income, households with children: $45,331 (Maryland: $103,641)
> Share of households with children receiving SNAP benefits: 39.0% (Maryland: 15.5%)
> Households headed by single mothers: 25.2% (Maryland: 12.2%)
> No. of cities considered in ranking: 51

Massachusetts: Holyoke
> Child poverty rate: 42.3% (Massachusetts: 12.2%)
> Median family income, households with children: $33,570 (Massachusetts: $109,908)
> Share of households with children receiving SNAP benefits: 51.2% (Massachusetts: 15.8%)
> Households headed by single mothers: 29.8% (Massachusetts: 11.1%)
> No. of cities considered in ranking: 58
[in-text-ad]
Source: DenisTangneyJr / iStock via Getty Images
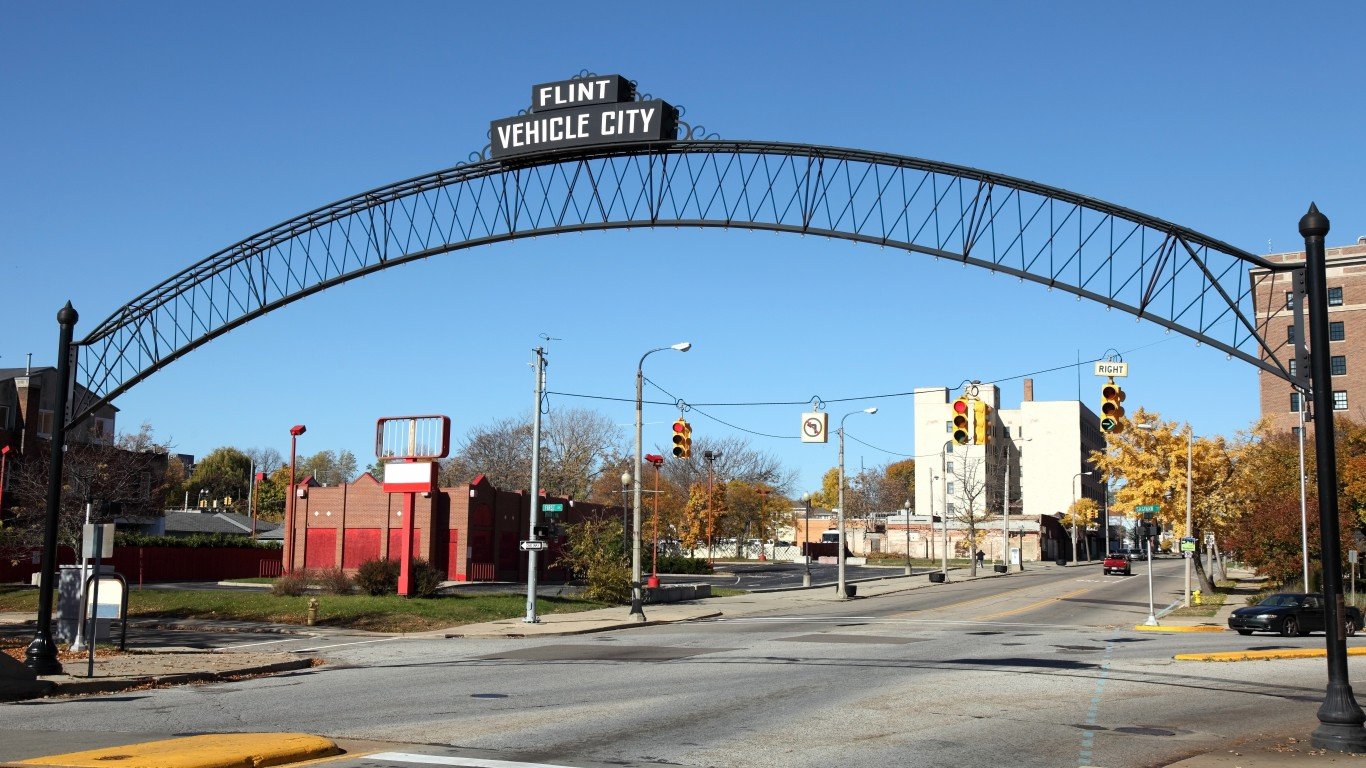
Michigan: Flint
> Child poverty rate: 53.2% (Michigan: 18.8%)
> Median family income, households with children: $24,328 (Michigan: $73,187)
> Share of households with children receiving SNAP benefits: 59.3% (Michigan: 19.7%)
> Households headed by single mothers: 31.7% (Michigan: 11.5%)
> No. of cities considered in ranking: 44

Minnesota: St. Cloud
> Child poverty rate: 27.3% (Minnesota: 11.6%)
> Median family income, households with children: $61,067 (Minnesota: $95,628)
> Share of households with children receiving SNAP benefits: 28.8% (Minnesota: 11.6%)
> Households headed by single mothers: 16.6% (Minnesota: 9.8%)
> No. of cities considered in ranking: 40

Source: Geoff Eccles / iStock via Getty Images
Mississippi: Greenville
> Child poverty rate: 53.1% (Mississippi: 27.6%)
> Median family income, households with children: $26,323 (Mississippi: $54,822)
> Share of households with children receiving SNAP benefits: 45.4% (Mississippi: 24.2%)
> Households headed by single mothers: 29.3% (Mississippi: 16.8%)
> No. of cities considered in ranking: 14
[in-text-ad-2]

Missouri: Cape Girardeau
> Child poverty rate: 30.0% (Missouri: 17.4%)
> Median family income, households with children: $63,929 (Missouri: $72,033)
> Share of households with children receiving SNAP benefits: 20.4% (Missouri: 17.2%)
> Households headed by single mothers: 11.0% (Missouri: 11.5%)
> No. of cities considered in ranking: 27

Source: leezsnow / iStock via Getty Images
Montana: Great Falls
> Child poverty rate: 18.0% (Montana: 15.2%)
> Median family income, households with children: $52,910 (Montana: $71,986)
> Share of households with children receiving SNAP benefits: 23.5% (Montana: 16.2%)
> Households headed by single mothers: 14.1% (Montana: 8.4%)
> No. of cities considered in ranking: 6
[in-text-ad]
Source: Cheri Alguire / iStock Editorial via Getty Images
Nebraska: Grand Island
> Child poverty rate: 16.6% (Nebraska: 12.2%)
> Median family income, households with children: $59,242 (Nebraska: $77,982)
> Share of households with children receiving SNAP benefits: 19.1% (Nebraska: 13.9%)
> Households headed by single mothers: 18.1% (Nebraska: 10.4%)
> No. of cities considered in ranking: 6

Nevada: Winchester
> Child poverty rate: 31.4% (Nevada: 17.6%)
> Median family income, households with children: $32,905 (Nevada: $67,738)
> Share of households with children receiving SNAP benefits: 32.5% (Nevada: 18.7%)
> Households headed by single mothers: 23.3% (Nevada: 12.8%)
> No. of cities considered in ranking: 14

Source: Sean Pavone / iStock via Getty Images
New Hampshire: Manchester
> Child poverty rate: 21.0% (New Hampshire: 8.9%)
> Median family income, households with children: $60,586 (New Hampshire: $100,798)
> Share of households with children receiving SNAP benefits: 25.5% (New Hampshire: 11.3%)
> Households headed by single mothers: 13.2% (New Hampshire: 8.2%)
> No. of cities considered in ranking: 5
[in-text-ad-2]

Source: ChrisBoswell / iStock via Getty Images
New Jersey: Atlantic City
> Child poverty rate: 50.7% (New Jersey: 13.3%)
> Median family income, households with children: $28,319 (New Jersey: $106,937)
> Share of households with children receiving SNAP benefits: 40.0% (New Jersey: 12.6%)
> Households headed by single mothers: 26.5% (New Jersey: 10.3%)
> No. of cities considered in ranking: 35
Source: SWInsider / iStock via Getty Images
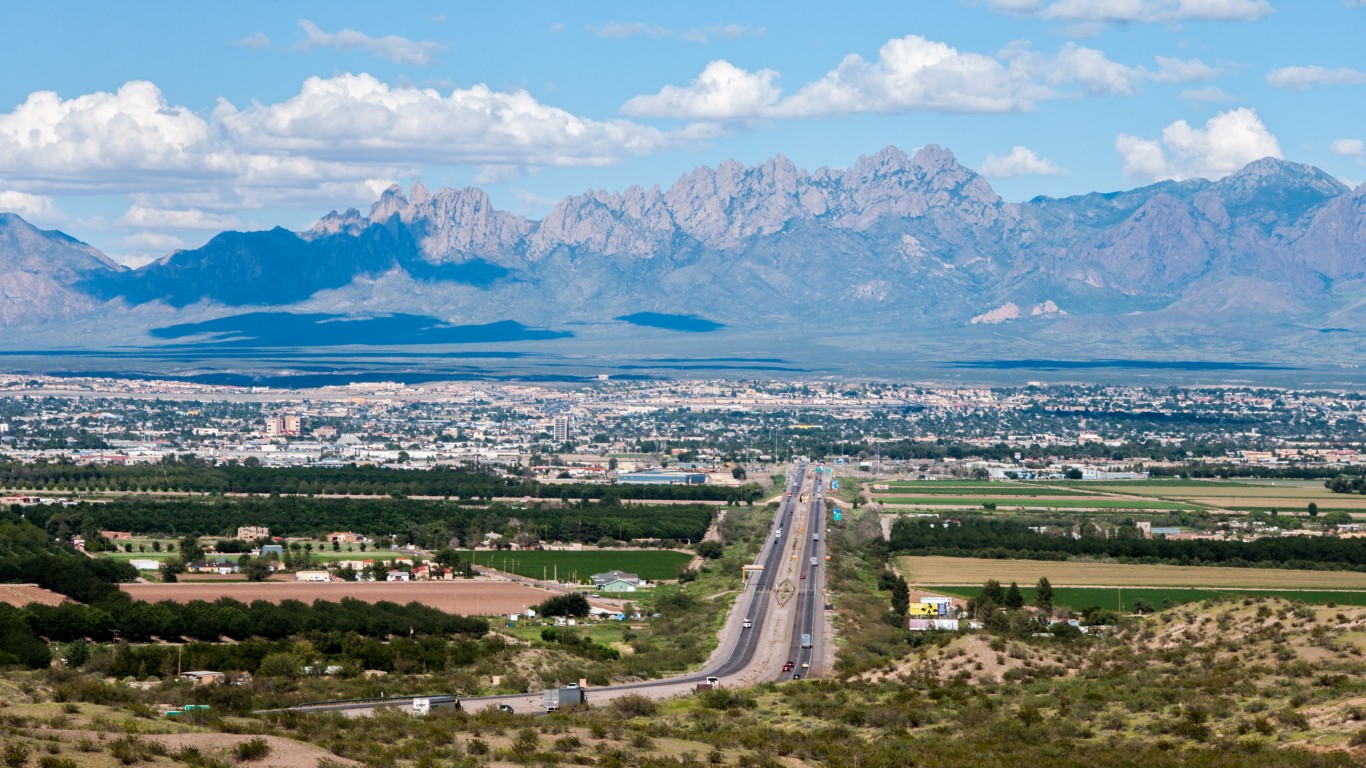
New Mexico: Las Cruces
> Child poverty rate: 30.0% (New Mexico: 25.6%)
> Median family income, households with children: $46,052 (New Mexico: $54,886)
> Share of households with children receiving SNAP benefits: 35.4% (New Mexico: 28.4%)
> Households headed by single mothers: 17.0% (New Mexico: 14.0%)
> No. of cities considered in ranking: 11
[in-text-ad]

Source: DebraMillet / iStock via Getty Images
New York: Syracuse
> Child poverty rate: 48.4% (New York: 18.7%)
> Median family income, households with children: $32,580 (New York: $83,272)
> Share of households with children receiving SNAP benefits: 50.8% (New York: 19.4%)
> Households headed by single mothers: 26.9% (New York: 12.4%)
> No. of cities considered in ranking: 58

Source: SeanPavonePhoto / iStock via Getty Images
North Carolina: Goldsboro
> Child poverty rate: 42.2% (North Carolina: 20.0%)
> Median family income, households with children: $36,035 (North Carolina: $68,688)
> Share of households with children receiving SNAP benefits: 41.7% (North Carolina: 20.0%)
> Households headed by single mothers: 22.6% (North Carolina: 12.5%)
> No. of cities considered in ranking: 40

Source: DenisTangneyJr / iStock via Getty Images
North Dakota: Grand Forks
> Child poverty rate: 15.1% (North Dakota: 11.1%)
> Median family income, households with children: $82,925 (North Dakota: $86,414)
> Share of households with children receiving SNAP benefits: 16.9% (North Dakota: 10.9%)
> Households headed by single mothers: 14.7% (North Dakota: 9.2%)
> No. of cities considered in ranking: 6
[in-text-ad-2]

Ohio: Warren
> Child poverty rate: 58.2% (Ohio: 19.1%)
> Median family income, households with children: $19,847 (Ohio: $72,130)
> Share of households with children receiving SNAP benefits: 43.6% (Ohio: 19.8%)
> Households headed by single mothers: 28.4% (Ohio: 12.8%)
> No. of cities considered in ranking: 60

Source: DenisTangneyJr / iStock via Getty Images
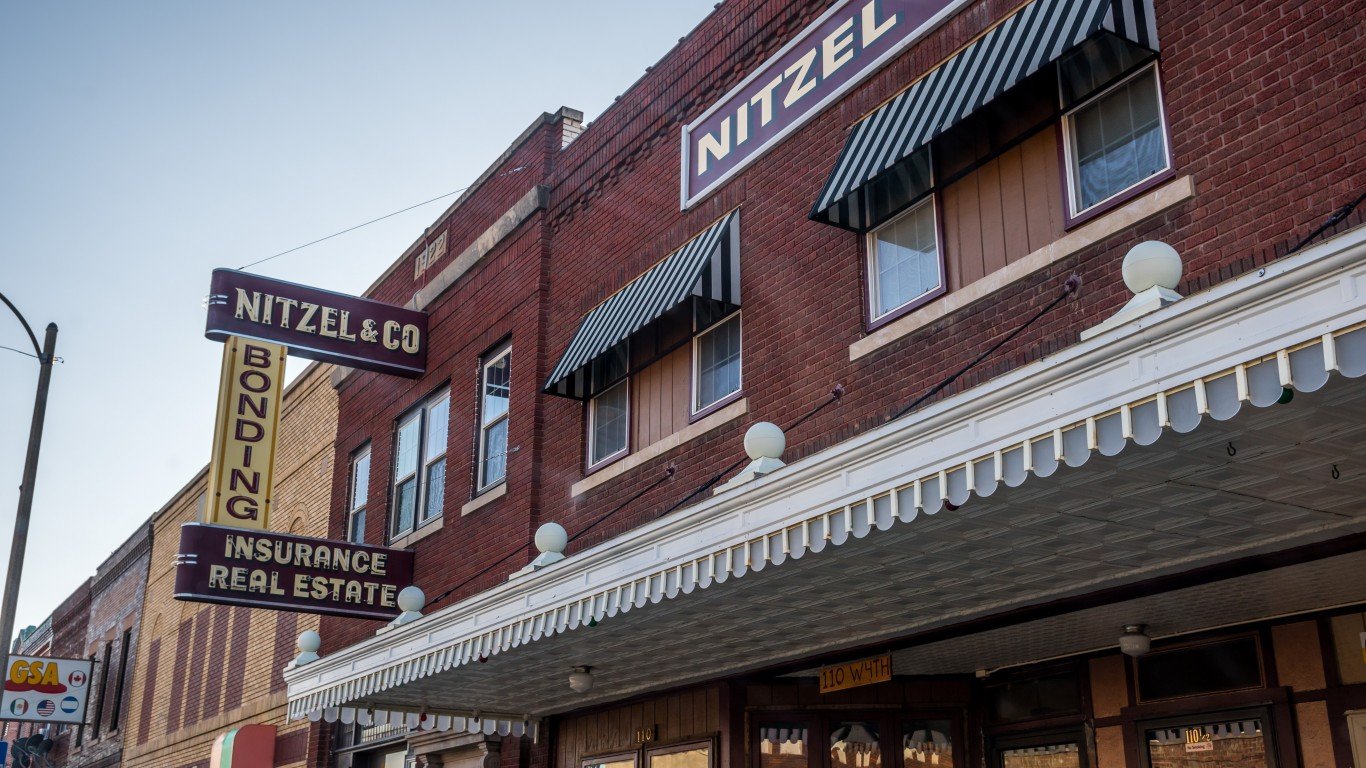
Oklahoma: Muskogee
> Child poverty rate: 36.7% (Oklahoma: 20.7%)
> Median family income, households with children: $41,617 (Oklahoma: $62,535)
> Share of households with children receiving SNAP benefits: 37.9% (Oklahoma: 20.6%)
> Households headed by single mothers: 22.9% (Oklahoma: 12.5%)
> No. of cities considered in ranking: 16
[in-text-ad]

Oregon: McMinnville
> Child poverty rate: 26.4% (Oregon: 15.0%)
> Median family income, households with children: $55,067 (Oregon: $78,939)
> Share of households with children receiving SNAP benefits: 40.8% (Oregon: 21.6%)
> Households headed by single mothers: 12.2% (Oregon: 9.9%)
> No. of cities considered in ranking: 23

Pennsylvania: Chester
> Child poverty rate: 43.5% (Pennsylvania: 16.7%)
> Median family income, households with children: $29,182 (Pennsylvania: $81,257)
> Share of households with children receiving SNAP benefits: 58.7% (Pennsylvania: 20.3%)
> Households headed by single mothers: 38.6% (Pennsylvania: 11.1%)
> No. of cities considered in ranking: 22

Source: DenisTangneyJr / iStock via Getty Images
Rhode Island: Woonsocket
> Child poverty rate: 34.8% (Rhode Island: 15.6%)
> Median family income, households with children: $39,629 (Rhode Island: $83,161)
> Share of households with children receiving SNAP benefits: 37.7% (Rhode Island: 21.0%)
> Households headed by single mothers: 24.8% (Rhode Island: 12.5%)
> No. of cities considered in ranking: 6
[in-text-ad-2]

Source: Kruck20 / iStock via Getty Images
South Carolina: Myrtle Beach
> Child poverty rate: 44.9% (South Carolina: 21.2%)
> Median family income, households with children: $32,149 (South Carolina: $64,942)
> Share of households with children receiving SNAP benefits: 22.6% (South Carolina: 20.0%)
> Households headed by single mothers: 11.9% (South Carolina: 13.4%)
> No. of cities considered in ranking: 19

Source: James_Gabbert / iStock via Getty Images
South Dakota: Rapid City
> Child poverty rate: 24.4% (South Dakota: 16.1%)
> Median family income, households with children: $66,381 (South Dakota: $76,789)
> Share of households with children receiving SNAP benefits: 23.3% (South Dakota: 15.8%)
> Households headed by single mothers: 15.5% (South Dakota: 10.3%)
> No. of cities considered in ranking: 3
[in-text-ad]

Tennessee: Memphis
> Child poverty rate: 39.6% (Tennessee: 20.8%)
> Median family income, households with children: $36,807 (Tennessee: $65,852)
> Share of households with children receiving SNAP benefits: 36.7% (Tennessee: 20.9%)
> Households headed by single mothers: 26.9% (Tennessee: 12.4%)
> No. of cities considered in ranking: 27
Source: Roberto Galan / iStock Editorial via Getty Images
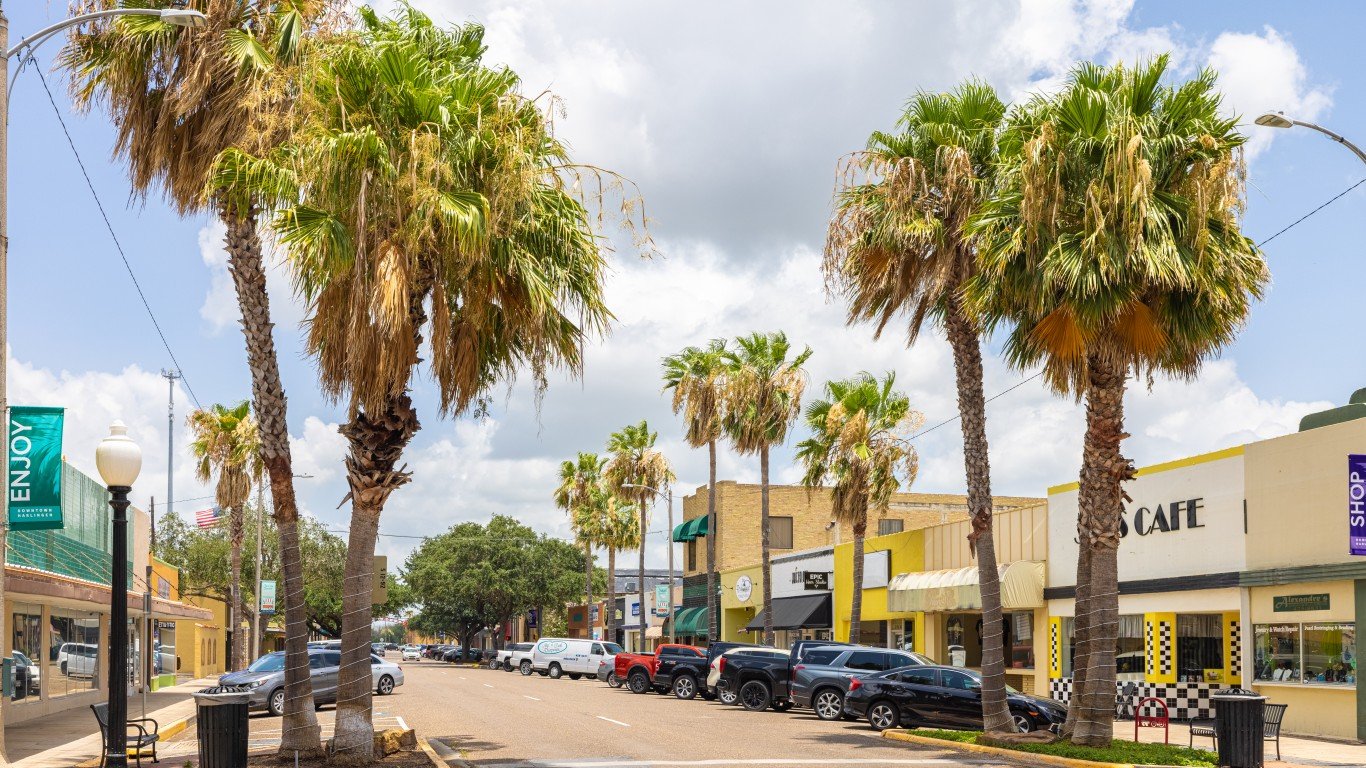
Texas: Harlingen
> Child poverty rate: 41.1% (Texas: 20.0%)
> Median family income, households with children: $38,375 (Texas: $71,693)
> Share of households with children receiving SNAP benefits: 42.3% (Texas: 19.3%)
> Households headed by single mothers: 23.5% (Texas: 13.2%)
> No. of cities considered in ranking: 125

Source: DenisTangneyJr / iStock via Getty Images
Utah: Logan
> Child poverty rate: 30.4% (Utah: 9.9%)
> Median family income, households with children: $44,962 (Utah: $84,298)
> Share of households with children receiving SNAP benefits: 24.5% (Utah: 9.4%)
> Households headed by single mothers: 10.0% (Utah: 7.7%)
> No. of cities considered in ranking: 36
[in-text-ad-2]

Vermont: Burlington
> Child poverty rate: 20.4% (Vermont: 12.3%)
> Median family income, households with children: $82,200 (Vermont: $81,902)
> Share of households with children receiving SNAP benefits: 17.6% (Vermont: 15.2%)
> Households headed by single mothers: 13.5% (Vermont: 9.5%)
> No. of cities considered in ranking: 1
*Because Burlington is the only eligible city in Vermont, it is the city with the highest child poverty rate by default.

Virginia: Danville
> Child poverty rate: 35.1% (Virginia: 13.1%)
> Median family income, households with children: $35,743 (Virginia: $93,828)
> Share of households with children receiving SNAP benefits: 38.6% (Virginia: 13.1%)
> Households headed by single mothers: 21.8% (Virginia: 10.8%)
> No. of cities considered in ranking: 40
[in-text-ad]

Washington: Yakima
> Child poverty rate: 27.4% (Washington: 12.6%)
> Median family income, households with children: $46,745 (Washington: $90,447)
> Share of households with children receiving SNAP benefits: 37.4% (Washington: 16.0%)
> Households headed by single mothers: 18.5% (Washington: 9.4%)
> No. of cities considered in ranking: 47
 24/7 Wall St.
Source: 6381380 / iStock Editorial via Getty Images
West Virginia: Huntington
> Child poverty rate: 37.9% (West Virginia: 23.1%)
> Median family income, households with children: $45,656 (West Virginia: $59,938)
> Share of households with children receiving SNAP benefits: 33.5% (West Virginia: 26.8%)
> Households headed by single mothers: 14.3% (West Virginia: 10.3%)
> No. of cities considered in ranking: 5

Source: DenisTangneyJr / E+ via Getty Images
Wisconsin: Milwaukee
> Child poverty rate: 35.1% (Wisconsin: 14.2%)
> Median family income, households with children: $39,267 (Wisconsin: $81,197)
> Share of households with children receiving SNAP benefits: 41.4% (Wisconsin: 16.6%)
> Households headed by single mothers: 27.4% (Wisconsin: 10.2%)
> No. of cities considered in ranking: 32
[in-text-ad-2]
Source: raksyBH / iStock via Getty Images
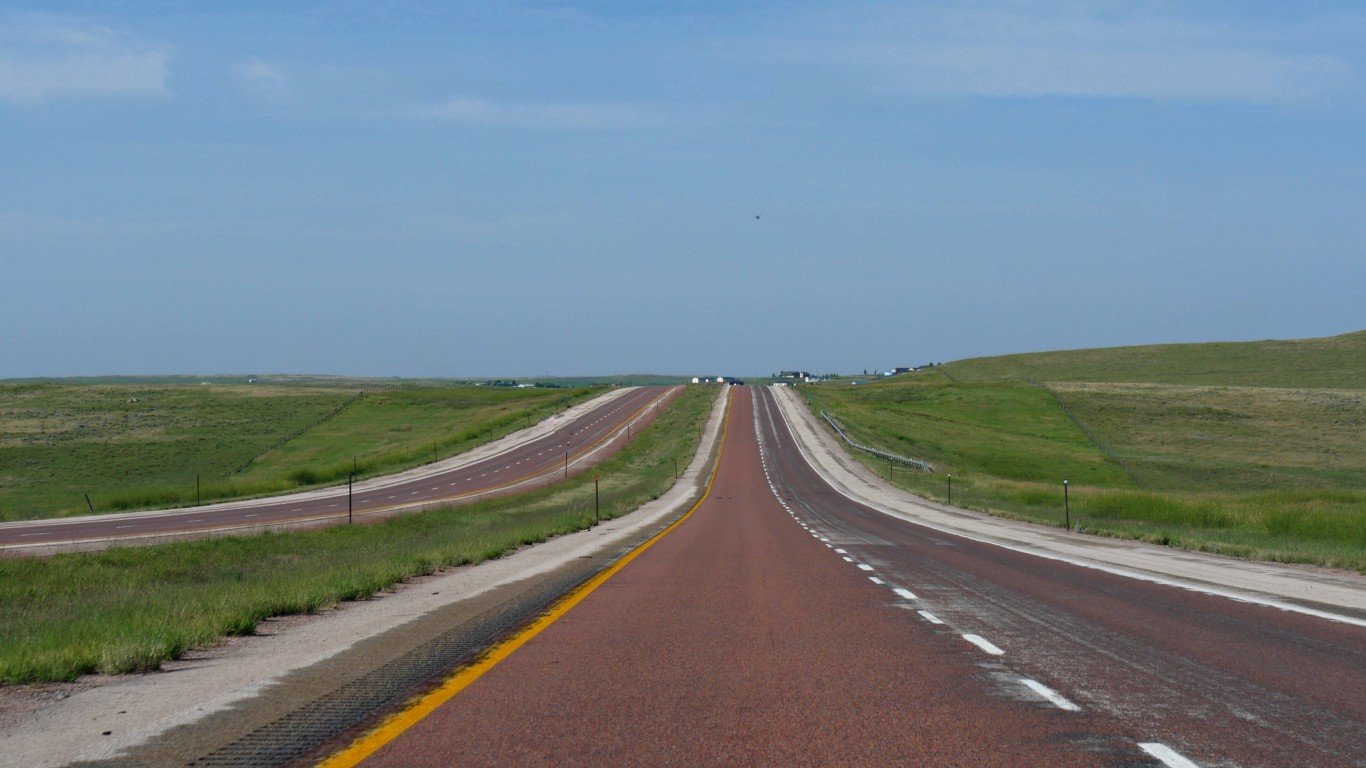
Wyoming: Gillette
> Child poverty rate: 16.7% (Wyoming: 12.3%)
> Median family income, households with children: $78,614 (Wyoming: $80,825)
> Share of households with children receiving SNAP benefits: 7.3% (Wyoming: 9.2%)
> Households headed by single mothers: 12.9% (Wyoming: 8.7%)
> No. of cities considered in ranking: 4
Methodology
To determine the city in every state with the highest child poverty rate, 24/7 Wall St. reviewed five-year estimates of child poverty rates from the U.S. Census Bureau’s 2020 American Community Survey.
We used census “place” geographies — a category that includes incorporated legal entities and census-designated statistical entities. We defined cities based on a population threshold — census places needed to have a population of at least 25,000 to be considered.
Cities were excluded if the child poverty rate was not available in the 2020 ACS, if the number of children for whom poverty status was determined was lower than 500, or if the sampling error associated with a city’s data was deemed too high.
The sampling error was defined as too high if the coefficient of variation — a statistical assessment of how reliable an estimate is — for a city’s child poverty rate was above 15% and greater than two standard deviations above the mean CV for all cities’ child poverty rates. We similarly excluded cities that had a sampling error too high for their population, using the same definition.
Cities were ranked based on the share of children living in poverty. To break ties, we used the number of children living in poverty.
Additional information on median income for families with children, the share of households with children receiving benefits from the Supplemental Nutrition Assistance Program, and the share of households headed by single mothers are also five-year estimates from the 2020 ACS. Because the Census Bureau didn’t release one-year estimates for 2020 due to data collection issues caused by the COVID-19 pandemic, all ACS data are five-year estimates.
Sponsored: Attention Savvy Investors: Speak to 3 Financial Experts – FREE
Ever wanted an extra set of eyes on an investment you’re considering? Now you can speak with up to 3 financial experts in your area for FREE. By simply
clicking here you can begin to match with financial professionals who can help guide you through the financial decisions you’re making. And the best part? The first conversation with them is free.
Click here to match with up to 3 financial pros who would be excited to help you make financial decisions.
Thank you for reading! Have some feedback for us?
Contact the 24/7 Wall St. editorial team.
Editors' Picks