Last month at a UN climate summit in Egypt, leaders came to an agreement to help support poorer nations deal with the disastrous long-term effects of climate change. However, the summit failed to make progress on improving commitments to limit emissions, as the certainty of climate crisis becomes clearer every year.
2021 was the world’s sixth-warmest year on record, according to the U.S. National Oceanic and Atmospheric Administration. This was an improvement over 2019 and 2020, which ranked among the top three warmest on record, but it wasn’t cause for celebration. The ocean heat content – a measure of the amount of heat stored in the upper levels of oceans – broke another record high in 2021, surpassing the previous record high set in 2020.
Average sea levels have risen over 8 inches since 1880, with about 3 inches over the past 25 years, according to the U.S. Global Change Research Program. This acceleration is expected to continue in the foreseeable future, and the NOAA predicts average sea levels to rise 10-12 inches along the U.S. coastline by 2050. At those levels, infrastructure along even the most developed coastlines would be overwhelmed, increasing the frequency of devastating flooding in the same manner as we have already begun to witness in many parts of the world. Indeed, the problem is global.
To find the 25 popular cities in the world that would be most impacted by climate change in the next 20-30 years, 24/7 Wall St. reviewed a study, 2050 Climate Change City Index, published in Nestpick, a platform for furnished rental apartments. The study includes 85 cities that are top destinations and that had data in research papers used for this report. Each city was rated across three categories: sea-level, climate, and water shortage. Cities are ranked by their total score (out of 100). A score of 100 indicates the most extreme changes in climate over the next three decades.
The 25 popular cities with the greatest exposure to the effects of global warming, including rising sea levels and water shortage, have an overall risk score of between 28.6 for Oslo, Norway, to 100 for Bangkok, Thailand. These popular global destinations include rich cities like New York and London as well as poorer ones like Manila in the Philippines and Nairobi in Kenya. (Here are countries where climate change is most evident.)
Though most of these cities have large populations, three are home to fewer than a million people: the metropolitan area of New Orleans, Cardiff, U.K., and Marrakesh, Morocco.
Six of these 25 cities on this list are located in East Asia or Southeast Asia, including Manila, Bangkok, Hong Kong, and Seoul, South Korea. Five of these cities are located in the United States, due to the number of its popular cities located adjacent to bodies of water. (Some of these popular cities are home to human made landmarks climate change is destroying.)
Here are the most popular cities in the world most impacted by climate change.
Click here to read our detailed methodology.

Source: Nikolay Tsuguliev / iStock via Getty Images
25. Oslo, Norway
> Overall score (0-100): 28.6
> Potential sea-level rise impact 2050 (0-100): 1.1 (43rd largest impact)
> Avg. annual temperature, 1970-2000: 43.9°F
> Avg. annual temperature, 2050: 48.0°F (32nd largest increase)
> Population, 2018: 1,012,000
[in-text-ad]

Source: kasto80 / iStock via Getty Images
24. New York, US
> Overall score (0-100): 29.0
> Potential sea-level rise impact 2050 (0-100): 16.1 (14th largest impact)
> Avg. annual temperature, 1970-2000: 53.6°F
> Avg. annual temperature, 2050: 58.9°F (15th largest increase)
> Population, 2018: 18,819,000
 24/7 Wall St.
Source: Olga Kaya / iStock via Getty Images
23. Philadelphia, US
> Overall score (0-100): 32.9
> Potential sea-level rise impact 2050 (0-100): 18.3 (12th largest impact)
> Avg. annual temperature, 1970-2000: 53.9°F
> Avg. annual temperature, 2050: 59.7°F (5th largest increase)
> Population, 2018: 5,695,000

Source: Ben Pembery / iStock via Getty Images
22. London, UK
> Overall score (0-100): 33.6
> Potential sea-level rise impact 2050 (0-100): 28.5 (7th largest impact)
> Avg. annual temperature, 1970-2000: 52.0°F
> Avg. annual temperature, 2050: 55.8°F (41st largest increase)
> Population, 2018: 9,046,000
[in-text-ad-2]

Source: MihailTsvetkov / iStock via Getty Images
21. St. Petersburg, Russia
> Overall score (0-100): 33.7
> Potential sea-level rise impact 2050 (0-100): 1.2 (41st largest impact)
> Avg. annual temperature, 1970-2000: 41.7°F
> Avg. annual temperature, 2050: 46.8°F (17th largest increase)
> Population, 2018: 5,383,000

Source: luminis / iStock via Getty Images
20. Helsinki, Finland
> Overall score (0-100): 34.5
> Potential sea-level rise impact 2050 (0-100): 1.0 (44th largest impact)
> Avg. annual temperature, 1970-2000: 41.7°F
> Avg. annual temperature, 2050: 46.8°F (18th largest increase)
> Population, 2018: 1,279,000
[in-text-ad]

Source: Sean Pavone / iStock via Getty Images
19. New Orleans, US
> Overall score (0-100): 36.1
> Potential sea-level rise impact 2050 (0-100): 37.4 (5th largest impact)
> Avg. annual temperature, 1970-2000: 69.5°F
> Avg. annual temperature, 2050: 72.9°F (49th largest increase)
> Population, 2018: 979,000

Source: wastesoul / iStock via Getty Images
18. Santiago, Chile
> Overall score (0-100): 38.0
> Potential sea-level rise impact 2050 (0-100): 1.0 (44th largest impact)
> Avg. annual temperature, 1970-2000: 59.7°F
> Avg. annual temperature, 2050: 61.8°F (81st largest increase)
> Population, 2018: 6,680,000

Source: panaramka / iStock via Getty Images
17. Kiev, Ukraine
> Overall score (0-100): 38.0
> Potential sea-level rise impact 2050 (0-100): 1.0 (44th largest impact)
> Avg. annual temperature, 1970-2000: 46.3°F
> Avg. annual temperature, 2050: 51.7°F (14th largest increase)
> Population, 2018: 2,957,000
[in-text-ad-2]

Source: Thomas De Wever / iStock via Getty Images
16. Beijing, China
> Overall score (0-100): 39.3
> Potential sea-level rise impact 2050 (0-100): 1.0 (44th largest impact)
> Avg. annual temperature, 1970-2000: 54.4°F
> Avg. annual temperature, 2050: 58.1°F (40th largest increase)
> Population, 2018: 19,618,000

Source: IpekMorel / iStock via Getty Images
15. Istanbul, Turkey
> Overall score (0-100): 39.3
> Potential sea-level rise impact 2050 (0-100): 2.4 (33rd largest impact)
> Avg. annual temperature, 1970-2000: 57.3°F
> Avg. annual temperature, 2050: 61.0°F (39th largest increase)
> Population, 2018: 14,751,000
[in-text-ad]

Source: Everett Atlas / iStock Editorial via Getty Images
14. Toronto, Canada
> Overall score (0-100): 39.3
> Potential sea-level rise impact 2050 (0-100): 1.0 (44th largest impact)
> Avg. annual temperature, 1970-2000: 47.1°F
> Avg. annual temperature, 2050: 52.6°F (12th largest increase)
> Population, 2018: 6,082,000
 24/7 Wall St.
Source: zhuyufang / E+ via Getty Images
13. Hong Kong, Hong Kong
> Overall score (0-100): 40.7
> Potential sea-level rise impact 2050 (0-100): 15.3 (16th largest impact)
> Avg. annual temperature, 1970-2000: 73.4°F
> Avg. annual temperature, 2050: 76.2°F (65th largest increase)
> Population, 2018: 7,429,000

Source: Gian Lorenzo Ferretti Photography / E+ via Getty Images
12. Chicago, US
> Overall score (0-100): 40.7
> Potential sea-level rise impact 2050 (0-100): 1.0 (44th largest impact)
> Avg. annual temperature, 1970-2000: 50.3°F
> Avg. annual temperature, 2050: 55.9°F (7th largest increase)
> Population, 2018: 8,864,000
[in-text-ad-2]
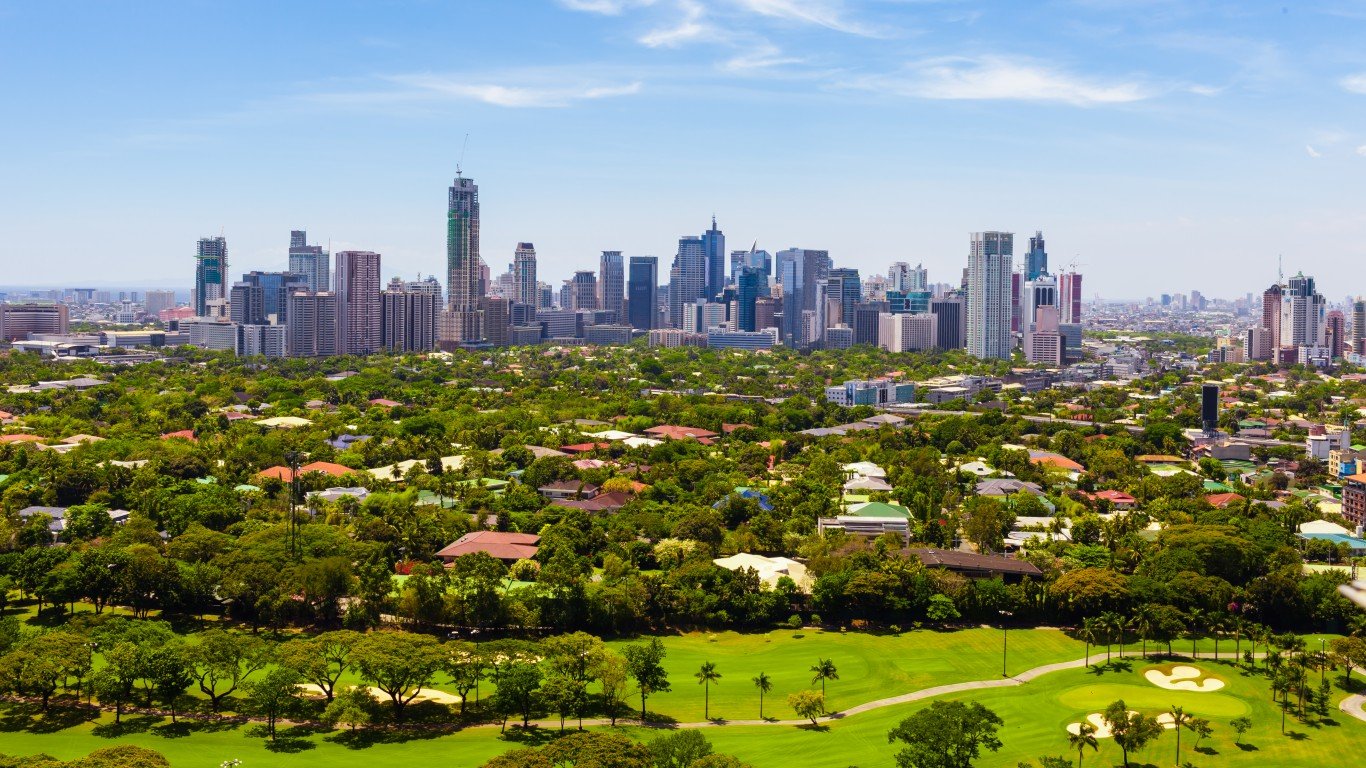
Source: kieferpix / iStock via Getty Images
11. Manila, Philippines
> Overall score (0-100): 40.8
> Potential sea-level rise impact 2050 (0-100): 37.0 (6th largest impact)
> Avg. annual temperature, 1970-2000: 81.3°F
> Avg. annual temperature, 2050: 84.0°F (66th largest increase)
> Population, 2018: 13,482,000

Source: kapyos / Getty Images
10. Marrakesh, Morocco
> Overall score (0-100): 44.6
> Potential sea-level rise impact 2050 (0-100): 1.0 (44th largest impact)
> Avg. annual temperature, 1970-2000: 66.8°F
> Avg. annual temperature, 2050: 72.0°F (16th largest increase)
> Population, 2018: 976,000
[in-text-ad]
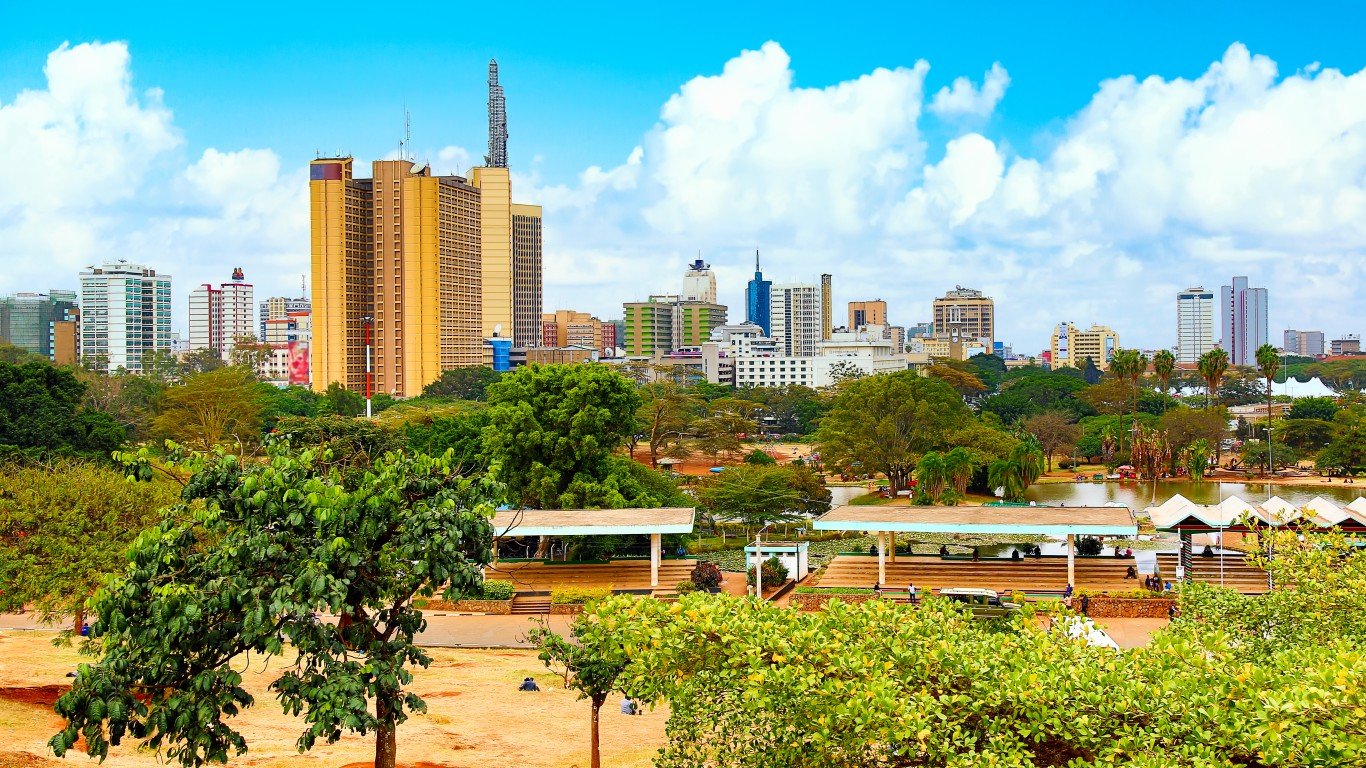
Source: nantonov / iStock via Getty Images
9. Nairobi, Kenya
> Overall score (0-100): 44.8
> Potential sea-level rise impact 2050 (0-100): 1.0 (44th largest impact)
> Avg. annual temperature, 1970-2000: 65.5°F
> Avg. annual temperature, 2050: 69.7°F (30th largest increase)
> Population, 2018: 4,386,000

Source: DenisTangneyJr / iStock via Getty Images
8. Boston, US
> Overall score (0-100): 44.8
> Potential sea-level rise impact 2050 (0-100): 8.2 (21st largest impact)
> Avg. annual temperature, 1970-2000: 50.5°F
> Avg. annual temperature, 2050: 55.2°F (19th largest increase)
> Population, 2018: 4,308,000
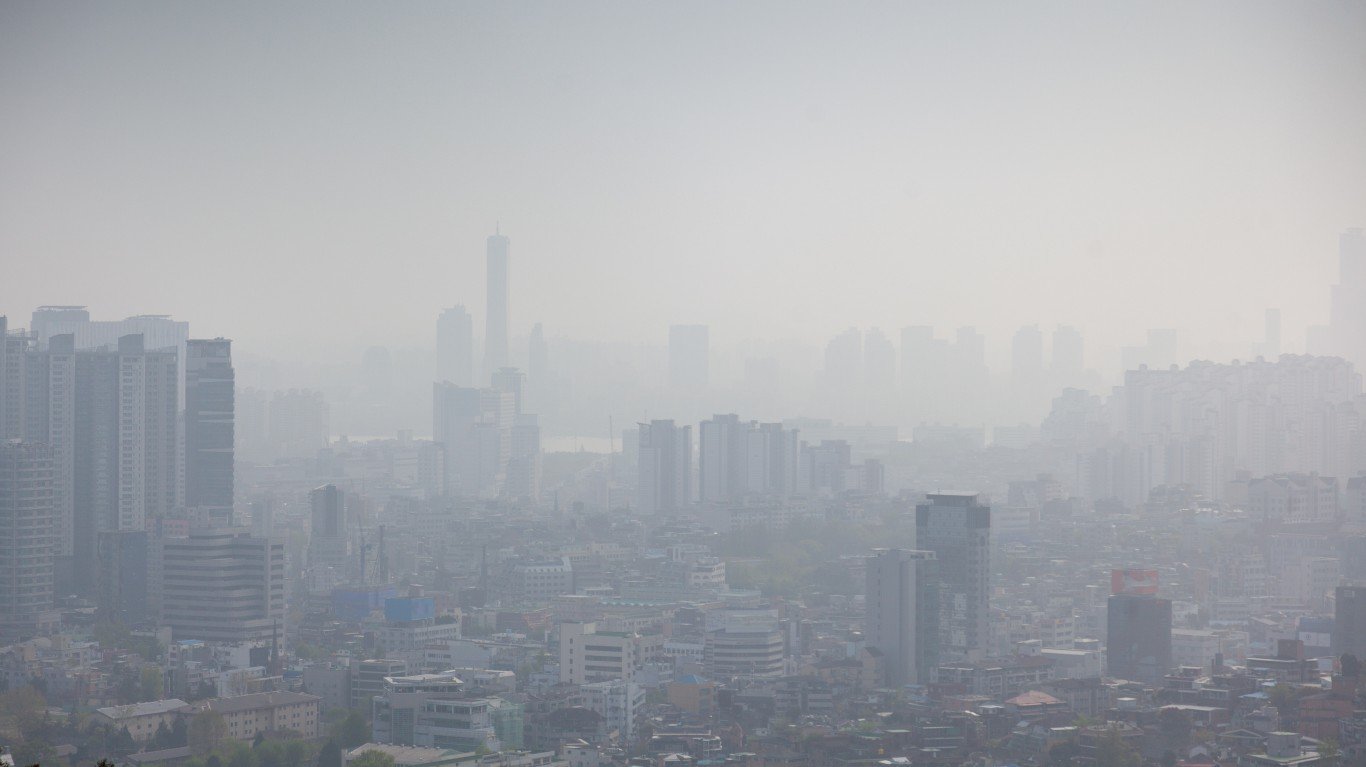
Source: Olezzo / iStock via Getty Images
7. Seoul, South Korea
> Overall score (0-100): 45.8
> Potential sea-level rise impact 2050 (0-100): 6.3 (22nd largest impact)
> Avg. annual temperature, 1970-2000: 54.0°F
> Avg. annual temperature, 2050: 57.8°F (38th largest increase)
> Population, 2018: 9,963,000
[in-text-ad-2]
Source: steved_np3 / iStock via Getty Images
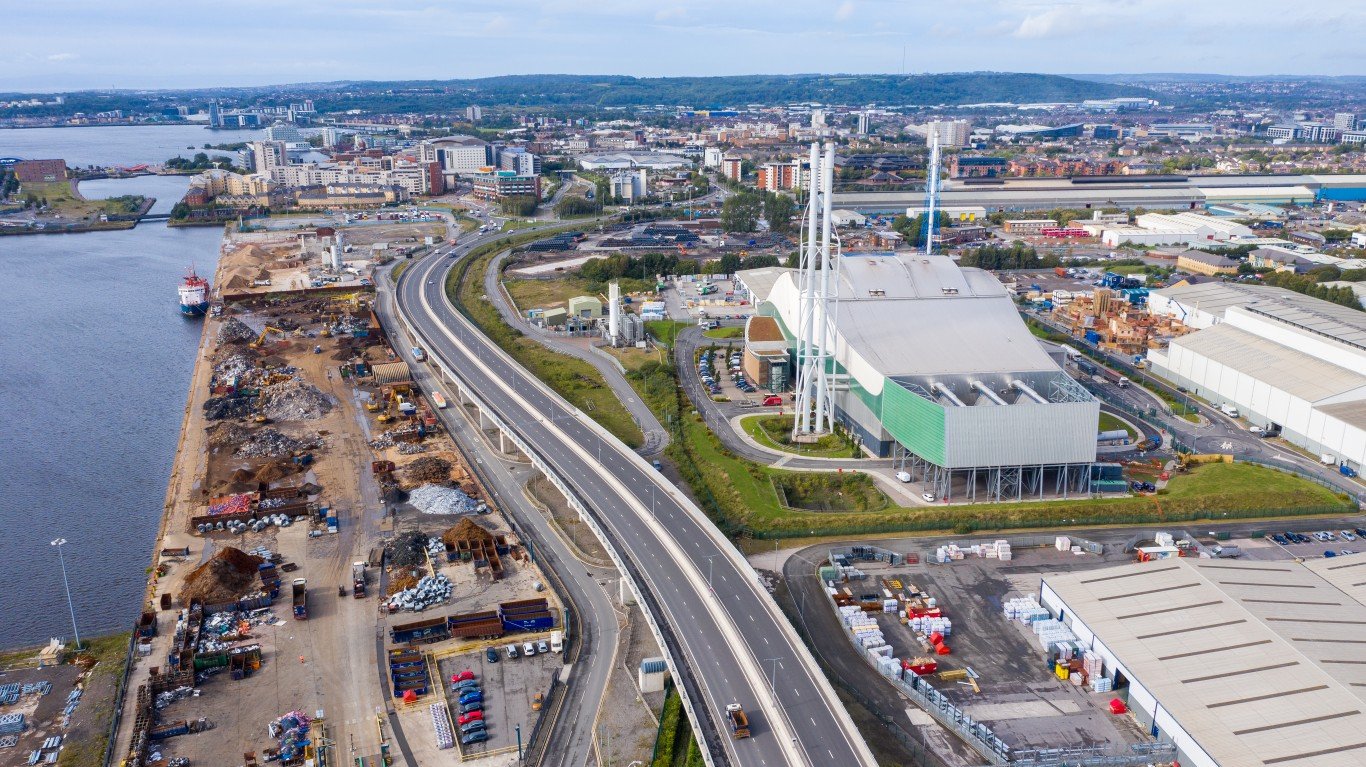
6. Cardiff, UK
> Overall score (0-100): 47.0
> Potential sea-level rise impact 2050 (0-100): 45.9 (4th largest impact)
> Avg. annual temperature, 1970-2000: 50.9°F
> Avg. annual temperature, 2050: 54.0°F (57th largest increase)
> Population, 2018: 471,000

5. Melbourne, Australia
> Overall score (0-100): 49.5
> Potential sea-level rise impact 2050 (0-100): 2.2 (34th largest impact)
> Avg. annual temperature, 1970-2000: 59.6°F
> Avg. annual temperature, 2050: 62.1°F (70th largest increase)
> Population, 2018: 4,771,000
[in-text-ad]
Source: gjp311 / iStock via Getty Images
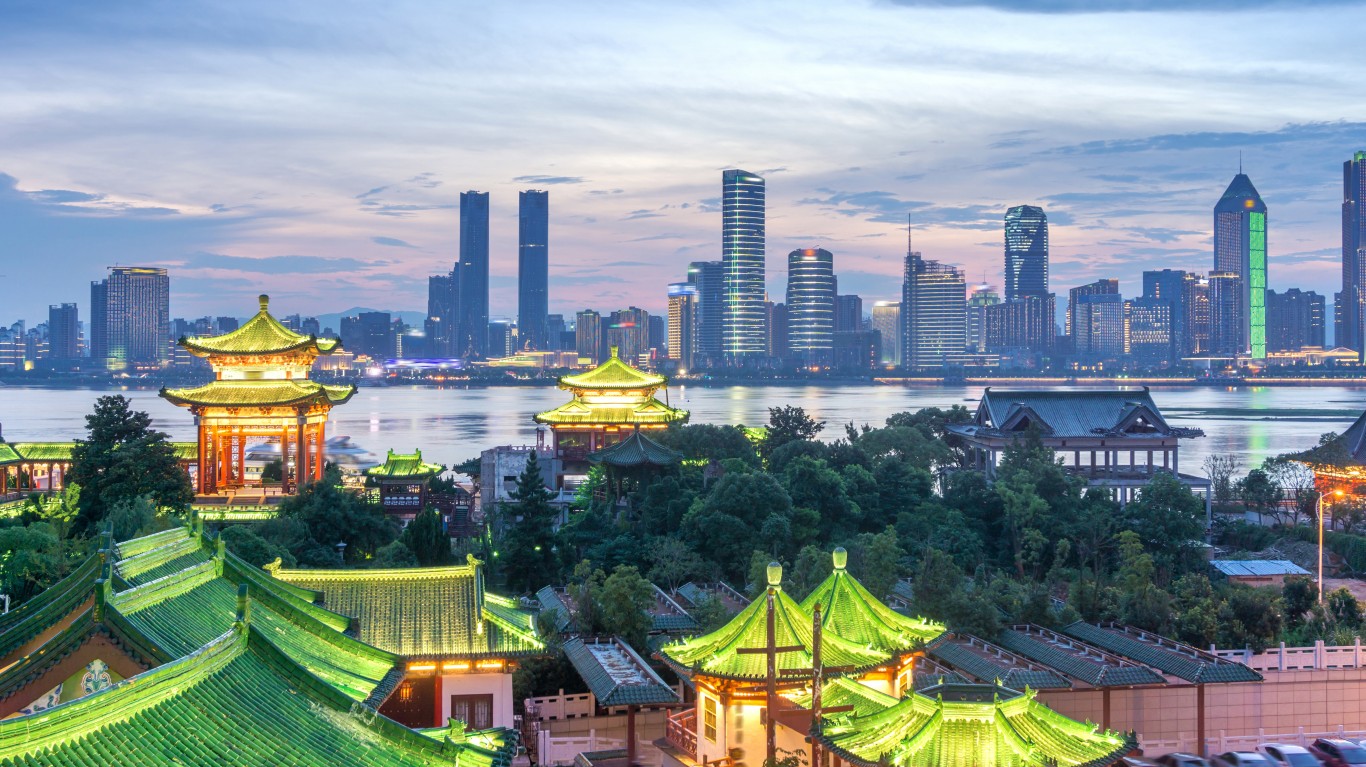
4. Shenzhen, China
> Overall score (0-100): 62.2
> Potential sea-level rise impact 2050 (0-100): 28.1 (8th largest impact)
> Avg. annual temperature, 1970-2000: 73.1°F
> Avg. annual temperature, 2050: 76.5°F (50th largest increase)
> Population, 2018: 11,908,000
Source: AndreyKrav / iStock via Getty Images
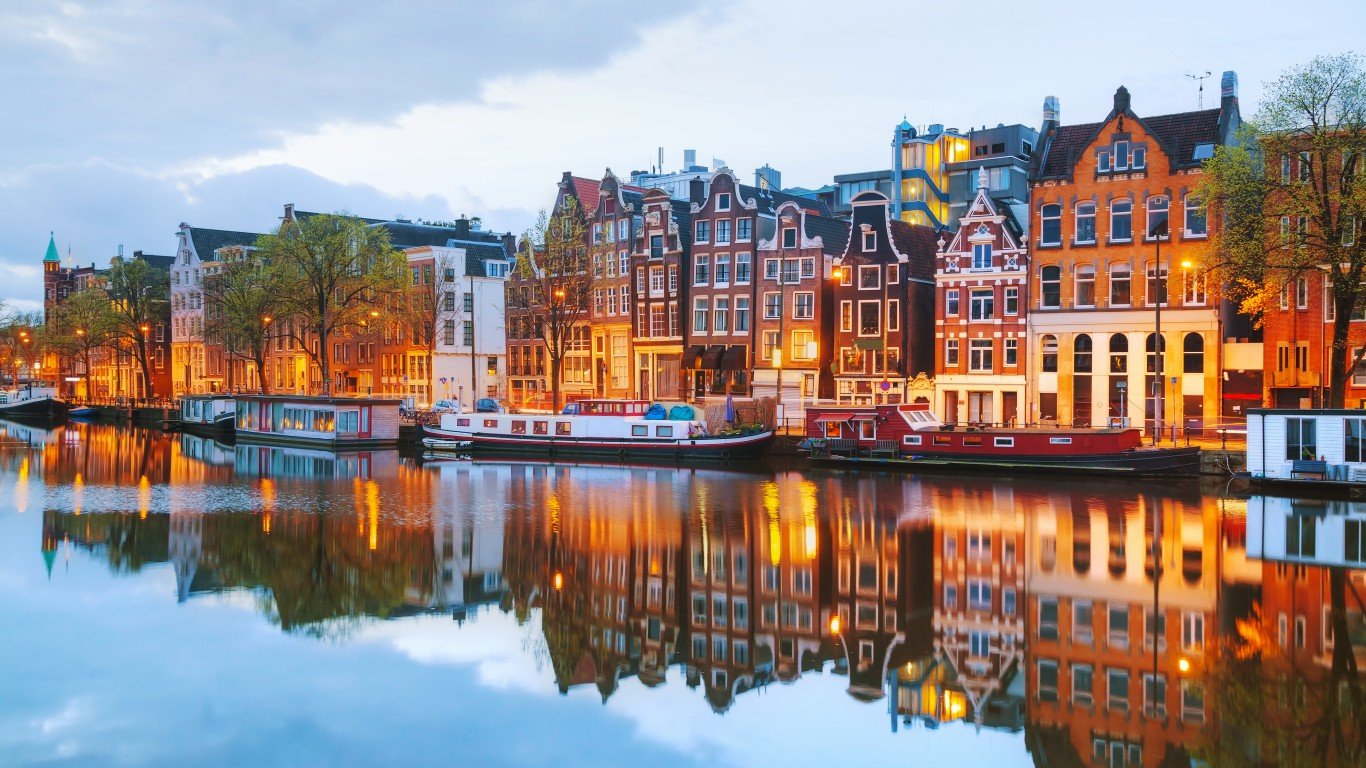
3. Amsterdam, Netherlands
> Overall score (0-100): 84.3
> Potential sea-level rise impact 2050 (0-100): 89.6 (2nd largest impact)
> Avg. annual temperature, 1970-2000: 50.1°F
> Avg. annual temperature, 2050: 52.3°F (76th largest increase)
> Population, 2018: 1,132,000
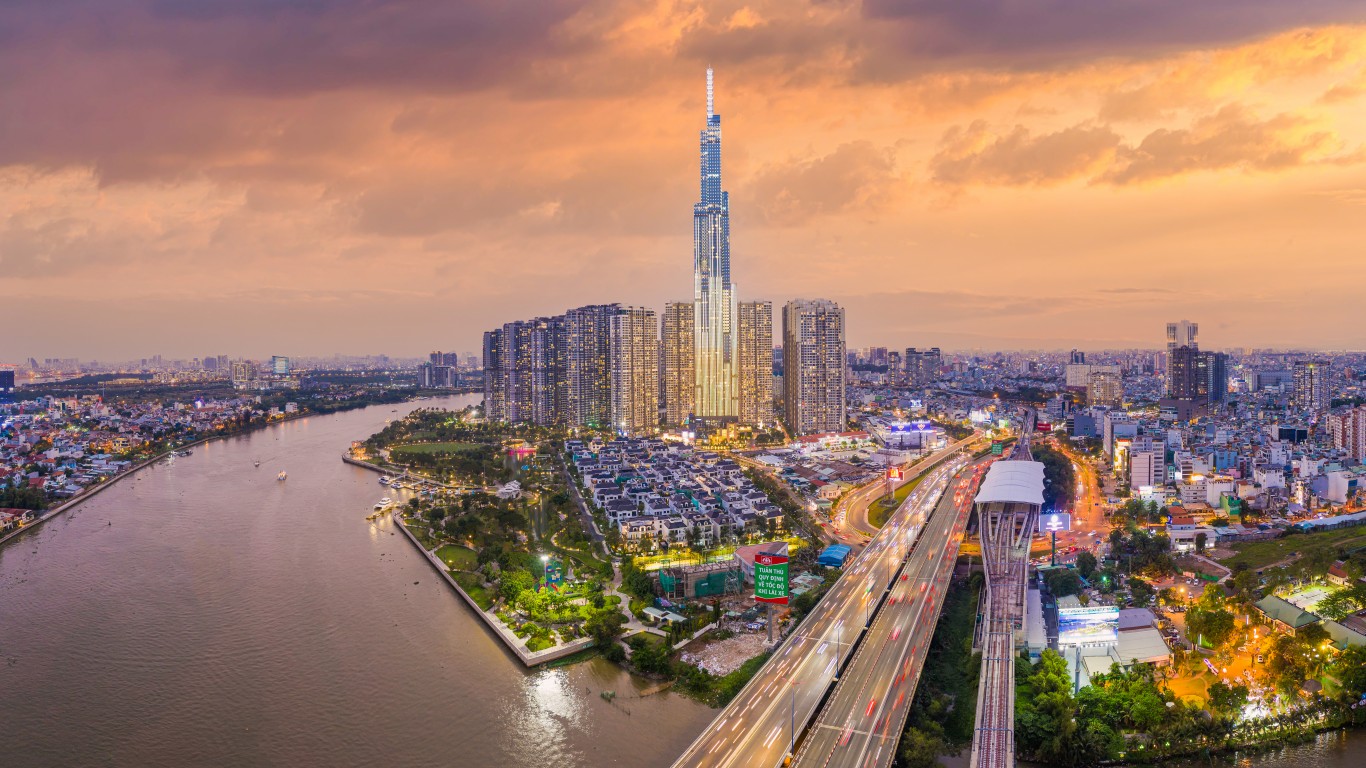
Source: Khoa Nguyen / iStock via Getty Images
2. Ho Chi Minh City, Vietnam
> Overall score (0-100): 85.3
> Potential sea-level rise impact 2050 (0-100): 88.7 (3rd largest impact)
> Avg. annual temperature, 1970-2000: 81.5°F
> Avg. annual temperature, 2050: 84.5°F (58th largest increase)
> Population, 2018: 8,145,000
[in-text-ad-2]
Source: em100s / iStock via Getty Images
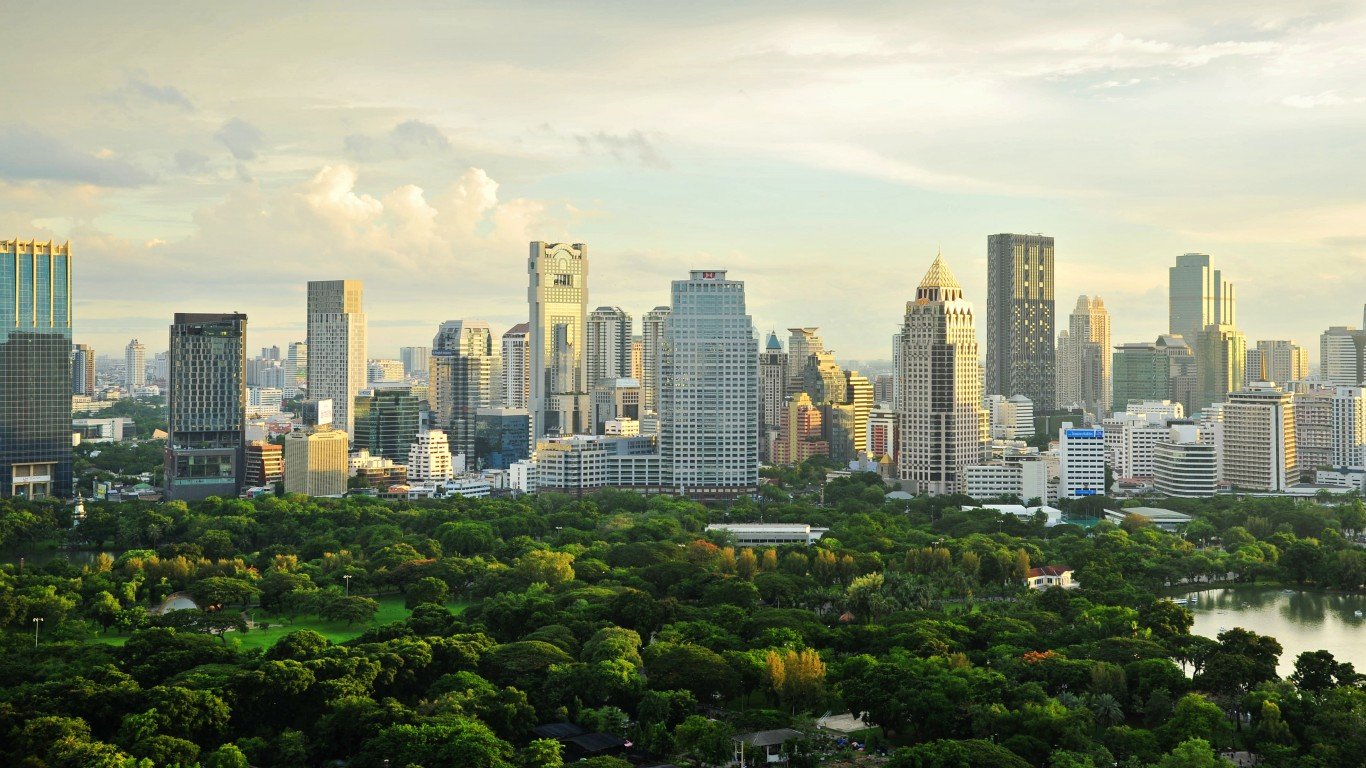
1. Bangkok, Thailand
> Overall score (0-100): 100.0
> Potential sea-level rise impact 2050 (0-100): 100.0 (the largest impact)
> Avg. annual temperature, 1970-2000: 83.1°F
> Avg. annual temperature, 2050: 86.1°F (58th largest increase)
> Population, 2018: 10,156,000
Methodology
To find the 25 popular cities in the world that would be most impacted by climate change in the next 20-30 years, 24/7 Wall St. reviewed a study, 2050 Climate Change City Index, published in Nestpick, a platform for furnished rental apartments. The study includes 85 cities that are top destinations and that had data in research papers used for this report. Each city was rated across three categories: sea-level, climate, and water shortage. Cities are ranked by their total score (out of 100). A score of 100 indicates the most extreme changes in climate over the next three decades.
Potential sea-level rise impact: The higher the score, the higher the potential flooding/sea level impact in that city by 2050. Nestpick used sea-level rise projections of two studies accessed through the Coastal Risk Screening Tool provided by Climate Analytics.
The climate category includes: temperature baseline (1970 – 2000), temperature 2050, temperature shift, climate type 2021, climate type 2051, climate shift. Nestpick’s sources were the studies, “Understanding Climate Change From A Global Analysis Of City Analogues” and “Koppen-Geiger Observed and Predicted Climate Shifts” projections via ArcGIS.
The water shortage category includes water shortage 2020 (demand vs. supply ratio), water shortage 2040, water shortage relative change (%), water stress increase (score). Nestpick’s sources for this are the Aqueduct Water Risk Atlas or when unavailable other sources.
24/7 Wall St. added population data from the U.N.’s World Urbanization Prospects 2018. Population figures are for urban agglomerations (the contiguous urban area, or built-up area).
Sponsored: Attention Savvy Investors: Speak to 3 Financial Experts – FREE
Ever wanted an extra set of eyes on an investment you’re considering? Now you can speak with up to 3 financial experts in your area for FREE. By simply
clicking here you can begin to match with financial professionals who can help guide you through the financial decisions you’re making. And the best part? The first conversation with them is free.
Click here to match with up to 3 financial pros who would be excited to help you make financial decisions.
Thank you for reading! Have some feedback for us?
Contact the 24/7 Wall St. editorial team.
Editors' Picks