Disparities in school spending has been a point of contention in the American public education system for decades. Because public schools typically receive the bulk of their funding from local sources such as property taxes, wealthy districts are often better funded than poorer ones.
Though the relationship between school spending and student outcomes is controversial, studies have shown that higher per-pupil spending correlates with a range of improved outcomes – including a reduced likelihood of poverty in adulthood. (Here is a look at the worst school district in each state.)
Still, there are countless variables – both inside the classroom and outside of it – that can impact a student’s likelihood of success. One of them is financial security at home.
A recent report published by the Georgetown Center on Education and the Workforce found that children from low-income households who receive high scores on standardized aptitude tests in kindergarten have only a 3 in 10 chance of graduating from college and landing a good entry-level job as a young adult. Meanwhile, children from well-off families who score poorly on the same tests have a 7 in 10 chance. For students from low-income families, setbacks can be more difficult to recover from due to limited supporting resources.
This study suggests that even if per-pupil spending were equal across the thousands of school districts in the United States, students in high-income areas would still have a considerable advantage. Using data from the U.S. Census Bureau and National Center for Education Statistics, 24/7 Wall St. identified the richest school districts in each state. School districts are ranked by average household income in the district, and only districts with at least 100 students and income data were considered.
Among the districts on this list, average annual household income ranges from $90,500 to over $450,000. In the majority of these school districts, graduation rates are 90% or higher.
Notably, despite a strong tax base, per-pupil spending among these districts is not always especially high. Due in part to federal and state subsidy programs that help equalize school funding, per-pupil spending in just under half of the districts on this list falls below the comparable statewide average. (Here is a look at how much each state spends on its public schools.)
Click here to see the richest school district in every state.
Click here to see our detailed methodology.
Source: Public Domain / Wikimedia Commons
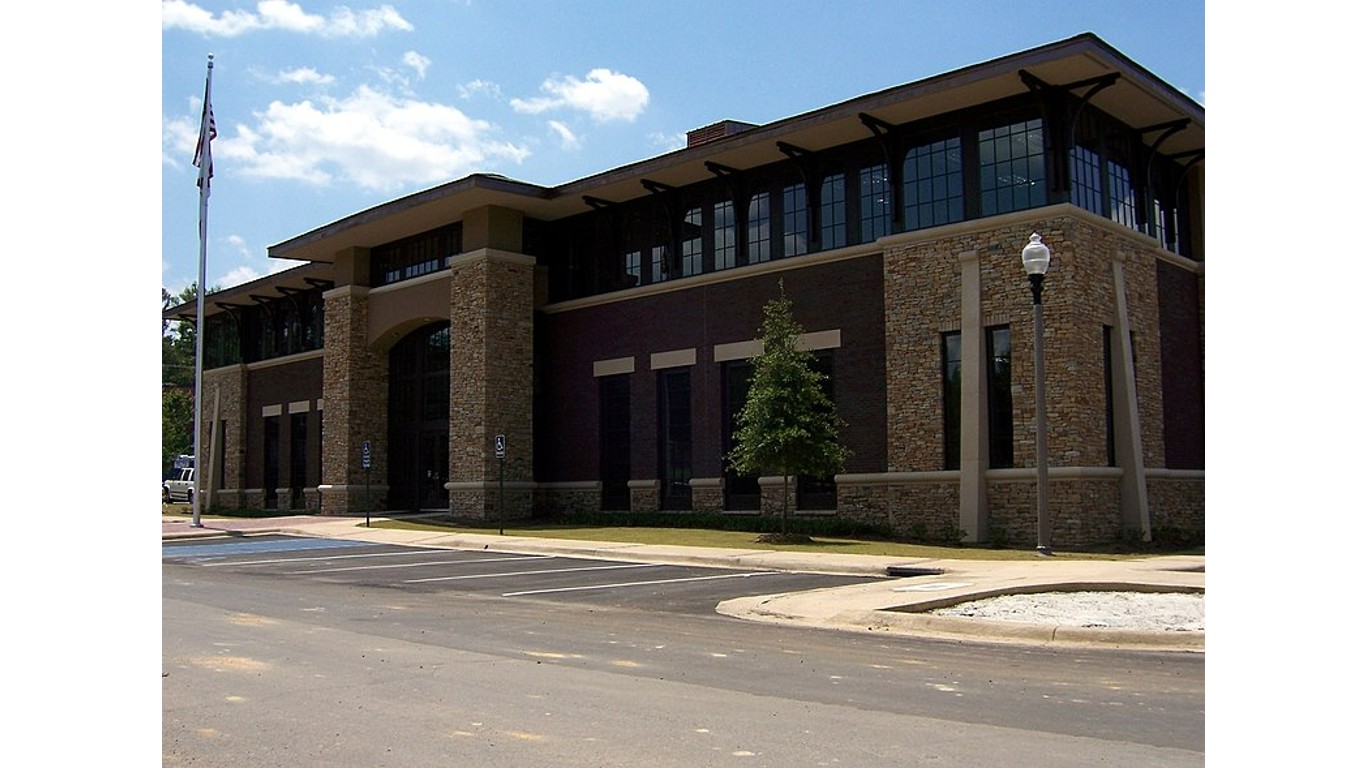
Alabama: Mountain Brook City
> Avg. household income: $238,595 (Alabama: $71,964)
> District graduation rate: 98%
> Annual per pupil spending: $14,059 (Alabama: $10,107)
> Student-teacher ratio: 14:1 (Alabama: 18:1)
> District location: Jefferson County
> Total operational school districts in Alabama: 177
[in-text-ad]
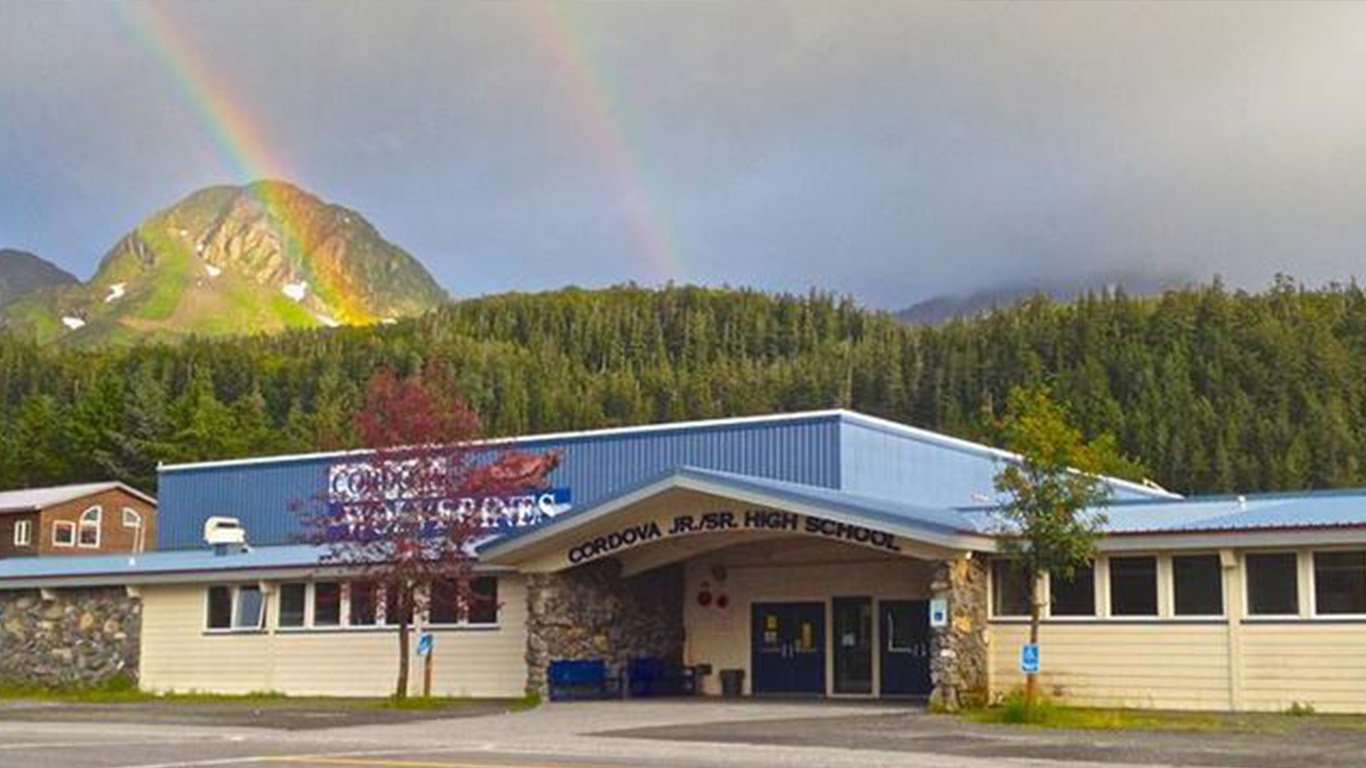
Source: Cordova Junior-Senior High School / Facebook
Alaska: Cordova City School District
> Avg. household income: $112,521 (Alaska: $98,811)
> District graduation rate: 85%
> Annual per pupil spending: $20,803 (Alaska: $18,393)
> Student-teacher ratio: 15:1 (Alaska: 17:1)
> District location: Valdez-Cordova Census Area
> Total operational school districts in Alaska: 54
 24/7 Wall St.
Source: Courtesy of Cave Creek Unified District via Facebook
Arizona: Cave Creek Unified District
> Avg. household income: $162,758 (Arizona: $84,380)
> District graduation rate: 94%
> Annual per pupil spending: $7,741 (Arizona: $8,773)
> Student-teacher ratio: 23:1 (Arizona: 24:1)
> District location: Maricopa County
> Total operational school districts in Arizona: 705

Source: Courtesy of Valley View School District via Facebook
Arkansas: Valley View School District
> Avg. household income: $124,059 (Arkansas: $69,357)
> District graduation rate: 95%
> Annual per pupil spending: $8,939 (Arkansas: $10,412)
> Student-teacher ratio: 15:1 (Arkansas: 13:1)
> District location: Craighead County
> Total operational school districts in Arkansas: 294
[in-text-ad-2]
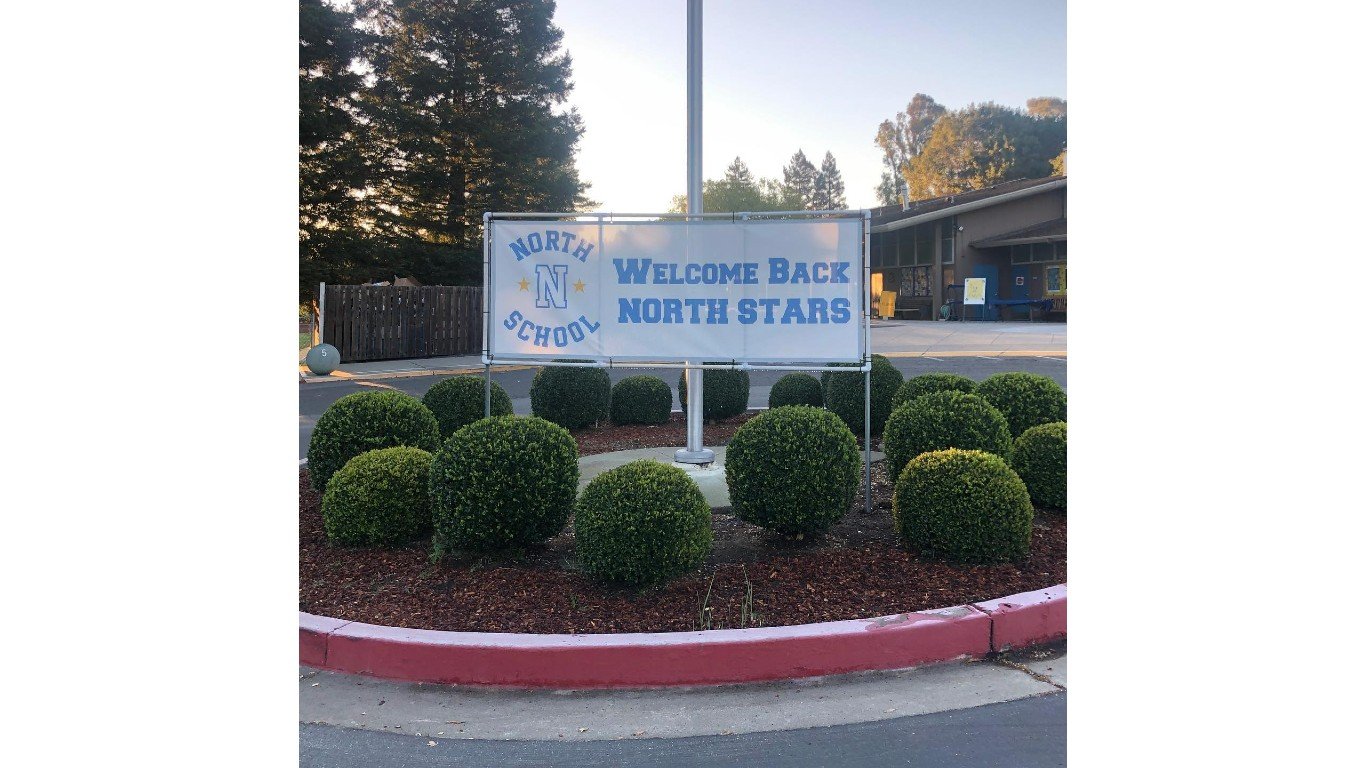
Source: Courtesy of Hillsborough City Elementary via Facebook
California: Hillsborough City Elementary
> Avg. household income: $437,655 (California: $111,622)
> District graduation rate: N/A
> Annual per pupil spending: $22,821 (California: $13,831)
> Student-teacher ratio: 17:1 (California: 23:1)
> District location: San Mateo County
> Total operational school districts in California: 2,170
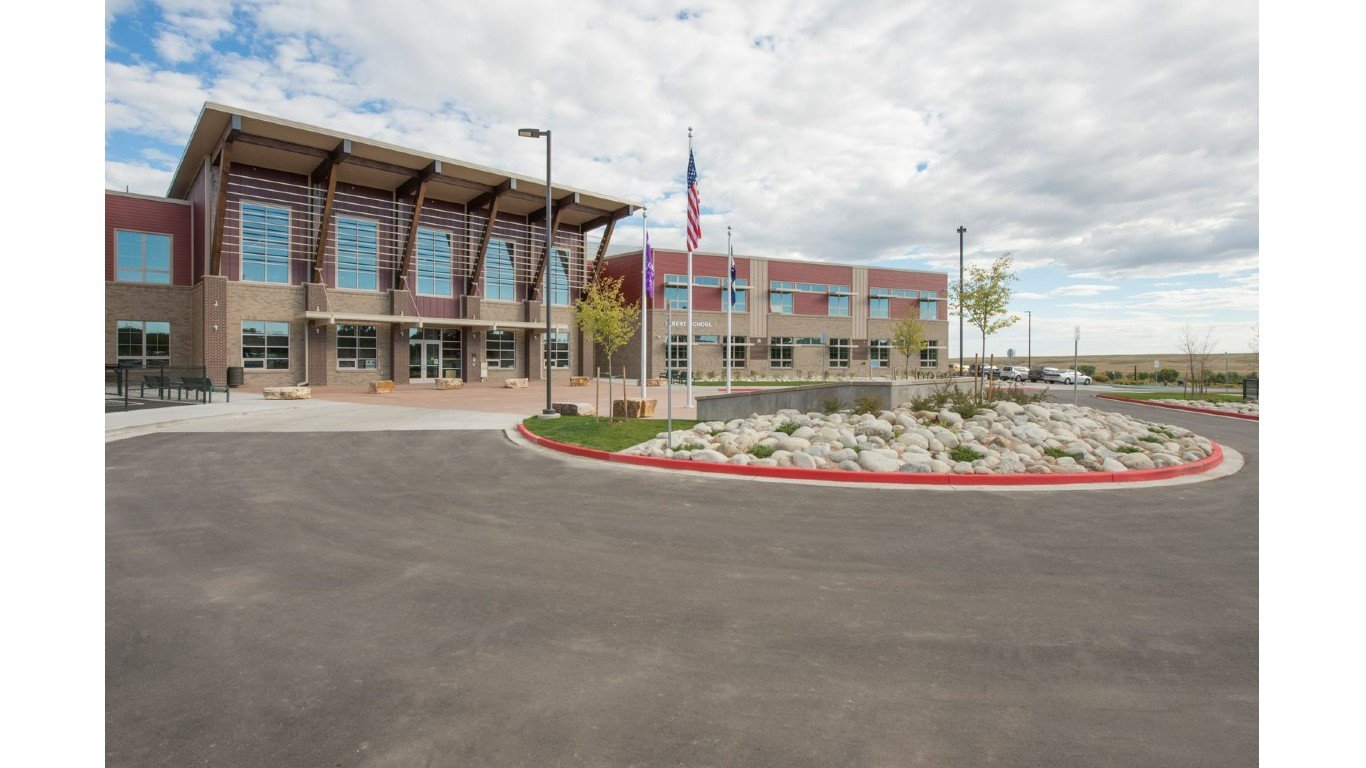
Source: Courtesy of Elbert School District No. 200 via Facebook
Colorado: Elbert School District No. 200
> Avg. household income: $97,038 (Colorado: $100,933)
> District graduation rate: N/A
> Annual per pupil spending: $12,160 (Colorado: $11,072)
> Student-teacher ratio: 11:1 (Colorado: 17:1)
> District location: Elbert County
> Total operational school districts in Colorado: 270
[in-text-ad]
Source: Courtesy of Darien Public School District
Connecticut: Darien School District
> Avg. household income: $365,528 (Connecticut: $115,337)
> District graduation rate: 98%
> Annual per pupil spending: $23,673 (Connecticut: $21,140)
> Student-teacher ratio: 11:1 (Connecticut: 12:1)
> District location: Fairfield County
> Total operational school districts in Connecticut: 204
 24/7 Wall St.
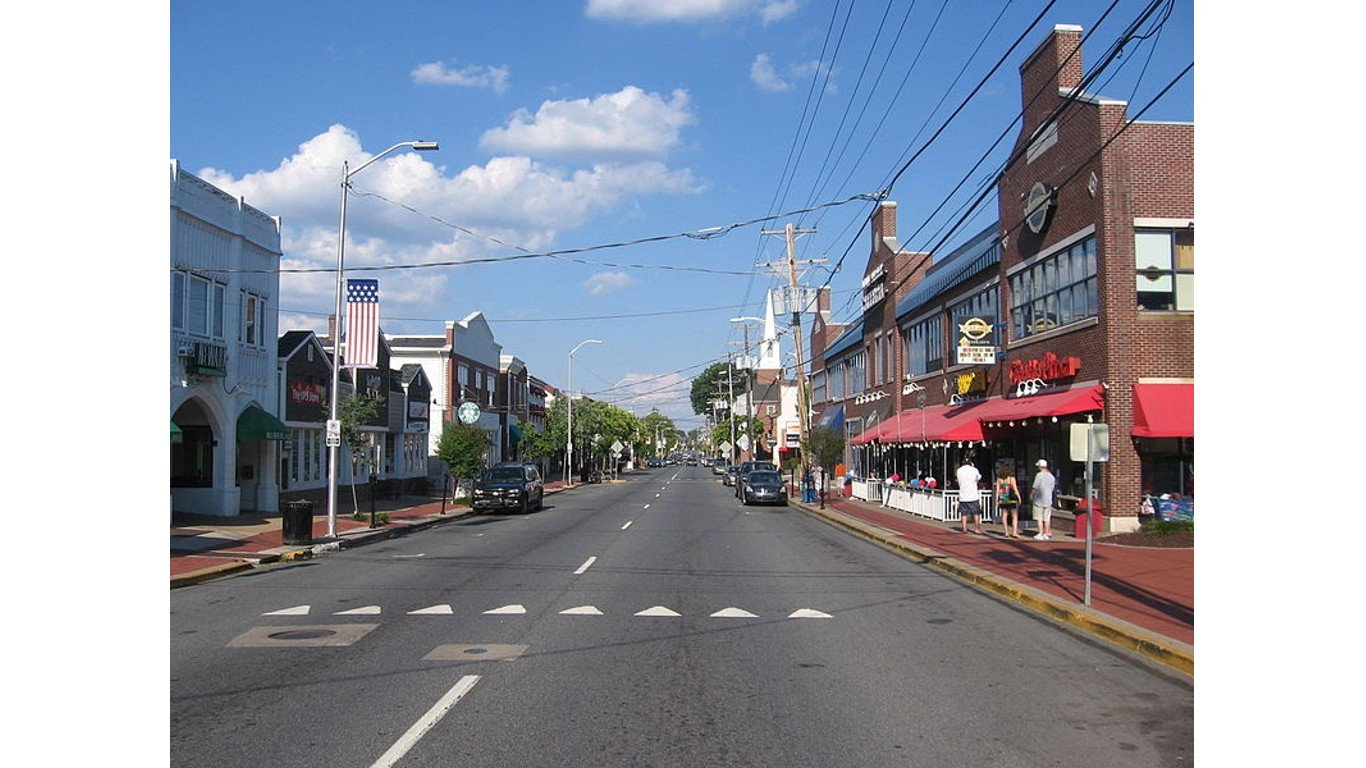
Source: Public Domain / Wikimedia Commons
Delaware: Appoquinimink School District
> Avg. household income: $125,597 (Delaware: $92,308)
> District graduation rate: 95%
> Annual per pupil spending: $13,286 (Delaware: $15,929)
> Student-teacher ratio: 16:1 (Delaware: 14:1)
> District location: New Castle County
> Total operational school districts in Delaware: 46

Florida: St. Johns
> Avg. household income: $113,475 (Florida: $83,104)
> District graduation rate: 94%
> Annual per pupil spending: $8,661 (Florida: $9,986)
> Student-teacher ratio: 18:1 (Florida: 17:1)
> District location: St. Johns County
> Total operational school districts in Florida: 76
[in-text-ad-2]
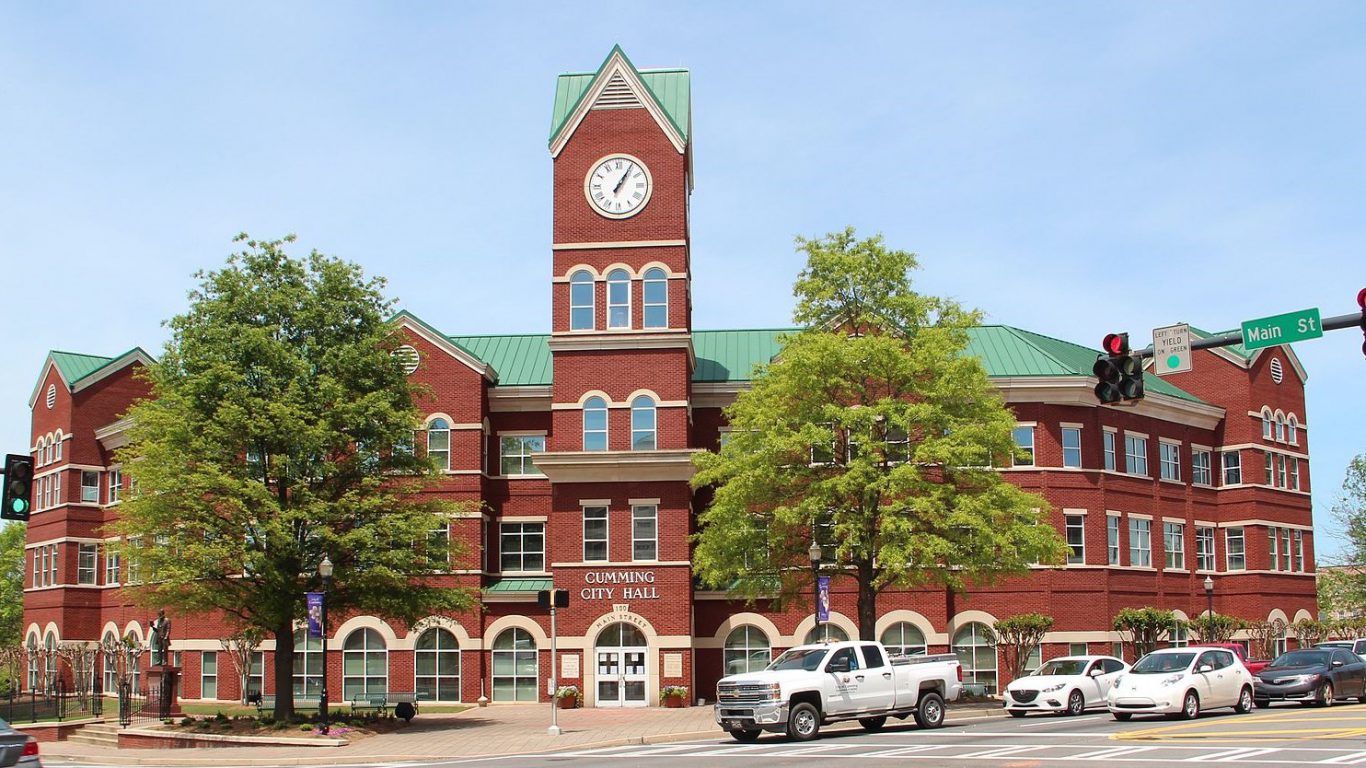
Source: Thomson200 / Wikimedia Commons / Public Domain
Georgia: Forsyth County
> Avg. household income: $128,476 (Georgia: $85,691)
> District graduation rate: 95%
> Annual per pupil spending: $9,884 (Georgia: $11,203)
> Student-teacher ratio: 16:1 (Georgia: 15:1)
> District location: Forsyth County
> Total operational school districts in Georgia: 232

Source: Public Domain / Wikimedia Commons
Hawaii: Hawaii Department Of Education
> Avg. household income: $103,780 (Hawaii: $107,348)
> District graduation rate: 85%
> Annual per pupil spending: $16,132 (Hawaii: $16,132)
> Student-teacher ratio: 15:1 (Hawaii: 15:1)
> District location: Statewide
> Total operational school districts in Hawaii: 1
[in-text-ad]

Source: Public Domain / Wikimedia Commons
Idaho: Mccall-Donnelly Joint School District
> Avg. household income: $90,524 (Idaho: $77,399)
> District graduation rate: 92%
> Annual per pupil spending: $10,924 (Idaho: $8,043)
> Student-teacher ratio: 16:1 (Idaho: 19:1)
> District location: Valley County
> Total operational school districts in Idaho: 168
 24/7 Wall St.
Source: Courtesy of Winnetka School District No. 36 via Facebook
Illinois: Winnetka School District No. 36
> Avg. household income: $371,021 (Illinois: $95,115)
> District graduation rate: N/A
> Annual per pupil spending: $27,769 (Illinois: $16,281)
> Student-teacher ratio: 10:1 (Illinois: 15:1)
> District location: Cook County
> Total operational school districts in Illinois: 1,056
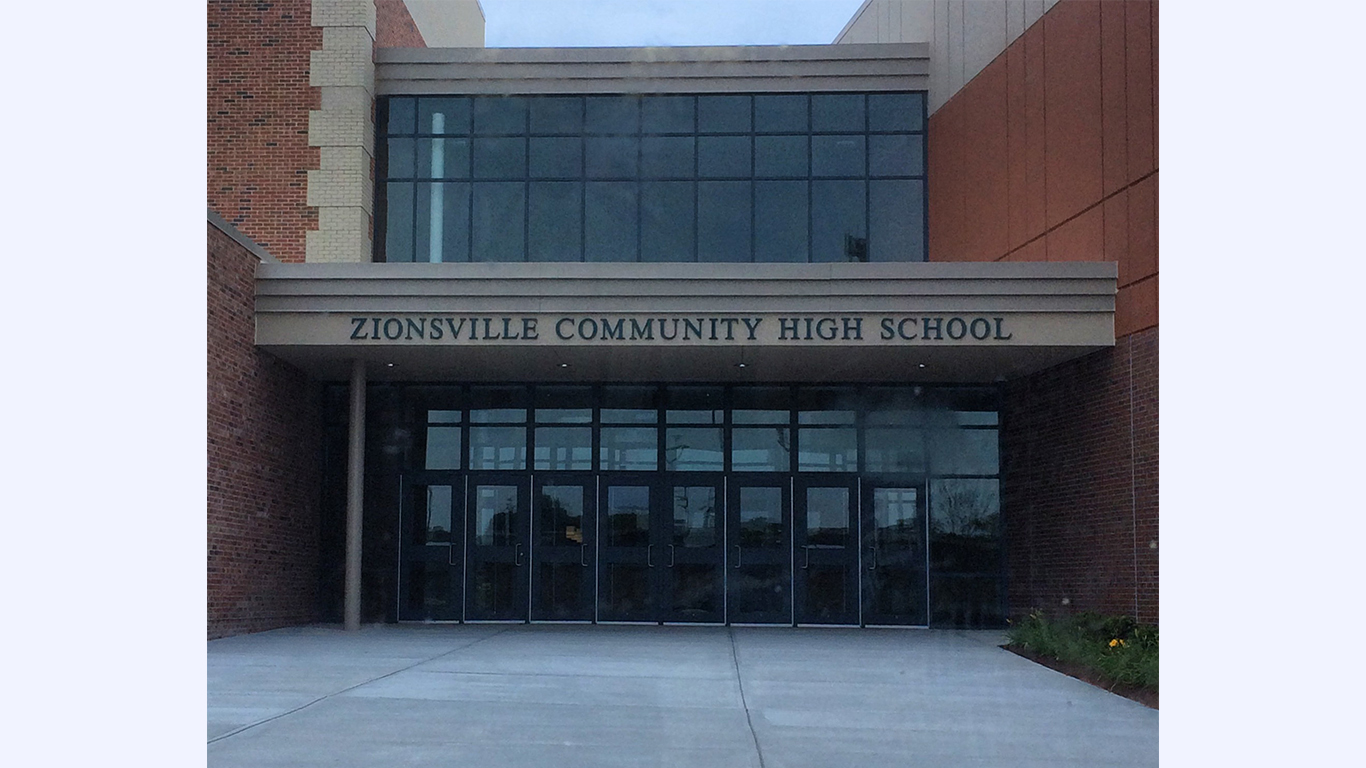
Source: Isaac Spillman / Wikimedia Commons
Indiana: Zionsville Community Schools
> Avg. household income: $174,109 (Indiana: $76,984)
> District graduation rate: 97%
> Annual per pupil spending: $9,380 (Indiana: $10,252)
> Student-teacher ratio: 18:1 (Indiana: 17:1)
> District location: Boone County
> Total operational school districts in Indiana: 431
[in-text-ad-2]

Source: Courtesy of Sergeant Bluff-Luton Community School District via Facebook
Iowa: Sergeant Bluff-Luton Community School District
> Avg. household income: $115,226 (Iowa: $80,316)
> District graduation rate: 95%
> Annual per pupil spending: $10,984 (Iowa: $11,933)
> Student-teacher ratio: 16:1 (Iowa: 14:1)
> District location: Woodbury County
> Total operational school districts in Iowa: 339

Kansas: Spring Hill
> Avg. household income: $121,345 (Kansas: $82,103)
> District graduation rate: 61%
> Annual per pupil spending: $8,890 (Kansas: $11,328)
> Student-teacher ratio: 17:1 (Kansas: 14:1)
> District location: Miami County
> Total operational school districts in Kansas: 311
[in-text-ad]

Kentucky: Oldham County
> Avg. household income: $128,725 (Kentucky: $72,318)
> District graduation rate: 97%
> Annual per pupil spending: $10,076 (Kentucky: $11,280)
> Student-teacher ratio: 17:1 (Kentucky: 16:1)
> District location: Oldham County
> Total operational school districts in Kentucky: 186
 24/7 Wall St.
Source: Kruck20 / iStock via Getty Images
Louisiana: District level income not available
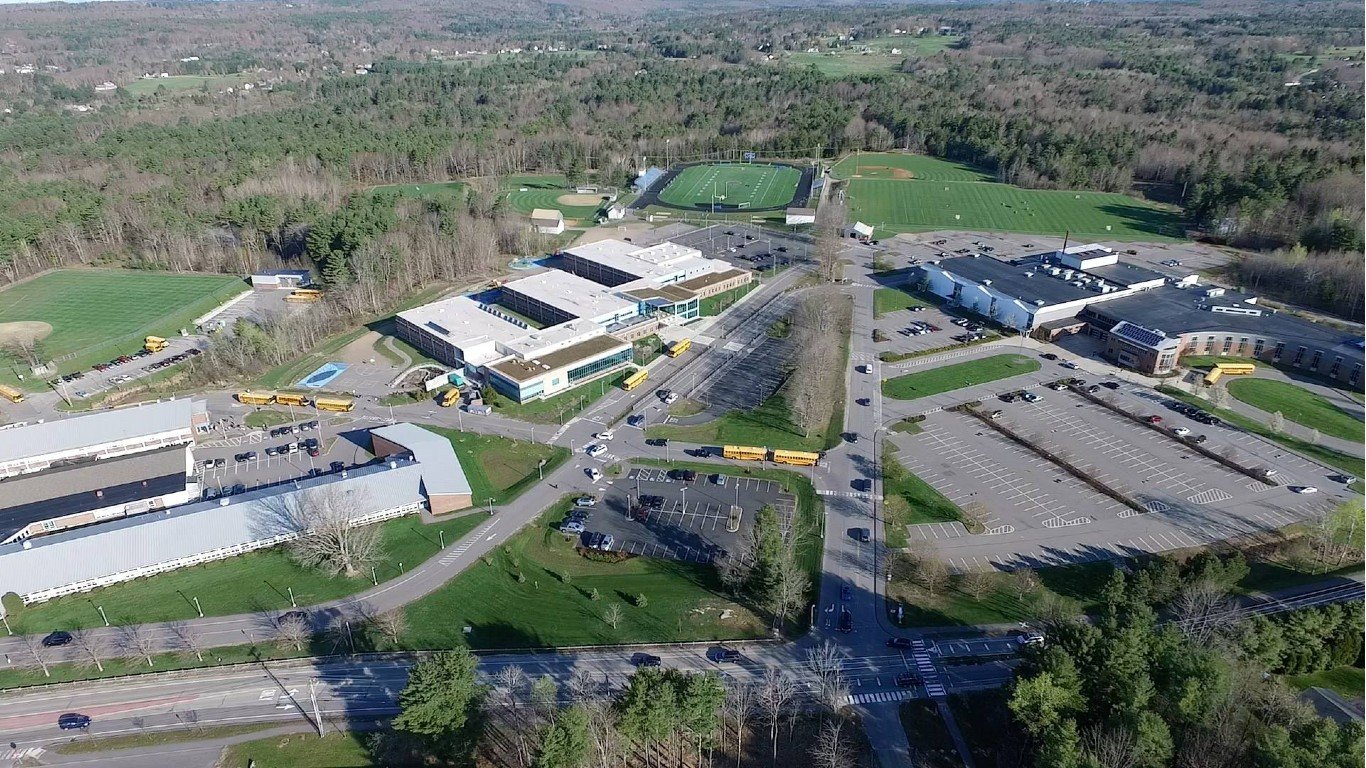
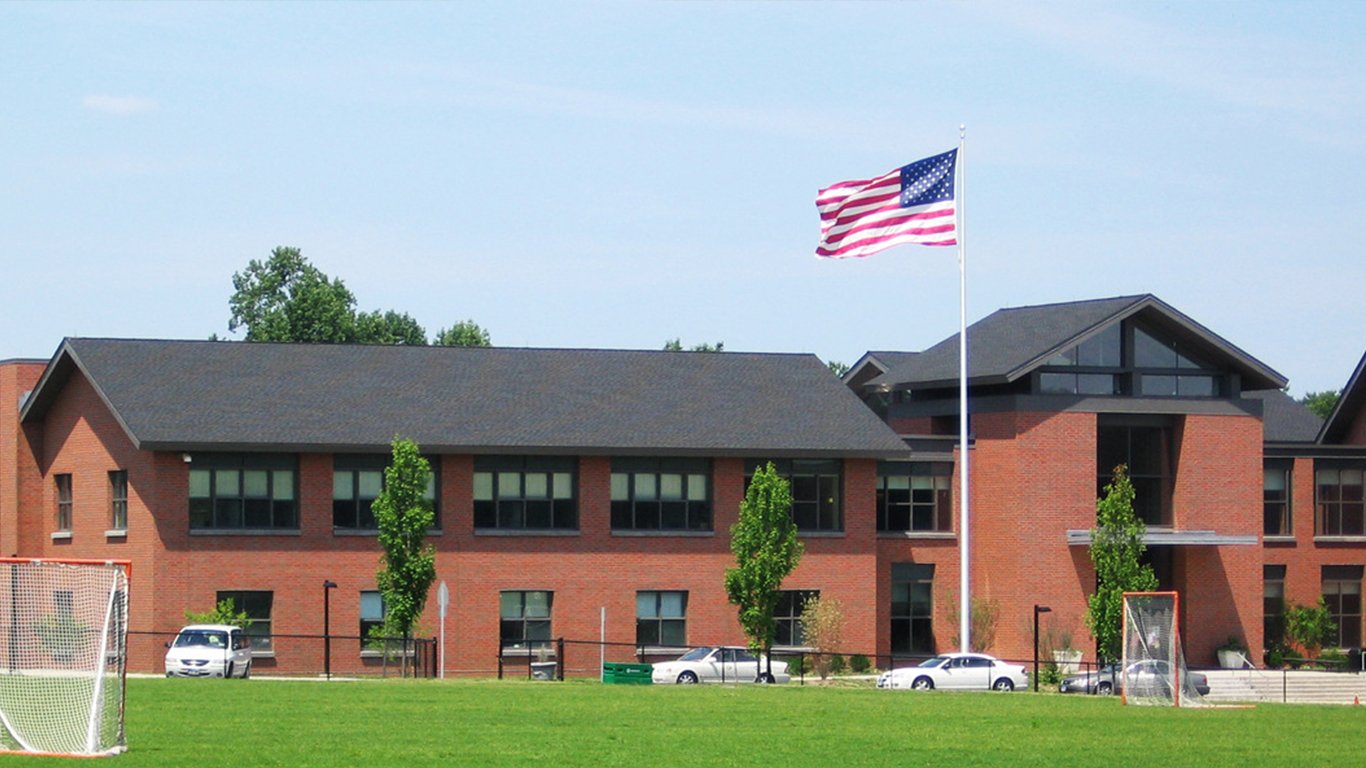
Source: Courtesy of Falmouth Public Schools via Facebook
Maine: Falmouth Public Schools
> Avg. household income: $170,467 (Maine: $78,301)
> District graduation rate: 87%
> Annual per pupil spending: $16,611 (Maine: $15,686)
> Student-teacher ratio: 12:1 (Maine: 12:1)
> District location: Cumberland County
> Total operational school districts in Maine: 276
[in-text-ad-2]

Source: Chip Somodevilla / Getty Images News via Getty Images
Maryland: Montgomery County Public Schools
> Avg. household income: $149,437 (Maryland: $114,236)
> District graduation rate: 89%
> Annual per pupil spending: $16,490 (Maryland: $15,576)
> Student-teacher ratio: 15:1 (Maryland: 15:1)
> District location: Montgomery County
> Total operational school districts in Maryland: 25

Massachusetts: Dover
> Avg. household income: $373,970 (Massachusetts: $115,964)
> District graduation rate: 92% (Dover-Sherborn Schools)
> Annual per pupil spending: $21,018 (Massachusetts: $19,196)
> Student-teacher ratio: 12:1 (Massachusetts: 13:1)
> District location: Norfolk County
> Total operational school districts in Massachusetts: 432
[in-text-ad]

Source: OlegAlbinsky / iStock Unreleased via Getty Images
Michigan: Bloomfield Hills Schools
> Avg. household income: $202,722 (Michigan: $80,803)
> District graduation rate: 94%
> Annual per pupil spending: $18,614 (Michigan: $12,052)
> Student-teacher ratio: 14:1 (Michigan: 18:1)
> District location: Oakland County
> Total operational school districts in Michigan: 895
 24/7 Wall St.
Source: Courtesy of Orono Public Schools via Facebook
Minnesota: Orono Public School District
> Avg. household income: $211,325 (Minnesota: $96,814)
> District graduation rate: 97%
> Annual per pupil spending: $12,837 (Minnesota: $13,297)
> Student-teacher ratio: 16:1 (Minnesota: 15:1)
> District location: Hennepin County
> Total operational school districts in Minnesota: 564

Source: Courtesy of Madison County Schools via Facebook
Mississippi: Madison County School District
> Avg. household income: $112,066 (Mississippi: $65,156)
> District graduation rate: 91%
> Annual per pupil spending: $9,653 (Mississippi: $9,253)
> Student-teacher ratio: 14:1 (Mississippi: 15:1)
> District location: Madison County
> Total operational school districts in Mississippi: 155
[in-text-ad-2]
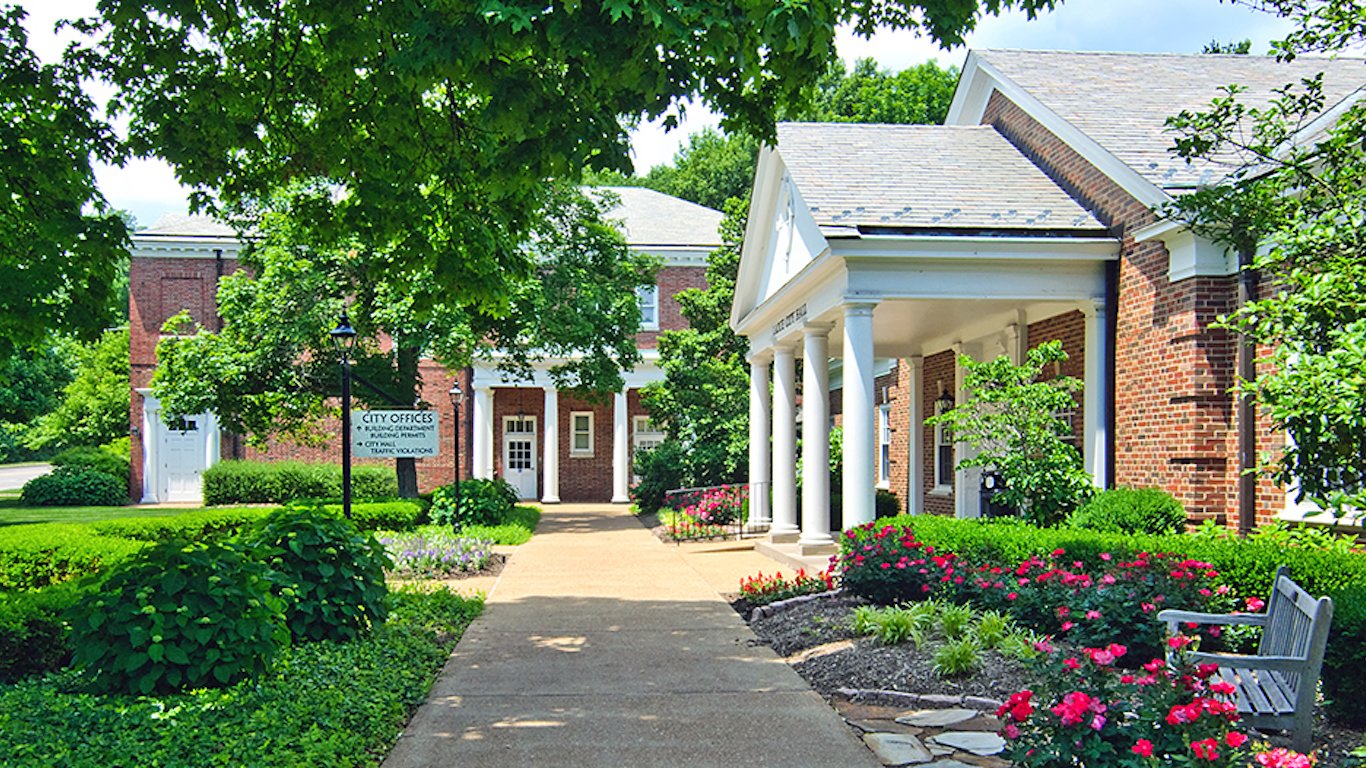
Source: Courtesy of the City of Ladue, Missouri
Missouri: Ladue
> Avg. household income: $213,970 (Missouri: $78,194)
> District graduation rate: 99%
> Annual per pupil spending: $14,289 (Missouri: $11,349)
> Student-teacher ratio: 13:1 (Missouri: 13:1)
> District location: St. Louis County
> Total operational school districts in Missouri: 564
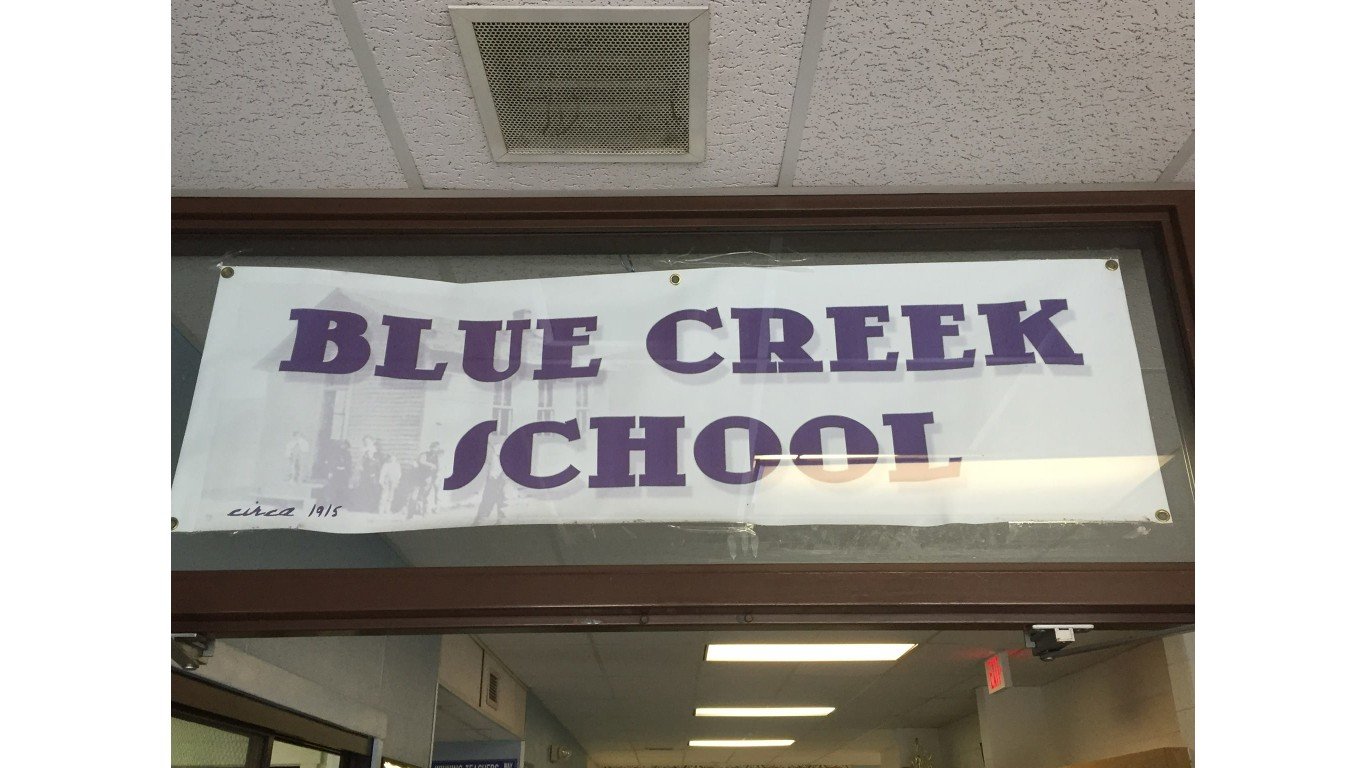
Source: Courtesy of Blue Creek PTA via Facebook
Montana: Blue Creek Elementary
> Avg. household income: $114,007 (Montana: $76,834)
> District graduation rate: N/A
> Annual per pupil spending: $8,557 (Montana: $11,984)
> Student-teacher ratio: 13:1 (Montana: 14:1)
> District location: Yellowstone County
> Total operational school districts in Montana: 487
[in-text-ad]

Source: Courtesy of Elkhorn Public Schools via Facebook
Nebraska: Elkhorn Public Schools
> Avg. household income: $142,333 (Nebraska: $82,306)
> District graduation rate: 97%
> Annual per pupil spending: $9,672 (Nebraska: $12,746)
> Student-teacher ratio: 16:1 (Nebraska: 14:1)
> District location: Douglas County
> Total operational school districts in Nebraska: 279

Source: Courtesy of Storey County School District via Facebook
Nevada: Storey County School District
> Avg. household income: $92,393 (Nevada: $84,350)
> District graduation rate: 85%
> Annual per pupil spending: $19,376 (Nevada: $9,126)
> Student-teacher ratio: 12:1 (Nevada: 21:1)
> District location: Storey County
> Total operational school districts in Nevada: 21
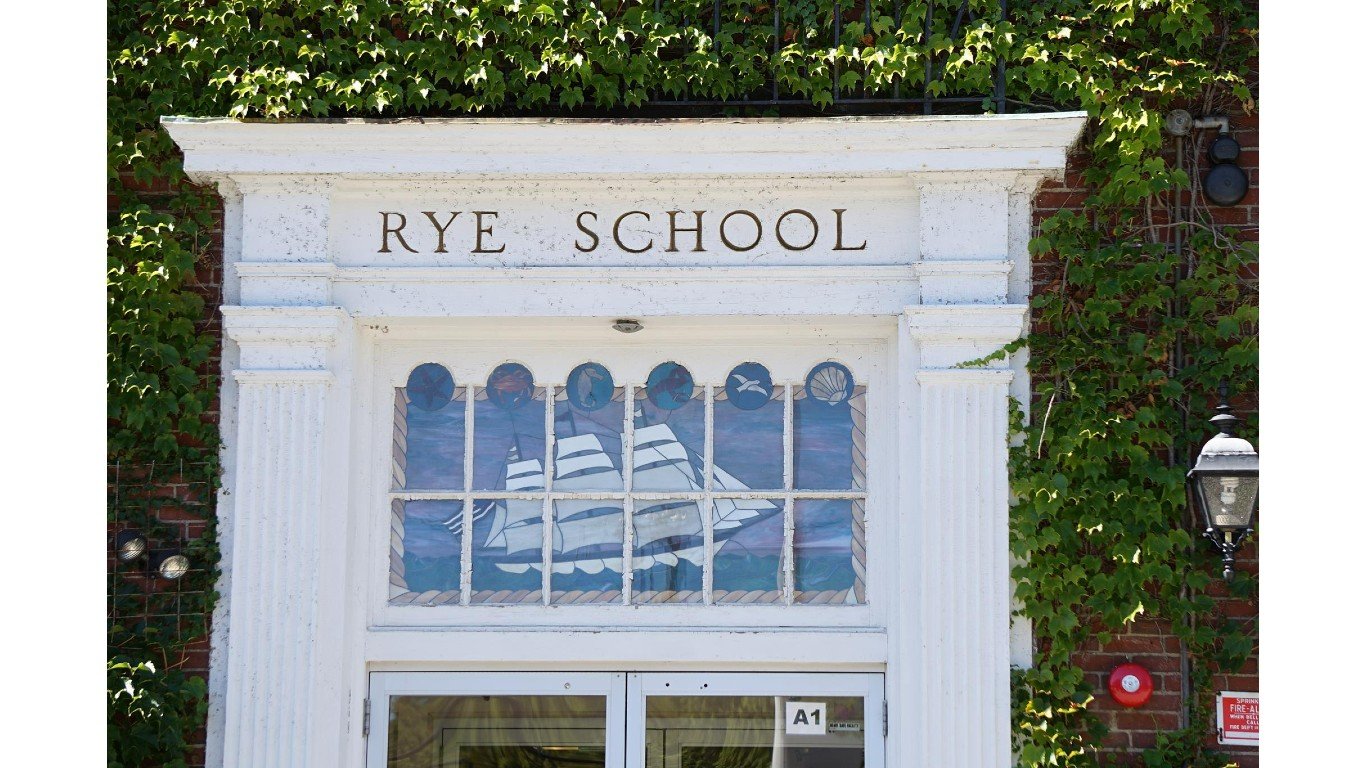
Source: Courtesy of Rye School District via Facebook
New Hampshire: Rye School District
> Avg. household income: $198,028 (New Hampshire: $101,292)
> District graduation rate: N/A
> Annual per pupil spending: $25,870 (New Hampshire: $17,457)
> Student-teacher ratio: 9:1 (New Hampshire: 12:1)
> District location: Rockingham County
> Total operational school districts in New Hampshire: 308
[in-text-ad-2]
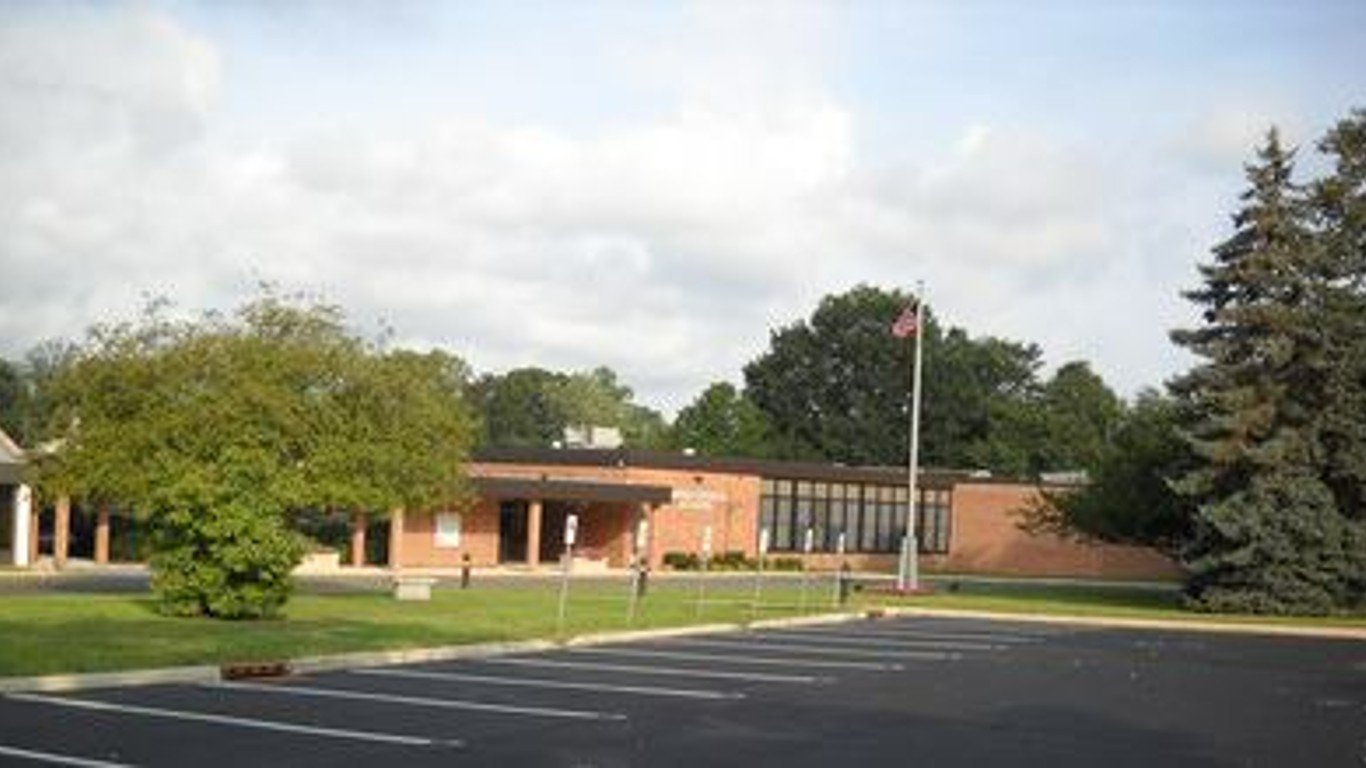
Source: Courtesy of Rumson Borough School District via Facebook
New Jersey: Rumson Borough School District
> Avg. household income: $345,342 (New Jersey: $117,868)
> District graduation rate: N/A
> Annual per pupil spending: $20,456 (New Jersey: $21,331)
> Student-teacher ratio: 10:1 (New Jersey: 12:1)
> District location: Monmouth County
> Total operational school districts in New Jersey: 688

Source: Courtesy of Los Alamos Public Schools via Facebook
New Mexico: Los Alamos Public Schools
> Avg. household income: $141,162 (New Mexico: $70,241)
> District graduation rate: 91%
> Annual per pupil spending: $11,249 (New Mexico: $10,466)
> Student-teacher ratio: 15:1 (New Mexico: 16:1)
> District location: Los Alamos County
> Total operational school districts in New Mexico: 146
[in-text-ad]

Source: Courtesy of Scarsdale Public School via Facebook
New York: Scarsdale Union Free School District
> Avg. household income: $466,343 (New York: $105,304)
> District graduation rate: 99%
> Annual per pupil spending: $29,937 (New York: $24,882)
> Student-teacher ratio: 12:1 (New York: 13:1)
> District location: Westchester County
> Total operational school districts in New York: 1,057

Source: Courtesy of Wake County Public School System via Facebook
North Carolina: Wake County Schools
> Avg. household income: $106,822 (North Carolina: $79,620)
> District graduation rate: 90%
> Annual per pupil spending: $9,395 (North Carolina: $9,799)
> Student-teacher ratio: 16:1 (North Carolina: 15:1)
> District location: Wake County
> Total operational school districts in North Carolina: 330
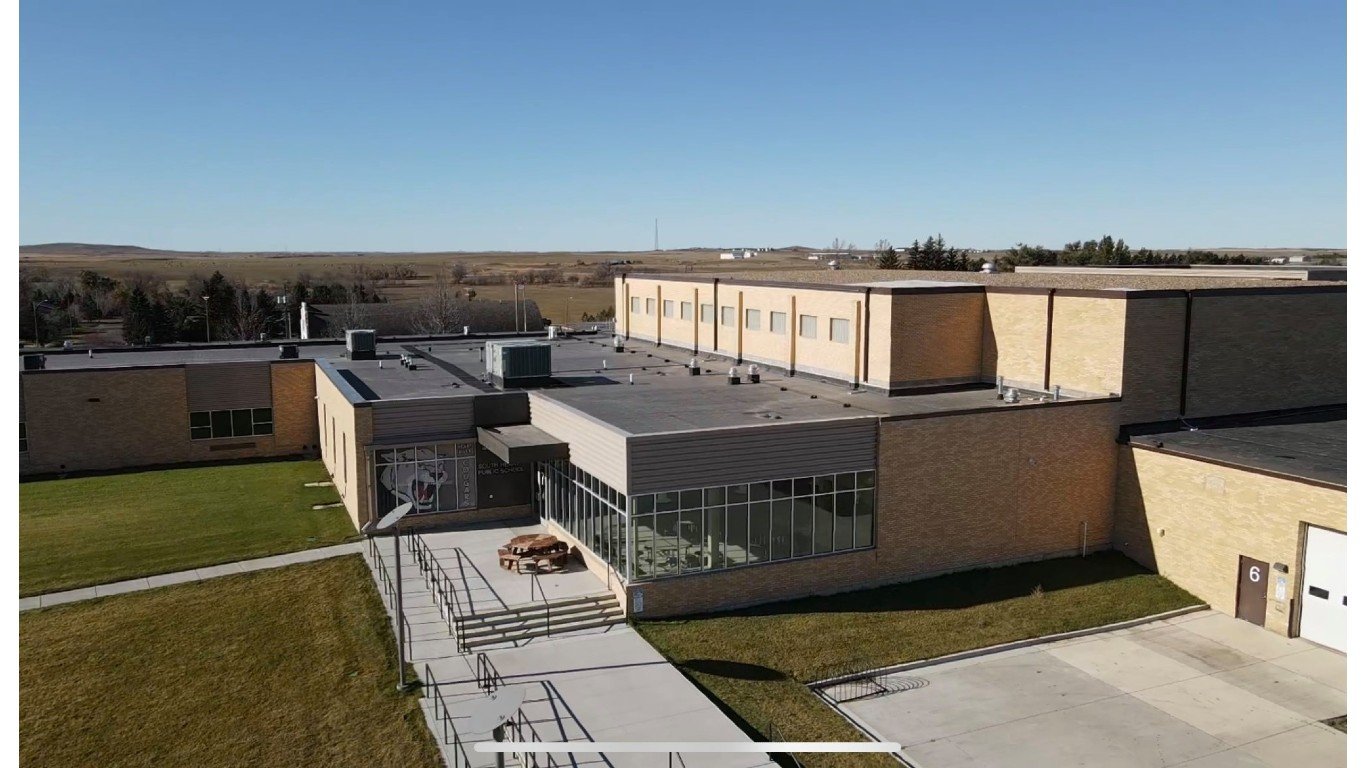
Source: Courtesy of South Heart Public School via Facebook
North Dakota: South Heart School District No. 9
> Avg. household income: $114,918 (North Dakota: $85,506)
> District graduation rate: N/A
> Annual per pupil spending: $12,853 (North Dakota: $14,033)
> Student-teacher ratio: 12:1 (North Dakota: 12:1)
> District location: Stark County
> Total operational school districts in North Dakota: 225
[in-text-ad-2]

Source: Courtesy of Orange City School District via Facebook
Ohio: Orange City
> Avg. household income: $243,210 (Ohio: $78,797)
> District graduation rate: 92%
> Annual per pupil spending: $24,437 (Ohio: $13,433)
> Student-teacher ratio: 14:1 (Ohio: 17:1)
> District location: Cuyahoga County
> Total operational school districts in Ohio: 1,043

Source: Courtesy of Deer Creek School District via Facebook
Oklahoma: Deer Creek
> Avg. household income: $140,124 (Oklahoma: $74,195)
> District graduation rate: 96%
> Annual per pupil spending: $9,048 (Oklahoma: $9,203)
> Student-teacher ratio: 19:1 (Oklahoma: 16:1)
> District location: Oklahoma County
> Total operational school districts in Oklahoma: 597
[in-text-ad]

Source: Courtesy of West Linn-Wilsonville School District via Facebook
Oregon: West Linn-Wilsonville School District
> Avg. household income: $132,574 (Oregon: $88,137)
> District graduation rate: 95%
> Annual per pupil spending: $11,460 (Oregon: $12,457)
> Student-teacher ratio: 20:1 (Oregon: 20:1)
> District location: Clackamas County
> Total operational school districts in Oregon: 222
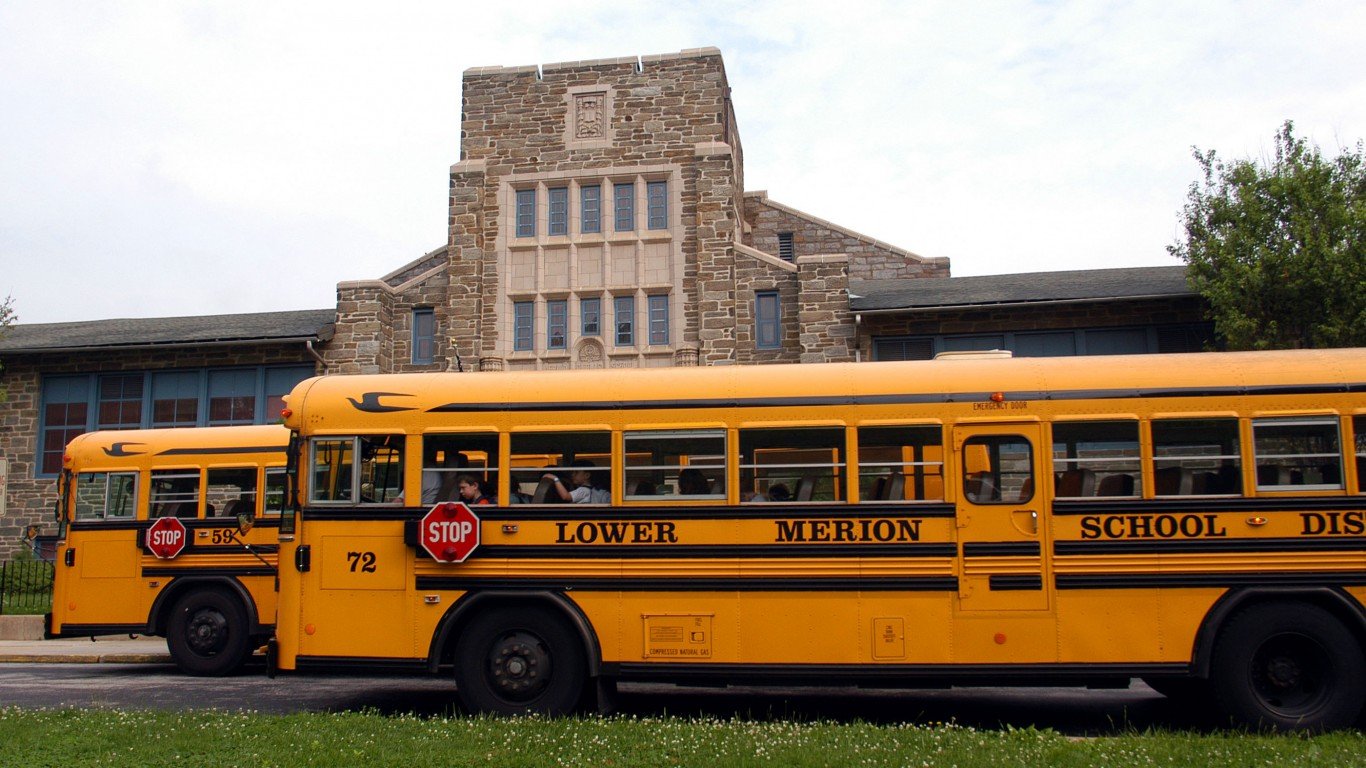
Source: William Thomas Cain / Getty Images News via Getty Images
Pennsylvania: Lower Merion School District
> Avg. household income: $218,005 (Pennsylvania: $87,262)
> District graduation rate: 97%
> Annual per pupil spending: $25,591 (Pennsylvania: $16,892)
> Student-teacher ratio: 12:1 (Pennsylvania: 14:1)
> District location: Montgomery County
> Total operational school districts in Pennsylvania: 789

Source: Courtesy of Barrington Public Schools via Facebook
Rhode Island: Barrington
> Avg. household income: $177,659 (Rhode Island: $92,427)
> District graduation rate: 94%
> Annual per pupil spending: $15,344 (Rhode Island: $17,539)
> Student-teacher ratio: 15:1 (Rhode Island: 13:1)
> District location: Bristol County
> Total operational school districts in Rhode Island: 64
[in-text-ad-2]

Source: panitan punpuang / iStock via Getty Images
South Carolina: Lexington-Richland School District No. 5
> Avg. household income: $96,105 (South Carolina: $76,390)
> District graduation rate: 88%
> Annual per pupil spending: $12,977 (South Carolina: $10,994)
> Student-teacher ratio: 13:1 (South Carolina: 15:1)
> District location: Richland County
> Total operational school districts in South Carolina: 102

Source: Courtesy of Harrisburg School District 41-2 via Facebook
South Dakota: Harrisburg School District
> Avg. household income: $118,082 (South Dakota: $77,932)
> District graduation rate: 88%
> Annual per pupil spending: $9,448 (South Dakota: $10,325)
> Student-teacher ratio: 14:1 (South Dakota: 14:1)
> District location: Lincoln County
> Total operational school districts in South Dakota: 166
[in-text-ad]

Tennessee: Collierville
> Avg. household income: $143,456 (Tennessee: $76,937)
> District graduation rate: 95%
> Annual per pupil spending: $9,961 (Tennessee: $9,941)
> Student-teacher ratio: 16:1 (Tennessee: 16:1)
> District location: Shelby County
> Total operational school districts in Tennessee: 147

Source: Courtesy of Friendswood ISD via Facebook
Texas: Friendswood Independent School District
> Avg. household income: $167,090 (Texas: $89,506)
> District graduation rate: 97%
> Annual per pupil spending: $8,972 (Texas: $9,868)
> Student-teacher ratio: 16:1 (Texas: 15:1)
> District location: Galveston County
> Total operational school districts in Texas: 1,226

Source: Courtesy of Canyons School District via Facebook
Utah: Canyons District
> Avg. household income: $114,020 (Utah: $94,452)
> District graduation rate: 86%
> Annual per pupil spending: $8,161 (Utah: $7,950)
> Student-teacher ratio: 24:1 (Utah: 23:1)
> District location: Salt Lake County
> Total operational school districts in Utah: 161
[in-text-ad-2]

Vermont: Norwich School District
> Avg. household income: $155,346 (Vermont: $83,767)
> District graduation rate: N/A
> Annual per pupil spending: $22,730 (Vermont: $21,217)
> Student-teacher ratio: 12:1 (Vermont: 11:1)
> District location: Windsor County
> Total operational school districts in Vermont: 235

Source: Courtesy of Falls Church City Public Schools via Facebook
Virginia: Falls Church City Public Schools
> Avg. household income: $181,261 (Virginia: $106,023)
> District graduation rate: 98%
> Annual per pupil spending: $19,222 (Virginia: $12,642)
> Student-teacher ratio: 14:1 (Virginia: 15:1)
> District location: Falls Church city
> Total operational school districts in Virginia: 215
[in-text-ad]

Source: Courtesy of Lake Washington School District via Facebook
Washington: Lake Washington School District
> Avg. household income: $170,160 (Washington: $103,669)
> District graduation rate: 93%
> Annual per pupil spending: $13,238 (Washington: $14,342)
> Student-teacher ratio: 18:1 (Washington: 18:1)
> District location: King County
> Total operational school districts in Washington: 336
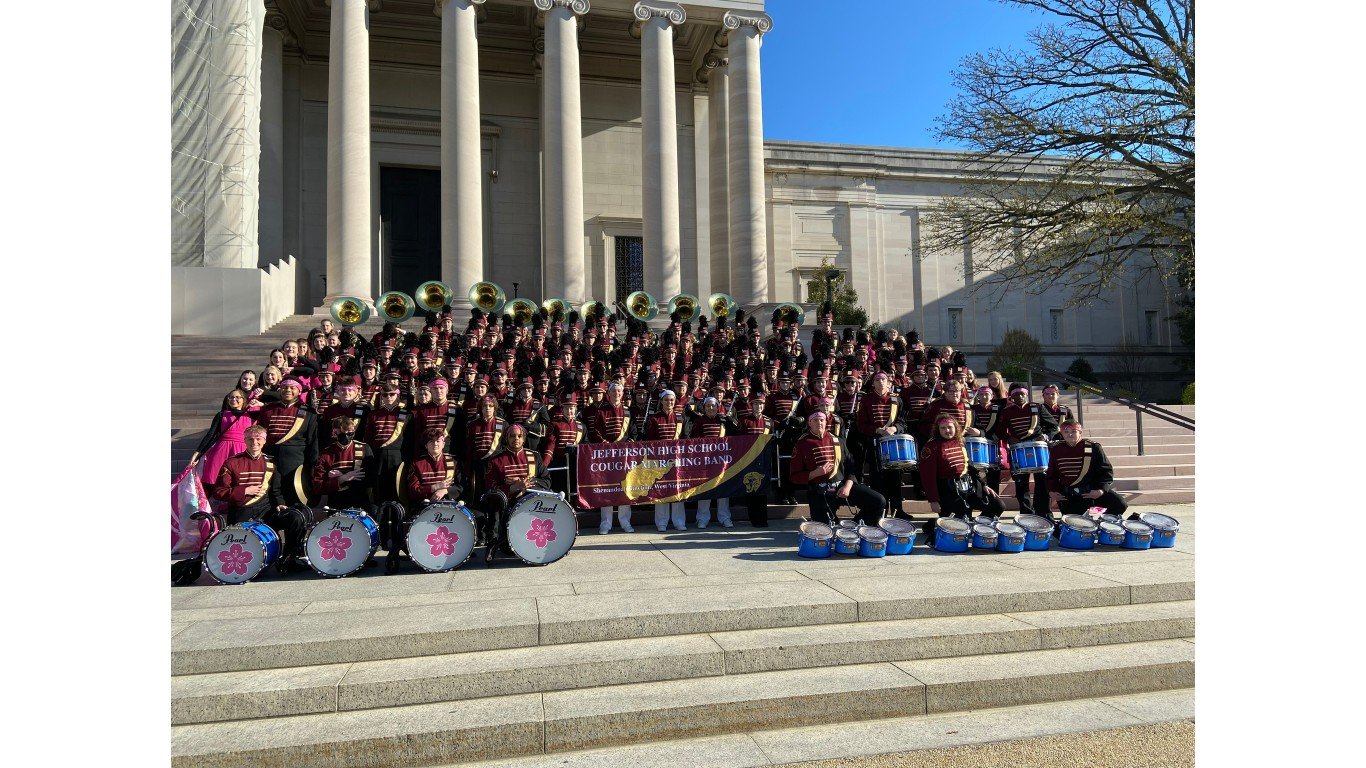
Source: Courtesy of Jefferson County Schools, WV via Facebook
West Virginia: Jefferson County Schools
> Avg. household income: $96,911 (West Virginia: $65,332)
> District graduation rate: 90%
> Annual per pupil spending: $11,819 (West Virginia: $12,269)
> Student-teacher ratio: 15:1 (West Virginia: 14:1)
> District location: Jefferson County
> Total operational school districts in West Virginia: 57

Source: Courtesy of Maple Dale-Indian Hill School District via Facebook
Wisconsin: Maple Dale-Indian Hill School District
> Avg. household income: $240,795 (Wisconsin: $82,757)
> District graduation rate: N/A
> Annual per pupil spending: $16,563 (Wisconsin: $12,690)
> Student-teacher ratio: 12:1 (Wisconsin: 14:1)
> District location: Milwaukee County
> Total operational school districts in Wisconsin: 463
[in-text-ad-2]

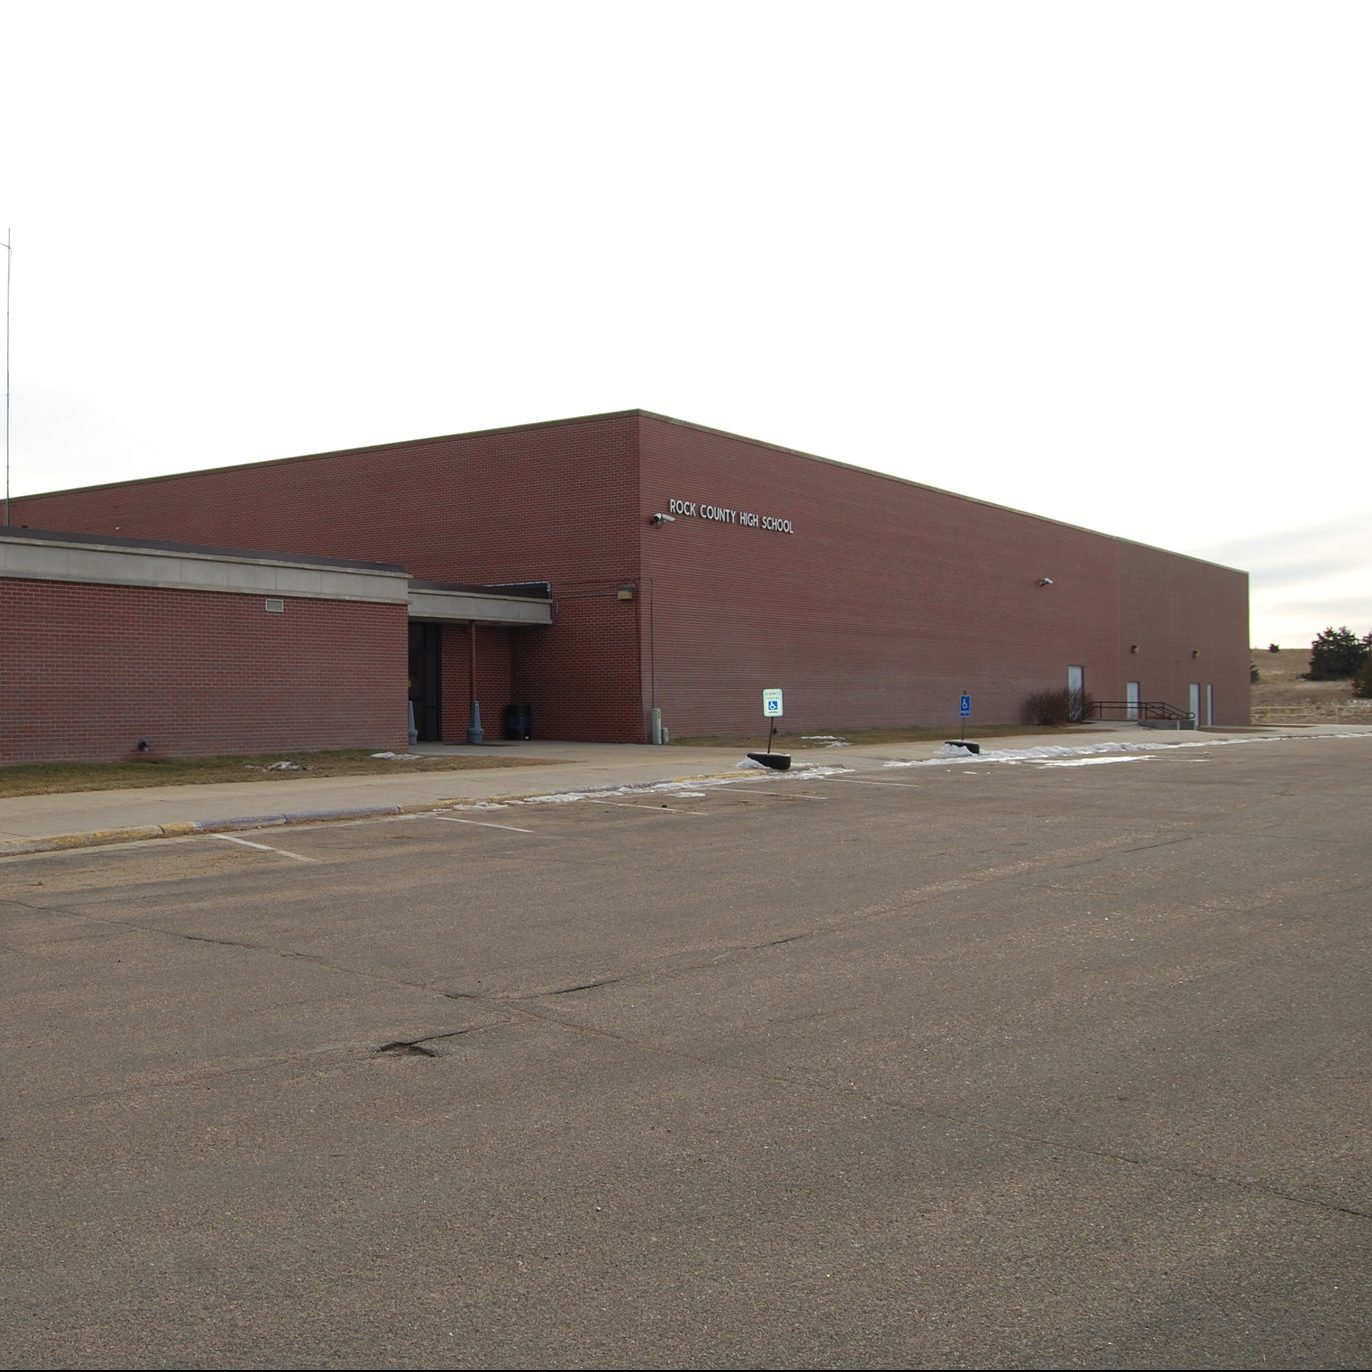
Source: Public Domain / Wikimedia Commons
Wyoming: Laramie County School District No. 2
> Avg. household income: $98,751 (Wyoming: $83,583)
> District graduation rate: 95%
> Annual per pupil spending: $17,849 (Wyoming: $16,228)
> Student-teacher ratio: 11:1 (Wyoming: 13:1)
> District location: Laramie County
> Total operational school districts in Wyoming: 62
Methodology
To identify the richest school districts in every state, 24/7 Wall St. reviewed mean household income at the district level with five-year data from the U.S. Census Bureau’s 2020 American Community Survey. Only school districts with at least 100 students and data on household income were considered.
We also considered average annual per pupil spending and student-to-teacher ratios at the district and state level from the National Center for Education Statistics. Total operational school districts by state are also from NCES. All NCES data, including enrollment, is for the 2018-2019 academic year, the most recent with available district level expenditure data.
Supplemental data on average graduation rates are from Niche, a school and neighborhood data platform.
Louisiana was excluded from analysis due to a lack of income data at the school district level. Additionally, Hawaii only has one school district, and it ranks as both the richest and poorest by default.
Sponsored: Attention Savvy Investors: Speak to 3 Financial Experts – FREE
Ever wanted an extra set of eyes on an investment you’re considering? Now you can speak with up to 3 financial experts in your area for FREE. By simply
clicking here you can begin to match with financial professionals who can help guide you through the financial decisions you’re making. And the best part? The first conversation with them is free.
Click here to match with up to 3 financial pros who would be excited to help you make financial decisions.
Thank you for reading! Have some feedback for us?
Contact the 24/7 Wall St. editorial team.
Editors' Picks