The introduction of a polar vortex this week across the Northeast will introduce frigid temperatures that could challenge records. Accompanied by high winds, windchill could drive the temperature people feel to between 30 and 50 below zero in parts of northern New York state and New England.
The U.S. National Oceanic and Atmospheric Administration reports that Earth’s temperature has risen by an average of 0.14 degrees Fahrenheit every decade since 1880, when humans began accelerating industrial activities. Since 1981, however, that rate has more than doubled to an increase of 0.32 F in average temperatures every decade. (Earth’s CO2 level rose every year since climate change became a national issue.)
The 20th century average of the combined global land and ocean temperatures was 57 F, nearly 2 degrees Fahrenheit higher than pre-industrial levels.
These incremental rises in temperature may not seem like much if you judge it by the air temperature outside today, but they have profound effects on ecological systems and the climate, causing more frequent and powerful weather events.
The warming of air and water temperatures due to human activity in turn leads to natural carbon emissions from the Arctic sea-floor and melting permafrost, putting the accelerator pedal down on global warming. Climate experts warn we can expect more floods, droughts, and wildfires, which have already become common in the modern news cycle.
To identify the temperature the year you were born, 24/7 Wall St. reviewed data on the combined land surface air and sea surface water temperature for 1950 through 2021 from NASA’s Global Land-Ocean Temperature Index. We also added the anomaly – the temperature compared to a base period. NASA used 57 degrees Fahrenheit, which is the average global temperature from 1951-1980, as the base. The hottest month each year also came from the report.
From 1950 to 2021, the global average of combined land-sea temperatures has been below 57 degrees Fahrenheit — the base period temperature average — in only 15 years. The last time was in 1976. This means anyone under the age of 45 has lived their entire lives in a warmer world with increasingly damaging climate effects.
Furthermore, anyone born since 2018 has lived with a global land-air temperature average of 58.5 F or higher. People born into the coming years will almost surely live with this average temperature above 59 F.
The anomalies compared to the base period have increased as well. While in 1976 the average temperature was 0.18 degrees below the base period average temperature of 57 F, by 2021 the average temperature was 1.51 F above it. In 2020, temperature was 1.84 degrees above the 1951-1980 global average. (Here are the worst states driving the climate crisis.)
Here is how abnormal the world’s temperature was every year since 1950.

Source: James W. Welgos / Getty Images
1950
> Average land-ocean temperature: 56.7° Fahrenheit – #70 highest
> Anomaly from 1951-1980 avg: 0.31° below 57° Fahrenheit
> Hottest month: June (56.9°)
[in-text-ad]

Source: Archive Photos / Getty Images
1951
> Average land-ocean temperature: 56.9° Fahrenheit – #62 highest
> Anomaly from 1951-1980 avg: 0.13° below 57° Fahrenheit
> Hottest month: December (57.3°)
Source: Graphic House / Getty Images
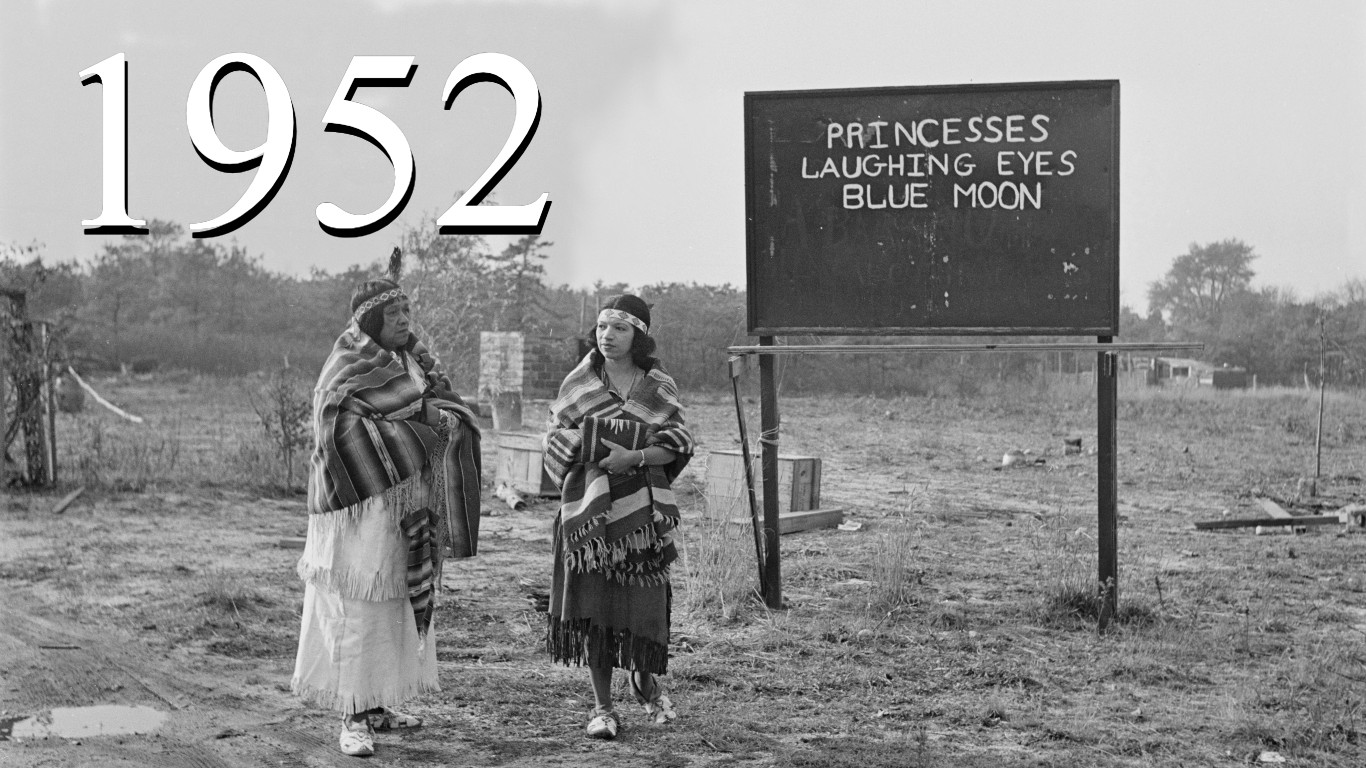
1952
> Average land-ocean temperature: 57.0° Fahrenheit – #56 highest
> Anomaly from 1951-1980 avg: 0.02° above 57° Fahrenheit
> Hottest month: January (57.2°)

Source: Michael Ochs Archives / Getty Images
1953
> Average land-ocean temperature: 57.1° Fahrenheit – #46 highest
> Anomaly from 1951-1980 avg: 0.14° above 57° Fahrenheit
> Hottest month: April (57.3°)

Source: Archive Photos / Getty Images
1954
> Average land-ocean temperature: 56.8° Fahrenheit – #68 highest
> Anomaly from 1951-1980 avg: 0.23° below 57° Fahrenheit
> Hottest month: November (57.1°)

Source: Michael Ochs Archives / Getty Images
1955
> Average land-ocean temperature: 56.7° Fahrenheit – #69 highest
> Anomaly from 1951-1980 avg: 0.25° below 57° Fahrenheit
> Hottest month: January (57.2°)

Source: Phil Burchman / Getty Images
1956
> Average land-ocean temperature: 56.7° Fahrenheit – #71 highest
> Anomaly from 1951-1980 avg: 0.34° below 57° Fahrenheit
> Hottest month: December (56.9°)
[in-text-ad-2]

Source: Michael Ochs Archives / Getty Images
1957
> Average land-ocean temperature: 57.1° Fahrenheit – #50 highest
> Anomaly from 1951-1980 avg: 0.09° above 57° Fahrenheit
> Hottest month: June (57.3°)

Source: Michael Ochs Archives / Getty Images
1958
> Average land-ocean temperature: 57.1° Fahrenheit – #48 highest
> Anomaly from 1951-1980 avg: 0.11° above 57° Fahrenheit
> Hottest month: January (57.7°)
Source: Archive Photos / Getty Images
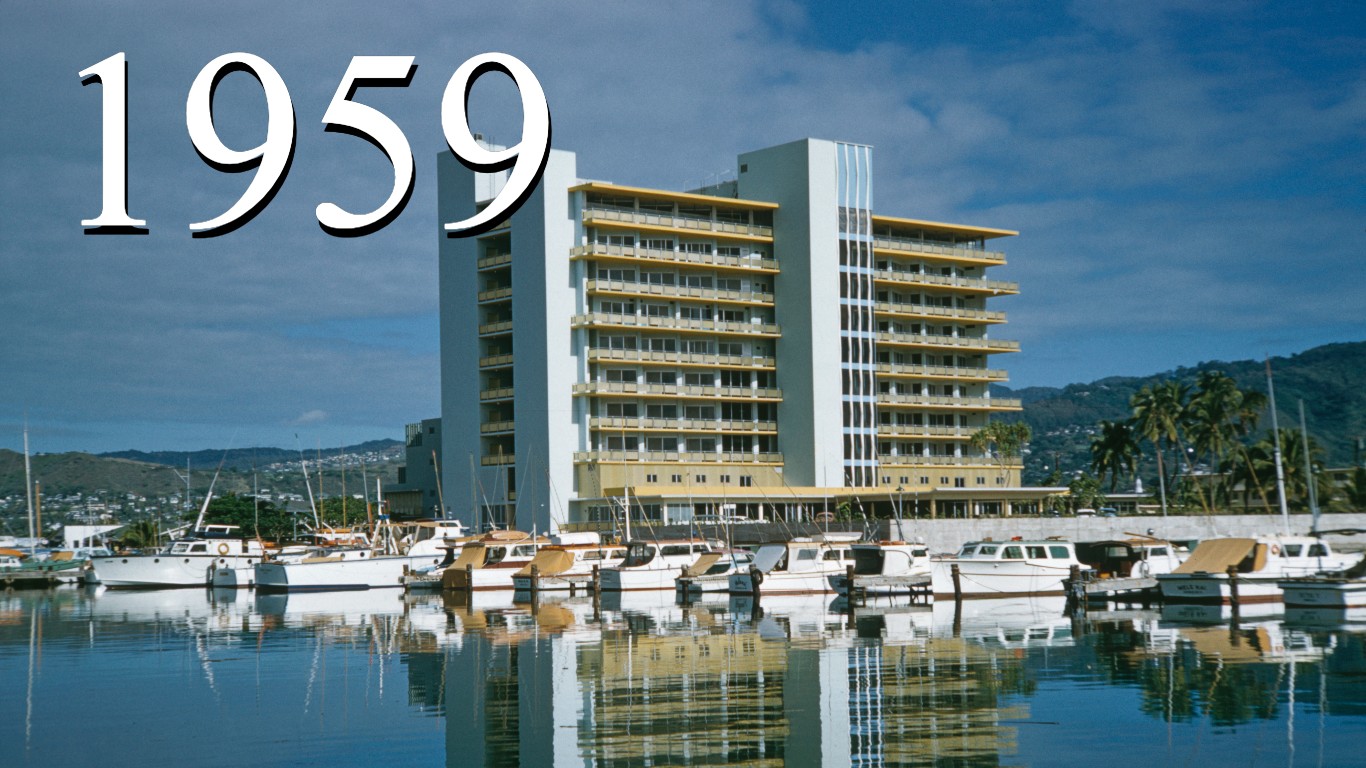
1959
> Average land-ocean temperature: 57.1° Fahrenheit – #53 highest
> Anomaly from 1951-1980 avg: 0.05° above 57° Fahrenheit
> Hottest month: March (57.3°)
Source: Harvey Meston / Getty Images
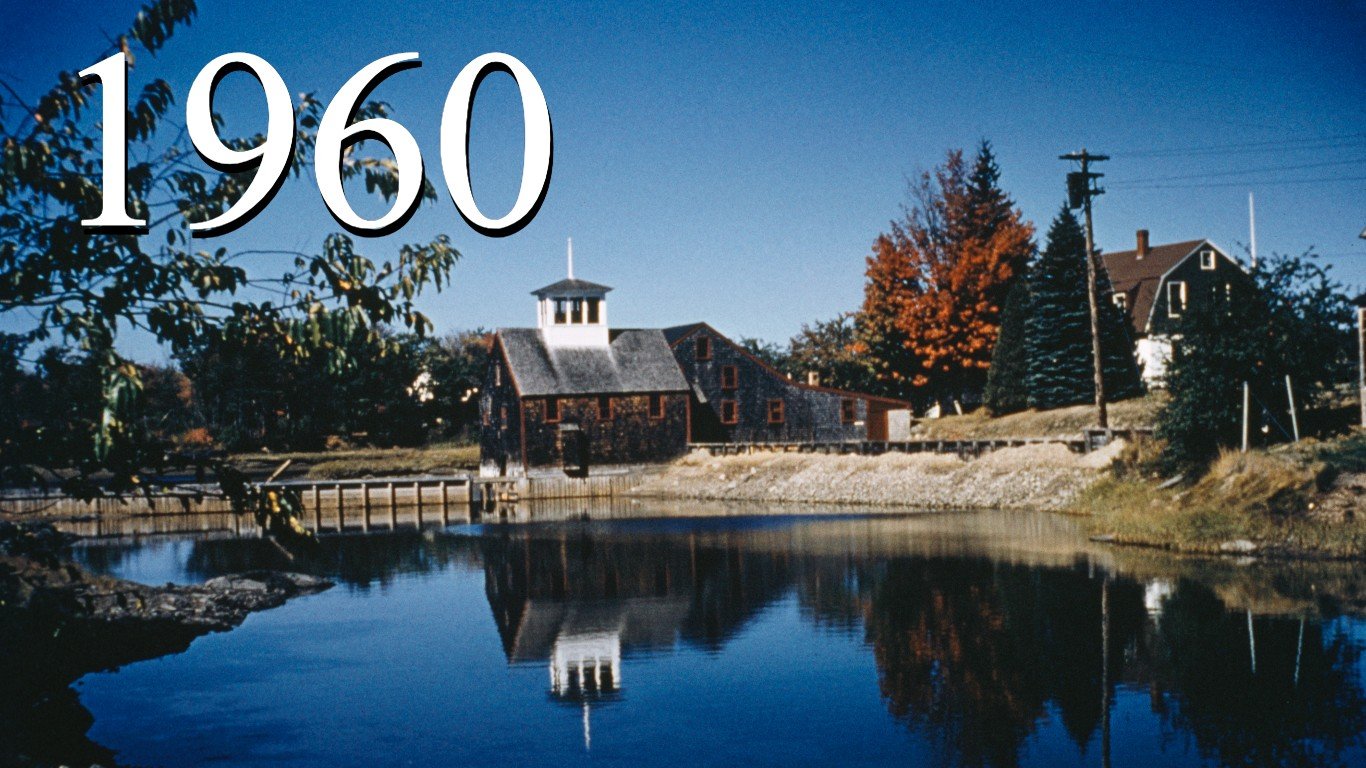
1960
> Average land-ocean temperature: 56.9° Fahrenheit – #60 highest
> Anomaly from 1951-1980 avg: 0.05° below 57° Fahrenheit
> Hottest month: December (57.3°)
[in-text-ad]

Source: Express / Getty Images
1961
> Average land-ocean temperature: 57.1° Fahrenheit – #48 highest
> Anomaly from 1951-1980 avg: 0.11° above 57° Fahrenheit
> Hottest month: February (57.3°)

Source: Michael Ochs Archives / Getty Images
1962
> Average land-ocean temperature: 57.1° Fahrenheit – #53 highest
> Anomaly from 1951-1980 avg: 0.05° above 57° Fahrenheit
> Hottest month: February (57.3°)

Source: Michael Ochs Archives / Getty Images
1963
> Average land-ocean temperature: 57.1° Fahrenheit – #50 highest
> Anomaly from 1951-1980 avg: 0.09° above 57° Fahrenheit
> Hottest month: August (57.4°)
 24/7 Wall St.
Source: Archive Photos / Getty Images
1964
> Average land-ocean temperature: 56.6° Fahrenheit – #72 highest
> Anomaly from 1951-1980 avg: 0.36° below 57° Fahrenheit
> Hottest month: June (56.9°)

Source: Harvey Meston / Getty Images
1965
> Average land-ocean temperature: 56.8° Fahrenheit – #67 highest
> Anomaly from 1951-1980 avg: 0.20° below 57° Fahrenheit
> Hottest month: August (56.9°)

Source: Archive Photos / Getty Images
1966
> Average land-ocean temperature: 56.9° Fahrenheit – #61 highest
> Anomaly from 1951-1980 avg: 0.11° below 57° Fahrenheit
> Hottest month: July (57.1°)
[in-text-ad-2]

Source: Michael Ochs Archives / Getty Images
1967
> Average land-ocean temperature: 57.0° Fahrenheit – #59 highest
> Anomaly from 1951-1980 avg: 0.04° below 57° Fahrenheit
> Hottest month: May (57.2°)
Source: Evening Standard / Getty Images
1968
> Average land-ocean temperature: 56.9° Fahrenheit – #64 highest
> Anomaly from 1951-1980 avg: 0.14° below 57° Fahrenheit
> Hottest month: March (57.4°)

Source: Michael Ochs Archives / Getty Images
1969
> Average land-ocean temperature: 57.1° Fahrenheit – #50 highest
> Anomaly from 1951-1980 avg: 0.09° above 57° Fahrenheit
> Hottest month: December (57.4°)
Source: Harvey Meston / Getty Images
1970
> Average land-ocean temperature: 57.1° Fahrenheit – #53 highest
> Anomaly from 1951-1980 avg: 0.05° above 57° Fahrenheit
> Hottest month: February (57.4°)
[in-text-ad]

Source: Space Frontiers / Getty Images
1971
> Average land-ocean temperature: 56.9° Fahrenheit – #64 highest
> Anomaly from 1951-1980 avg: 0.14° below 57° Fahrenheit
> Hottest month: August (57.0°)

Source: Archive Photos / Getty Images
1972
> Average land-ocean temperature: 57.0° Fahrenheit – #56 highest
> Anomaly from 1951-1980 avg: 0.02° above 57° Fahrenheit
> Hottest month: December (57.3°)
Source: Michael Ochs Archives / Getty Images
1973
> Average land-ocean temperature: 57.3° Fahrenheit – #41 highest
> Anomaly from 1951-1980 avg: 0.29° above 57° Fahrenheit
> Hottest month: February (57.6°)
 24/7 Wall St.
Source: Pictorial Parade / Getty Images
1974
> Average land-ocean temperature: 56.9° Fahrenheit – #62 highest
> Anomaly from 1951-1980 avg: 0.13° below 57° Fahrenheit
> Hottest month: August (57.2°)
Source: Archive Photos / Getty Images
1975
> Average land-ocean temperature: 57.0° Fahrenheit – #58 highest
> Anomaly from 1951-1980 avg: 0.02° below 57° Fahrenheit
> Hottest month: May (57.3°)

Source: Keystone / Getty Images
1976
> Average land-ocean temperature: 56.8° Fahrenheit – #66 highest
> Anomaly from 1951-1980 avg: 0.18° below 57° Fahrenheit
> Hottest month: December (57.2°)
[in-text-ad-2]
Source: Michael Ochs Archives / Getty Images
1977
> Average land-ocean temperature: 57.3° Fahrenheit – #39 highest
> Anomaly from 1951-1980 avg: 0.32° above 57° Fahrenheit
> Hottest month: May (57.6°)

Source: Space Frontiers / Getty Images
1978
> Average land-ocean temperature: 57.1° Fahrenheit – #47 highest
> Anomaly from 1951-1980 avg: 0.13° above 57° Fahrenheit
> Hottest month: March (57.3°)

Source: Tony Duffy / Getty Images
1979
> Average land-ocean temperature: 57.3° Fahrenheit – #41 highest
> Anomaly from 1951-1980 avg: 0.29° above 57° Fahrenheit
> Hottest month: December (57.9°)

Source: FPG / Getty Images
1980
> Average land-ocean temperature: 57.5° Fahrenheit – #36 highest
> Anomaly from 1951-1980 avg: 0.47° above 57° Fahrenheit
> Hottest month: February (57.7°)
[in-text-ad]

Source: Gene Forte / Getty Images
1981
> Average land-ocean temperature: 57.6° Fahrenheit – #31 highest
> Anomaly from 1951-1980 avg: 0.58° above 57° Fahrenheit
> Hottest month: January (58.0°)
Source: Hulton Archive / Getty Images
1982
> Average land-ocean temperature: 57.3° Fahrenheit – #44 highest
> Anomaly from 1951-1980 avg: 0.25° above 57° Fahrenheit
> Hottest month: December (57.8°)
Source: Tony Duffy / Getty Images
1983
> Average land-ocean temperature: 57.6° Fahrenheit – #34 highest
> Anomaly from 1951-1980 avg: 0.56° above 57° Fahrenheit
> Hottest month: January (58.0°)

Source: Michael Ochs Archives / Getty Images
1984
> Average land-ocean temperature: 57.3° Fahrenheit – #41 highest
> Anomaly from 1951-1980 avg: 0.29° above 57° Fahrenheit
> Hottest month: May (57.6°)

Source: Space Frontiers / Getty Images
1985
> Average land-ocean temperature: 57.2° Fahrenheit – #45 highest
> Anomaly from 1951-1980 avg: 0.22° above 57° Fahrenheit
> Hottest month: January (57.4°)

Source: Getty Images / Staff
1986
> Average land-ocean temperature: 57.3° Fahrenheit – #39 highest
> Anomaly from 1951-1980 avg: 0.32° above 57° Fahrenheit
> Hottest month: February (57.7°)
[in-text-ad-2]

Source: Rick Stewart / Getty Images
1987
> Average land-ocean temperature: 57.6° Fahrenheit – #31 highest
> Anomaly from 1951-1980 avg: 0.58° above 57° Fahrenheit
> Hottest month: December (57.8°)

Source: Getty Images / Staff
1988
> Average land-ocean temperature: 57.7° Fahrenheit – #27 highest
> Anomaly from 1951-1980 avg: 0.70° above 57° Fahrenheit
> Hottest month: January (58.0°)

Source: Pascal Rondeau / Getty Images
1989
> Average land-ocean temperature: 57.5° Fahrenheit – #35 highest
> Anomaly from 1951-1980 avg: 0.49° above 57° Fahrenheit
> Hottest month: December (57.7°)

Source: Space Frontiers / Getty Images
1990
> Average land-ocean temperature: 57.8° Fahrenheit – #24 highest
> Anomaly from 1951-1980 avg: 0.81° above 57° Fahrenheit
> Hottest month: March (58.4°)
[in-text-ad]

Source: Public Domain / Wikimedia Commons
1991
> Average land-ocean temperature: 57.7° Fahrenheit – #26 highest
> Anomaly from 1951-1980 avg: 0.72° above 57° Fahrenheit
> Hottest month: June (58.0°)

Source: Public Domain / Wikimedia Commons
1992
> Average land-ocean temperature: 57.4° Fahrenheit – #38 highest
> Anomaly from 1951-1980 avg: 0.40° above 57° Fahrenheit
> Hottest month: January (57.9°)

Source: Public Domain / Wikimedia Commons
1993
> Average land-ocean temperature: 57.4° Fahrenheit – #37 highest
> Anomaly from 1951-1980 avg: 0.41° above 57° Fahrenheit
> Hottest month: February (57.7°)

Source: Phil Cole / Getty Images
1994
> Average land-ocean temperature: 57.6° Fahrenheit – #31 highest
> Anomaly from 1951-1980 avg: 0.58° above 57° Fahrenheit
> Hottest month: June (57.8°)

Source: Public Domain / Wikimedia Commons
1995
> Average land-ocean temperature: 57.8° Fahrenheit – #24 highest
> Anomaly from 1951-1980 avg: 0.81° above 57° Fahrenheit
> Hottest month: February (58.4°)

Source: Jeff J Mitchell / Getty Images
1996
> Average land-ocean temperature: 57.6° Fahrenheit – #30 highest
> Anomaly from 1951-1980 avg: 0.59° above 57° Fahrenheit
> Hottest month: August (57.9°)
[in-text-ad-2]

Source: Doug Pensinger / Getty Images
1997
> Average land-ocean temperature: 57.8° Fahrenheit – #23 highest
> Anomaly from 1951-1980 avg: 0.83° above 57° Fahrenheit
> Hottest month: November (58.2°)

Source: Space Frontiers / Getty Images
1998
> Average land-ocean temperature: 58.1° Fahrenheit – #18 highest
> Anomaly from 1951-1980 avg: 1.10° above 57° Fahrenheit
> Hottest month: February (58.6°)

Source: USAF / Getty Images
1999
> Average land-ocean temperature: 57.7° Fahrenheit – #29 highest
> Anomaly from 1951-1980 avg: 0.68° above 57° Fahrenheit
> Hottest month: February (58.2°)
Source: NASA / Getty Images
2000
> Average land-ocean temperature: 57.7° Fahrenheit – #27 highest
> Anomaly from 1951-1980 avg: 0.70° above 57° Fahrenheit
> Hottest month: April (58.0°)
[in-text-ad]

Source: Mark Wilson / Getty Images
2001
> Average land-ocean temperature: 58.0° Fahrenheit – #21 highest
> Anomaly from 1951-1980 avg: 0.95° above 57° Fahrenheit
> Hottest month: November (58.3°)

Source: Mark Wilson / Getty Images
2002
> Average land-ocean temperature: 58.1° Fahrenheit – #15 highest
> Anomaly from 1951-1980 avg: 1.13° above 57° Fahrenheit
> Hottest month: March (58.6°)
Source: Scott Barbour / Getty Images
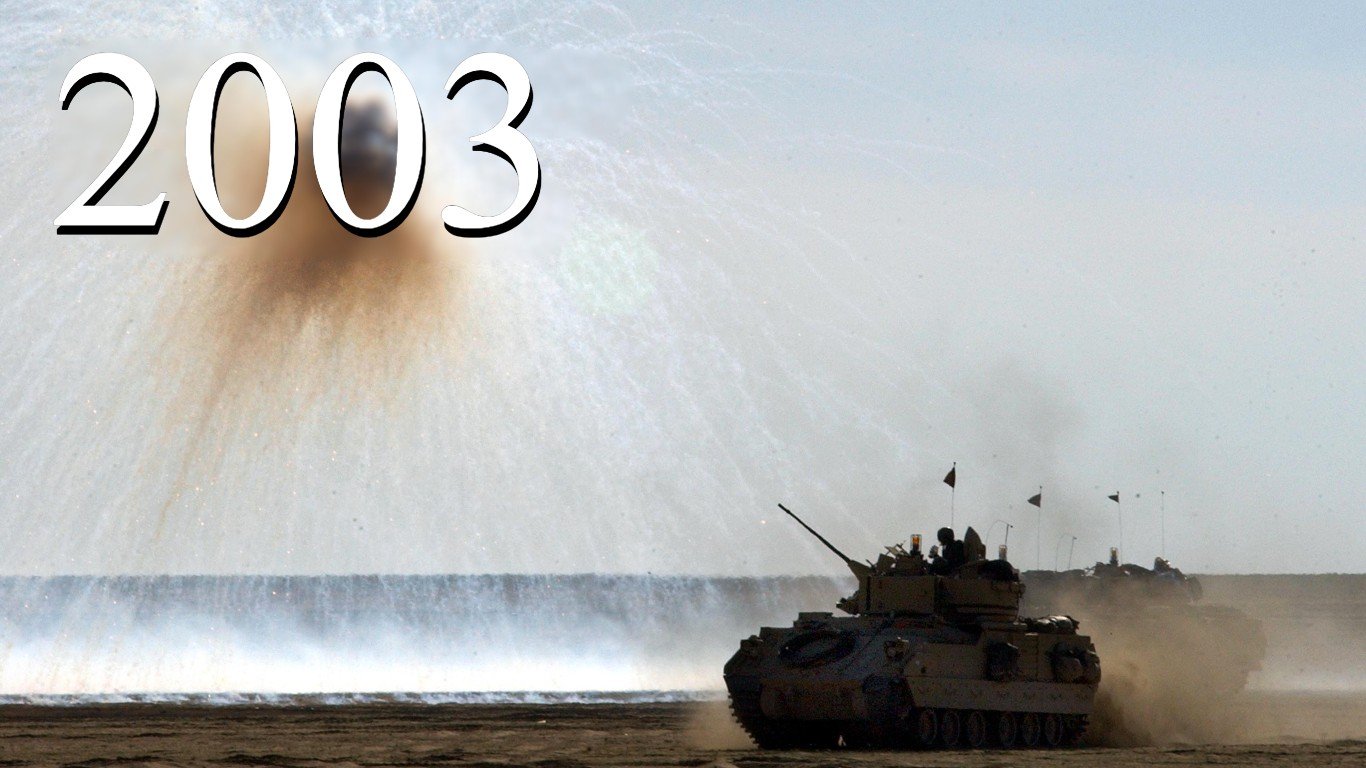
2003
> Average land-ocean temperature: 58.1° Fahrenheit – #17 highest
> Anomaly from 1951-1980 avg: 1.12° above 57° Fahrenheit
> Hottest month: January (58.4°)

Source: Chris Jackson / Getty Images
2004
> Average land-ocean temperature: 58.0° Fahrenheit – #21 highest
> Anomaly from 1951-1980 avg: 0.95° above 57° Fahrenheit
> Hottest month: February (58.3°)

2005
> Average land-ocean temperature: 58.2° Fahrenheit – #10 highest
> Anomaly from 1951-1980 avg: 1.21° above 57° Fahrenheit
> Hottest month: October (58.4°)

Source: Wathiq Khuzaie / Getty Images
2006
> Average land-ocean temperature: 58.1° Fahrenheit – #15 highest
> Anomaly from 1951-1980 avg: 1.13° above 57° Fahrenheit
> Hottest month: December (58.4°)
[in-text-ad-2]

Source: David Paul Morris / Getty Images
2007
> Average land-ocean temperature: 58.2° Fahrenheit – #12 highest
> Anomaly from 1951-1980 avg: 1.19° above 57° Fahrenheit
> Hottest month: January (58.8°)

Source: Spencer Platt / Getty Images
2008
> Average land-ocean temperature: 58.0° Fahrenheit – #20 highest
> Anomaly from 1951-1980 avg: 0.97° above 57° Fahrenheit
> Hottest month: March (58.3°)

Source: Alex Wong / Getty Images
2009
> Average land-ocean temperature: 58.2° Fahrenheit – #13 highest
> Anomaly from 1951-1980 avg: 1.17° above 57° Fahrenheit
> Hottest month: November (58.4°)
Source: Chris Graythen / Getty Images
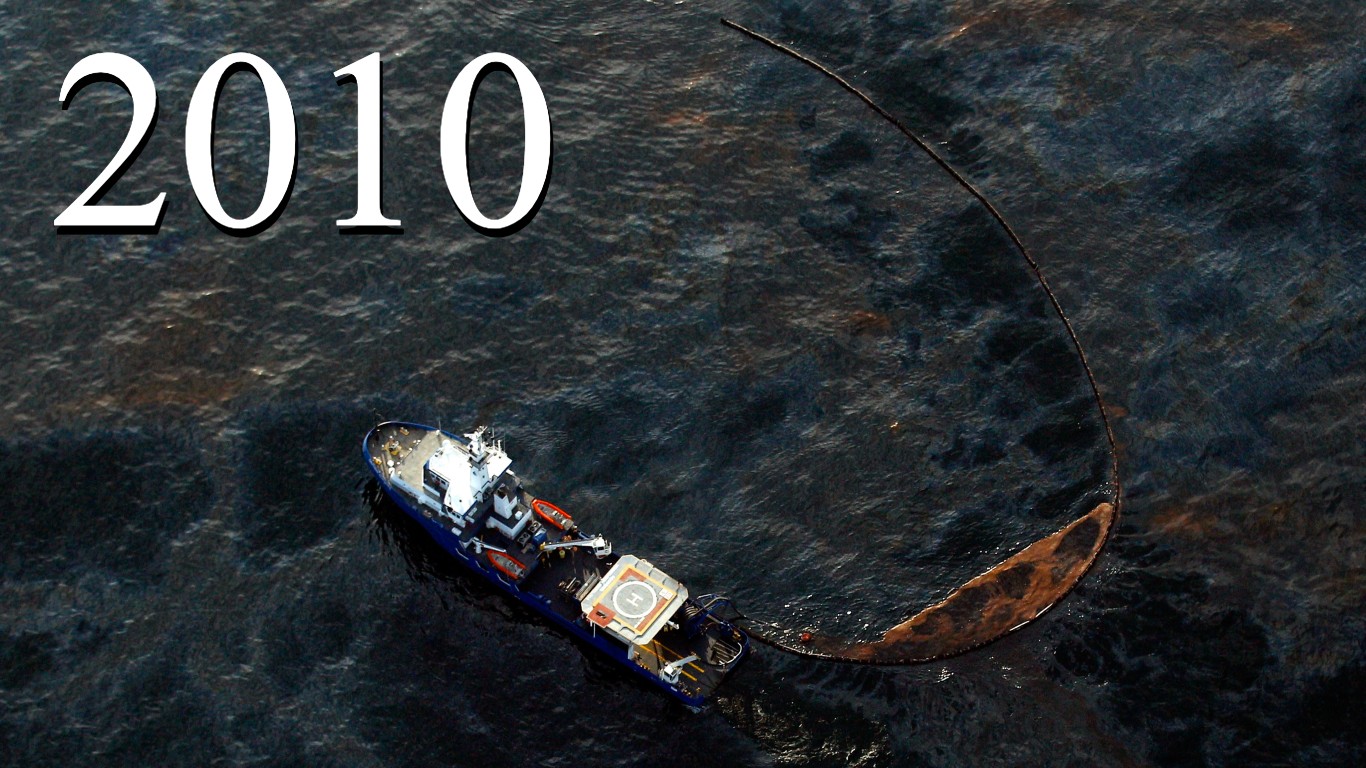
2010
> Average land-ocean temperature: 58.3° Fahrenheit – #9 highest
> Anomaly from 1951-1980 avg: 1.30° above 57° Fahrenheit
> Hottest month: March (58.7°)
[in-text-ad]

Source: Majid Saeedi / Getty Images
2011
> Average land-ocean temperature: 58.1° Fahrenheit – #18 highest
> Anomaly from 1951-1980 avg: 1.10° above 57° Fahrenheit
> Hottest month: August (58.3°)

Source: Peter Macdiarmid / Getty Images
2012
> Average land-ocean temperature: 58.2° Fahrenheit – #13 highest
> Anomaly from 1951-1980 avg: 1.17° above 57° Fahrenheit
> Hottest month: October (58.4°)

Source: Michael Buckner / Getty Images
2013
> Average land-ocean temperature: 58.2° Fahrenheit – #10 highest
> Anomaly from 1951-1980 avg: 1.21° above 57° Fahrenheit
> Hottest month: November (58.5°)

Source: Sean Gallup / Getty Images
2014
> Average land-ocean temperature: 58.3° Fahrenheit – #8 highest
> Anomaly from 1951-1980 avg: 1.33° above 57° Fahrenheit
> Hottest month: September (58.6°)
Source: NASA / Getty Images
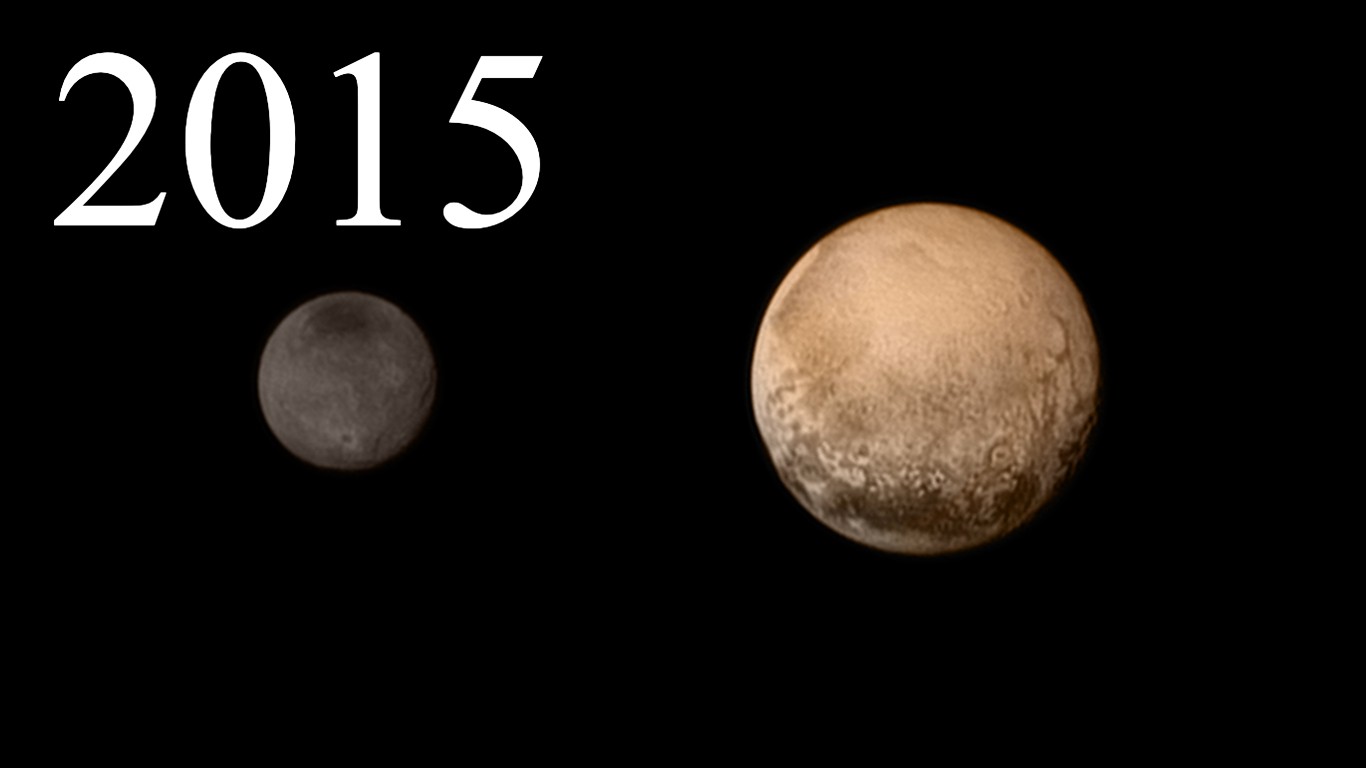
2015
> Average land-ocean temperature: 58.6° Fahrenheit – #5 highest
> Anomaly from 1951-1980 avg: 1.60° above 57° Fahrenheit
> Hottest month: December (59.1°)

Source: Scott Olson / Getty Images
2016
> Average land-ocean temperature: 58.8° Fahrenheit – #2 highest
> Anomaly from 1951-1980 avg: 1.82° above 57° Fahrenheit
> Hottest month: February (59.5°)
[in-text-ad-2]
Source: NASA / Getty Images
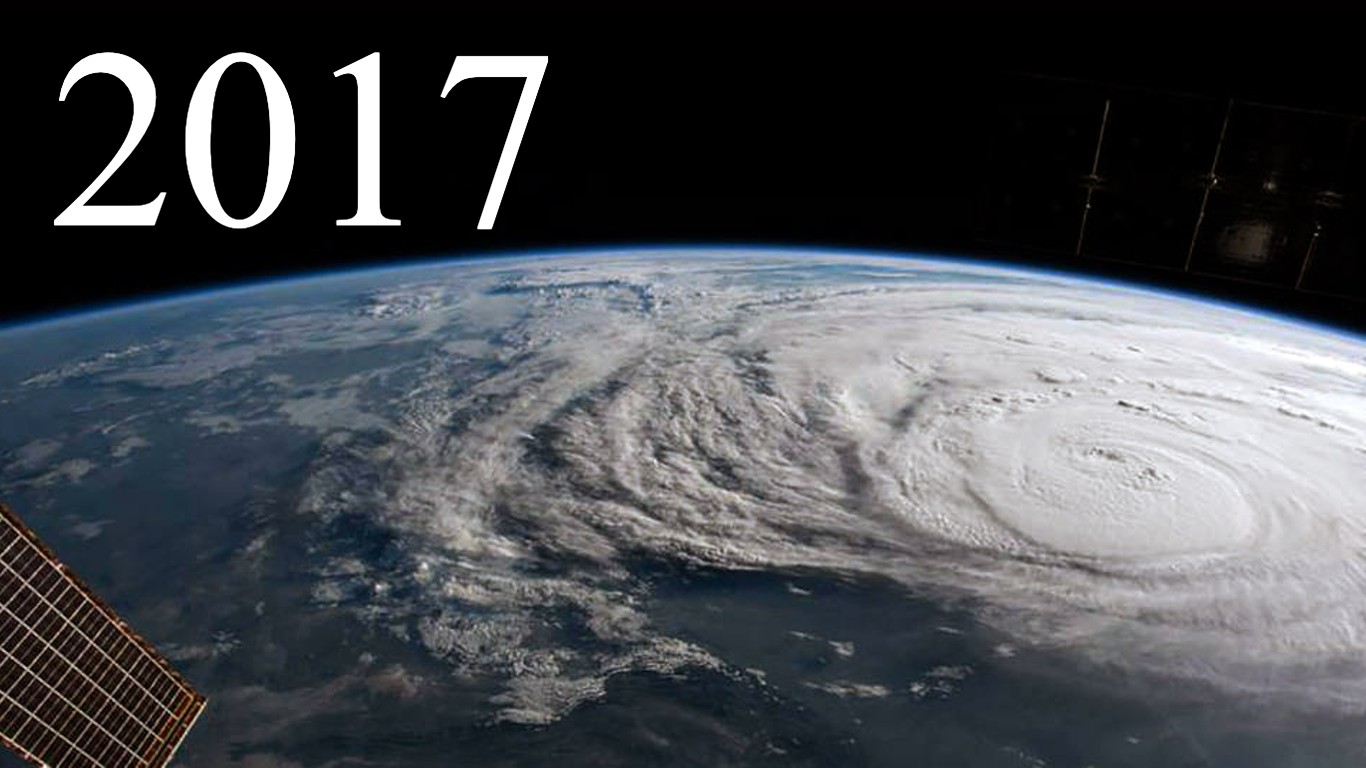
2017
> Average land-ocean temperature: 58.7° Fahrenheit – #4 highest
> Anomaly from 1951-1980 avg: 1.66° above 57° Fahrenheit
> Hottest month: March (59.1°)

Source: Justin Sullivan / Getty Images
2018
> Average land-ocean temperature: 58.5° Fahrenheit – #6 highest
> Anomaly from 1951-1980 avg: 1.51° above 57° Fahrenheit
> Hottest month: October (58.8°)

Source: Anthony Kwan / Getty Images
2019
> Average land-ocean temperature: 58.7° Fahrenheit – #3 highest
> Anomaly from 1951-1980 avg: 1.75° above 57° Fahrenheit
> Hottest month: March (59.1°)

Source: flyparade / Getty Images
2020
> Average land-ocean temperature: 58.8° Fahrenheit – #1 highest
> Anomaly from 1951-1980 avg: 1.84° above 57° Fahrenheit
> Hottest month: February (59.2°)
[in-text-ad]

Source: Alex Wong / Getty Images
2021
> Average land-ocean temperature: 58.5° Fahrenheit – #6 highest
> Anomaly from 1951-1980 avg: 1.51° above 57° Fahrenheit
> Hottest month: October (58.8°)
Take This Retirement Quiz To Get Matched With A Financial Advisor (Sponsored)
Take the quiz below to get matched with a financial advisor today.
Each advisor has been vetted by SmartAsset and is held to a fiduciary standard to act in your best interests.
Here’s how it works:
1. Answer SmartAsset advisor match quiz
2. Review your pre-screened matches at your leisure. Check out the
advisors’ profiles.
3. Speak with advisors at no cost to you. Have an introductory call on the phone or introduction in person and choose whom to work with in the future
Take the retirement quiz right here.
Thank you for reading! Have some feedback for us?
Contact the 24/7 Wall St. editorial team.
Editors' Picks