
Big cities are the hallmark of American society, each embracing different music, sports teams, and art, culminating in a distinct culture for each metropolis. The way of life these cities offer attract many but can drive others away, as we have seen during COVID-19. Apart from distinct cultures, cities also have distinct economies that can affect significant aspects of life, including cost of living.
Just as their economies are different, the cost of living in U.S. metropolitan areas varies. Thriving metro economies where incomes are high and property values are also high, tend to have higher cost of living. On the other hand, cities that may be losing industries and residents may have lower cost of living. (Here is what it actually costs to live in America’s most expensive cities.)
To determine the most expensive city in every state, 24/7 Wall St. reviewed cost of living from the Bureau of Economic Analysis. Metropolitan areas were ranked based on the regional price parity for all goods and services in 2019. Supplemental data on median household income and poverty rate came from the U.S. Census Bureau’s 2020 American Community Survey based on five-year averages.
Housing costs play into this calculus and reflect the income levels of the population living there to a degree. Costs tend to be more expensive in wealthier communities. Of the 50 cities on this list, 42 have a higher median household income compared to their home state, and more than half have median household income of at least $68,000, above the national median.
Keep in mind that some states like New York or California have an outsized impact on the national cost of living, and their sheer impact tilts the scales against them. Also, higher household incomes in these states generally offset the higher cost of living in these states and their massive metros.
Just because a city is the most expensive in its state does not necessarily mean its cost of living is that high when compared to the national average cost of living. In 29 states, the most expensive city has a lower cost of living than is typical nationwide, largely because the prices of goods and services statewide fall well below national prices. In all, 34 states have lower cost of living than the national average. (This state has the highest cost of living.)
Here’s a look at the most expensive city in every state.
Source: Kruck20 / iStock via Getty Images
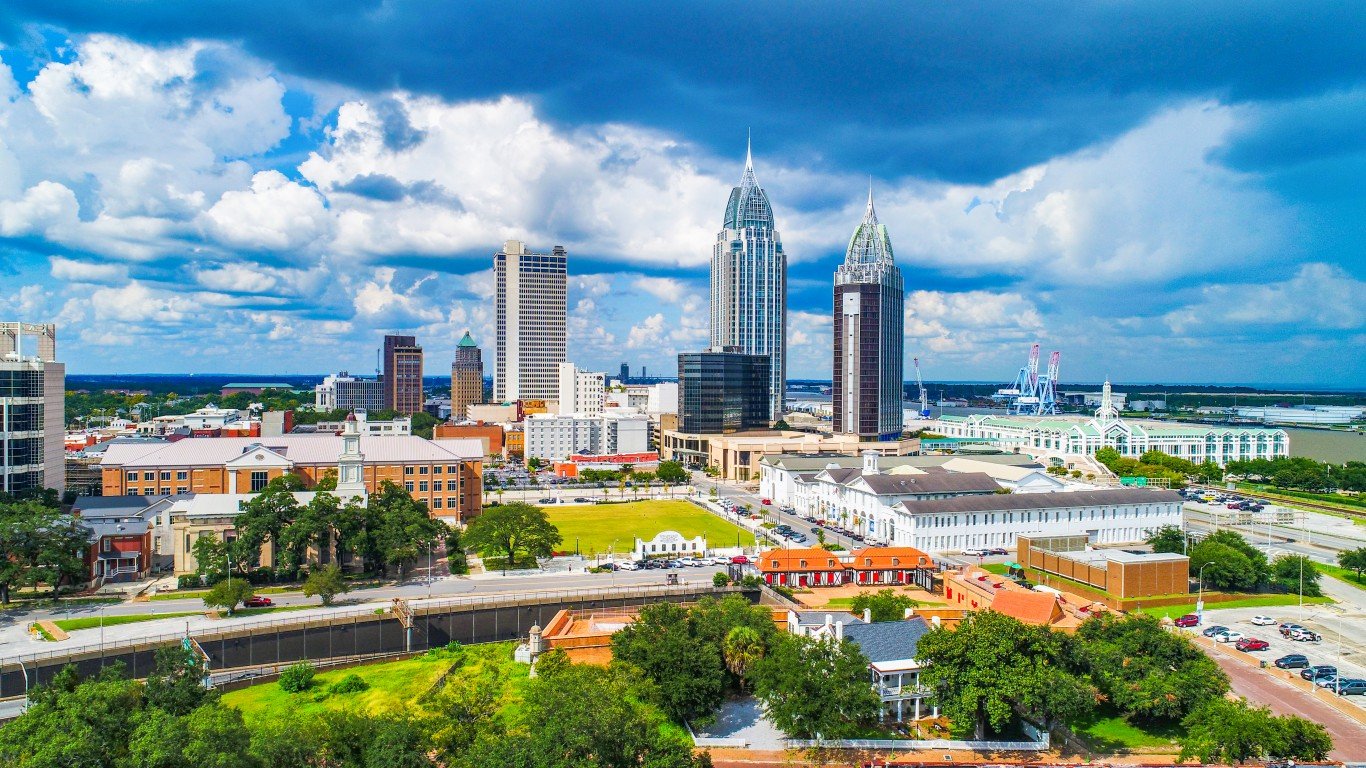
Alabama: Daphne-Fairhope-Foley
>Cost of living in Daphne-Fairhope-Foley: 3.1% less expensive than U.S. avg.
>Cost of living in Alabama: 10.7% less expensive than U.S. avg.
>Poverty rate: 9.2% (state:16.0%)
>Median household income: $61,756 (state: $52,035)
[in-text-ad]
Source: John Pennell / iStock via Getty Images
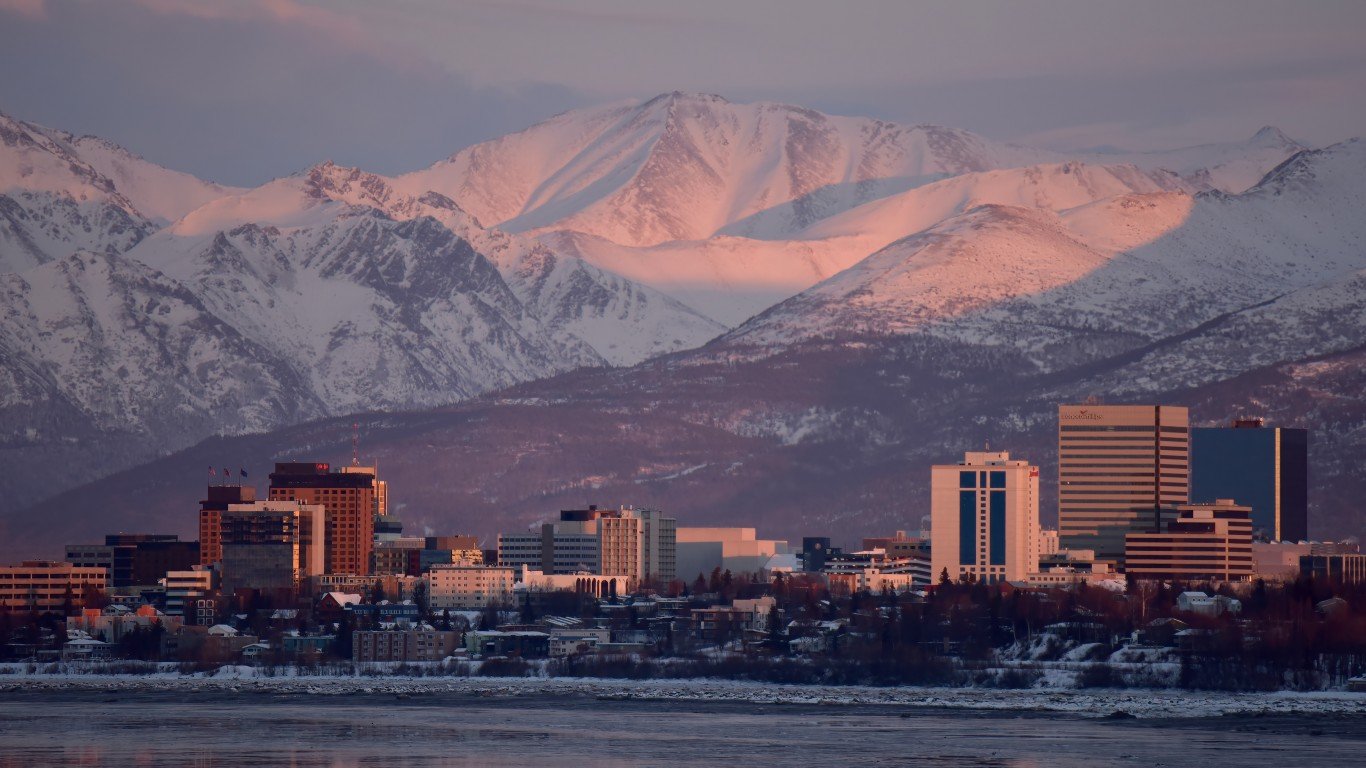
Alaska: Anchorage
>Cost of living in Anchorage: 4.3% more expensive than U.S. avg.
>Cost of living in Alaska: 3.2% more expensive than U.S. avg.
>Poverty rate: 9.2% (state:10.3%)
>Median household income: $82,890 (state: $77,790)
Source: 4kodiak / E+ via Getty Images
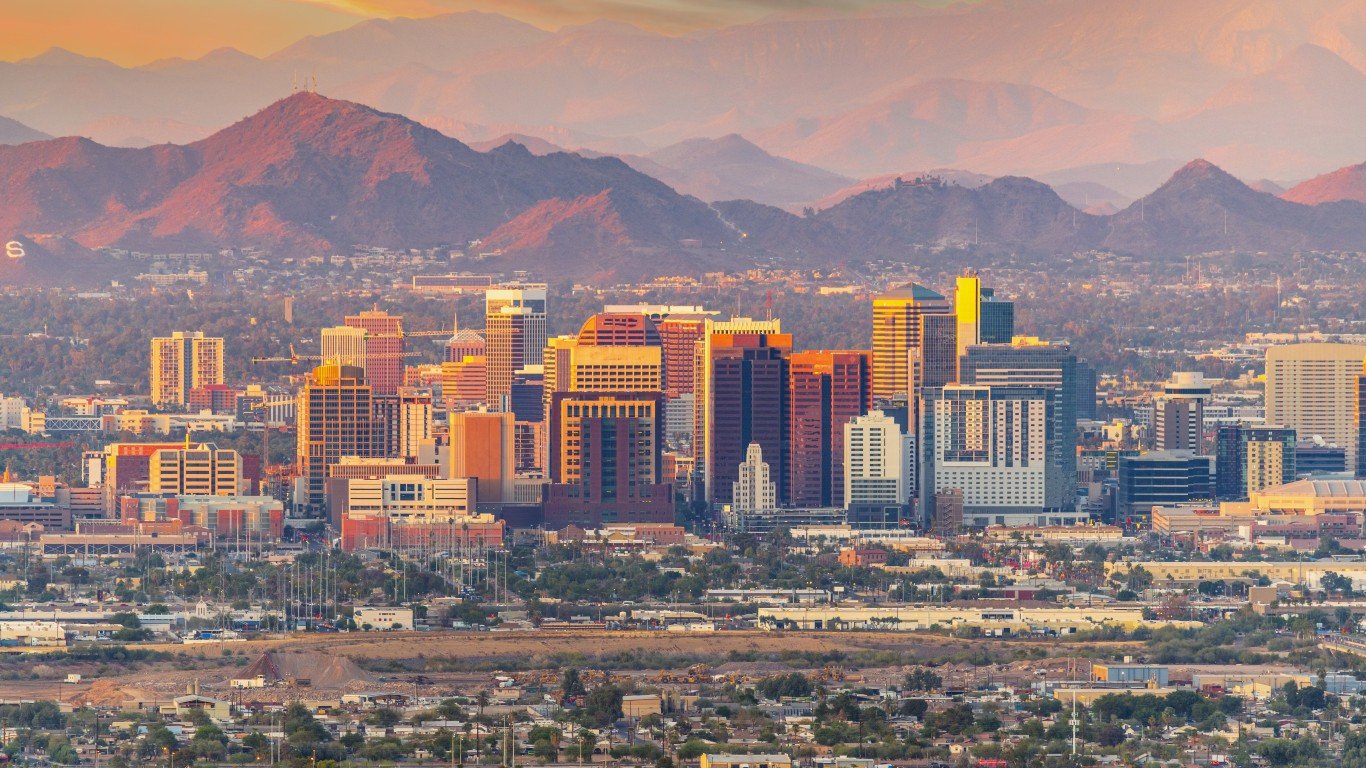
Arizona: Phoenix-Mesa-Chandler:
>Cost of living in Phoenix-Mesa-Chandler: 2.6% more expensive than U.S. avg.
>Cost of living in Arizona: 0.9% less expensive than U.S. avg.
>Poverty rate: 12.7% (state:14.1%)
>Median household income: $67,068 (state: $61,529)

Arkansas: Fayetteville-Springdale-Rogers:
>Cost of living in Fayetteville-Springdale-Rogers: 6.7% less expensive than U.S. avg.
>Cost of living in Arkansas: 10.8% less expensive than U.S. avg.
>Poverty rate: 12.1% (state:16.1%)
>Median household income: $61,761 (state: $49,475)
[in-text-ad-2]

Source: bluejayphoto / iStock via Getty Images
California: San Francisco-Oakland-Berkeley:
>Cost of living in San Francisco-Oakland-Berkeley: 17.4% more expensive than U.S. avg.
>Cost of living in California: 10.4% more expensive than U.S. avg.
>Poverty rate: 17.6% (state:12.6%)
>Median household income: $49,565 (state: $78,672)
Source: milehightraveler / iStock via Getty Images
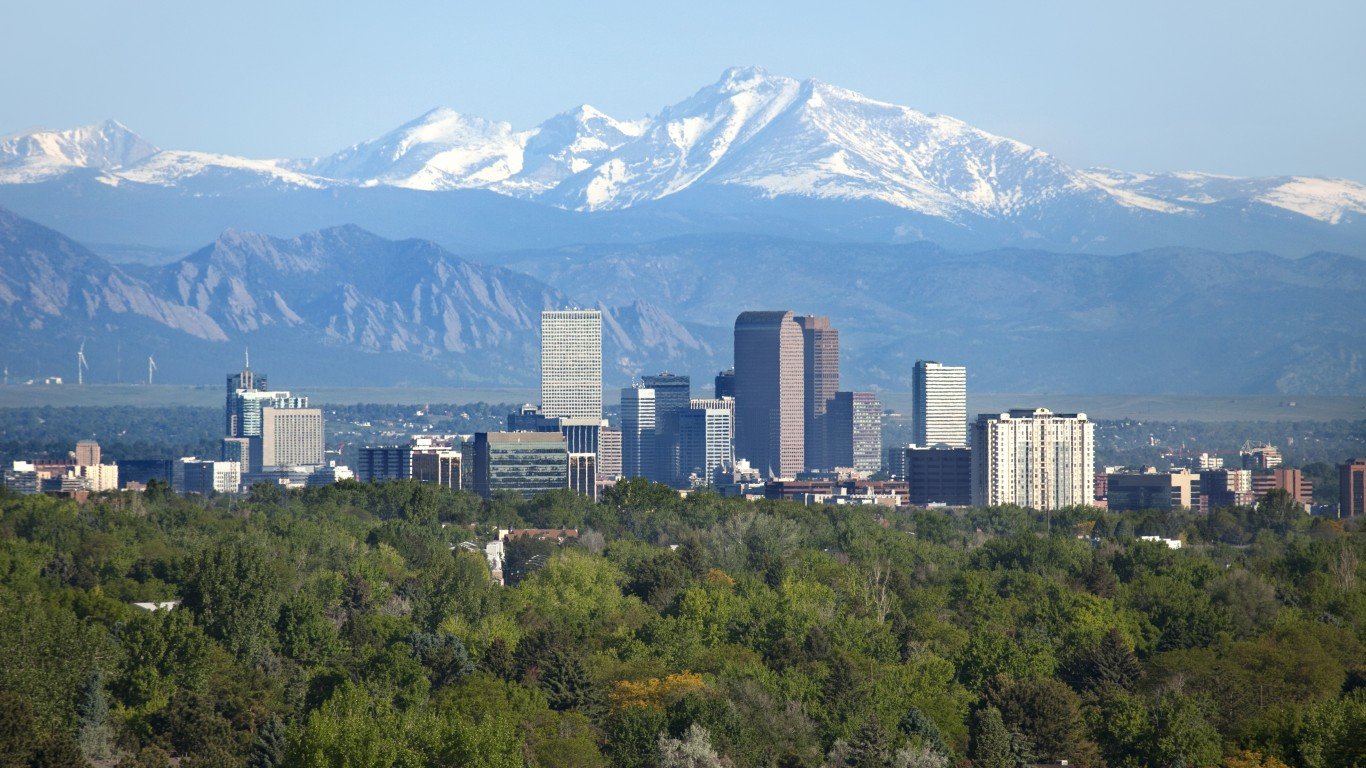
Colorado: Denver-Aurora-Lakewood:
>Cost of living in Denver-Aurora-Lakewood: 7.3% more expensive than U.S. avg.
>Cost of living in Colorado: 2.9% more expensive than U.S. avg.
>Poverty rate: 8.3% (state:9.8%)
>Median household income: $83,289 (state: $75,231)
[in-text-ad]

Connecticut: Bridgeport-Stamford-Norwalk:
>Cost of living in Bridgeport-Stamford-Norwalk: 5.6% more expensive than U.S. avg.
>Cost of living in Connecticut: 3.4% more expensive than U.S. avg.
>Poverty rate: 8.9% (state:9.8%)
>Median household income: $97,539 (state: $79,855)
 24/7 Wall St.
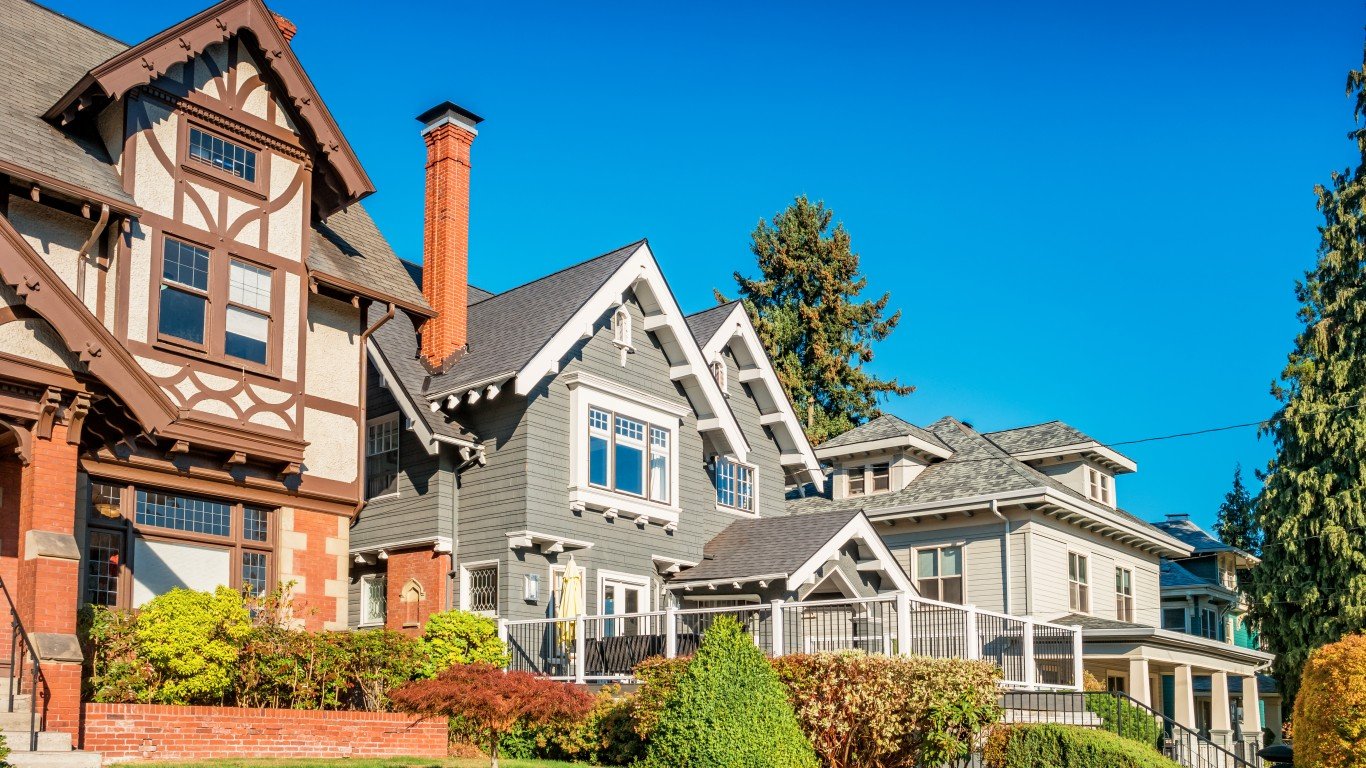
Source: DenisTangneyJr / iStock via Getty Images
Delaware: Dover
>Cost of living in Dover 5.1% less expensive than U.S. avg.
>Cost of living in Delaware: 2.1% less expensive than U.S. avg.
>Poverty rate: 13.2% (state:11.4%)
>Median household income: $60,117 (state: $69,110)
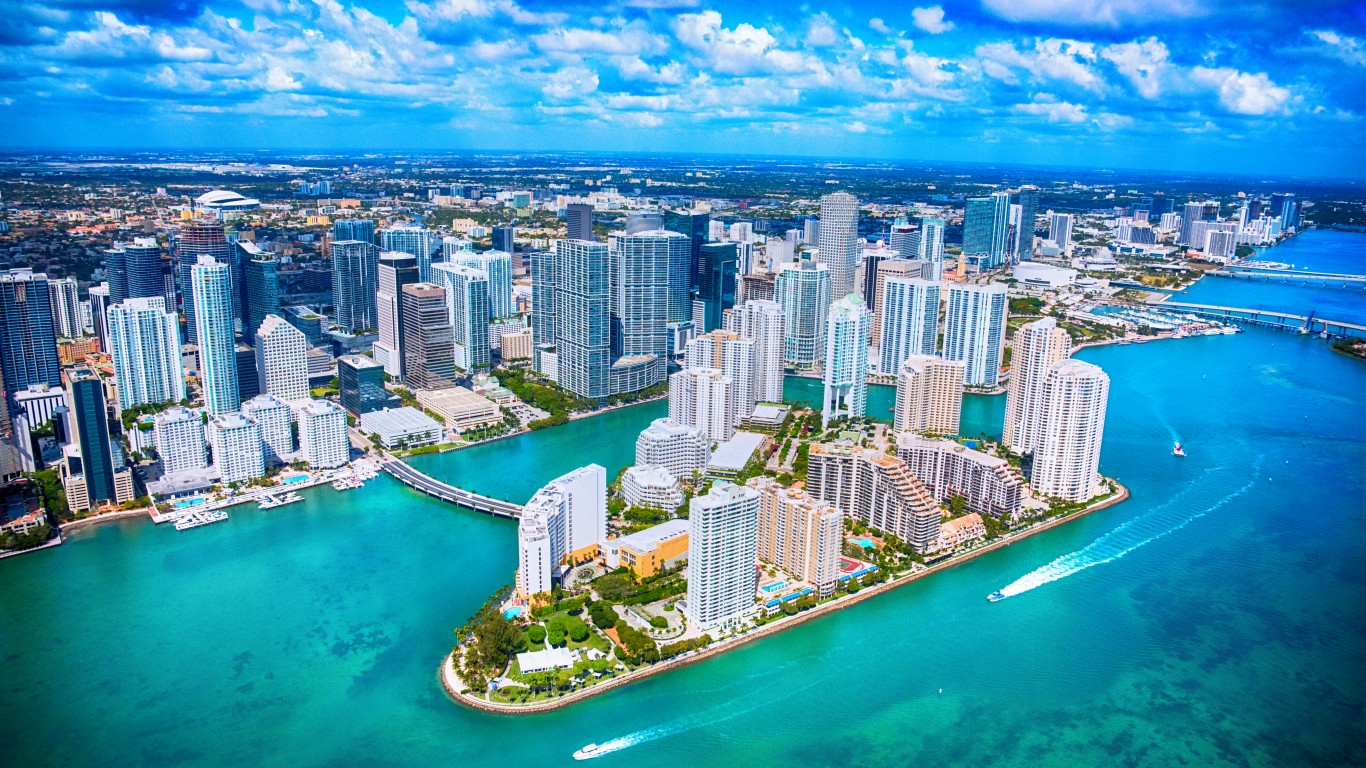
Source: Art Wager / E+ via Getty Images
Florida: Miami-Fort Lauderdale-Pompano Beach
>Cost of living in Miami-Fort Lauderdale-Pompano Beach: 10% more expensive than U.S. avg.
>Cost of living in Florida: 0.7% more expensive than U.S. avg.
>Poverty rate: 13.9% (state:13.3%)
>Median household income: $59,030 (state: $57,703)
[in-text-ad-2]

Source: rodclementphotography / iStock via Getty Images
Georgia: Atlanta-Sandy Springs-Alpharetta:
>Cost of living in Atlanta-Sandy Springs-Alpharetta: 1.8% less expensive than U.S. avg.
>Cost of living in Georgia: 5.5% less expensive than U.S. avg.
>Poverty rate: 11.4% (state:14.3%)
>Median household income: $71,193 (state: $61,224)

Source: Art Wager / iStock via Getty Images
Hawaii: Urban Honolulu:
>Cost of living in Urban Honolulu: 13.8% more expensive than U.S. avg.
>Cost of living in Hawaii: 12% more expensive than U.S. avg.
>Poverty rate: 8.4% (state:9.3%)
>Median household income: $87,722 (state: $83,173)
[in-text-ad]
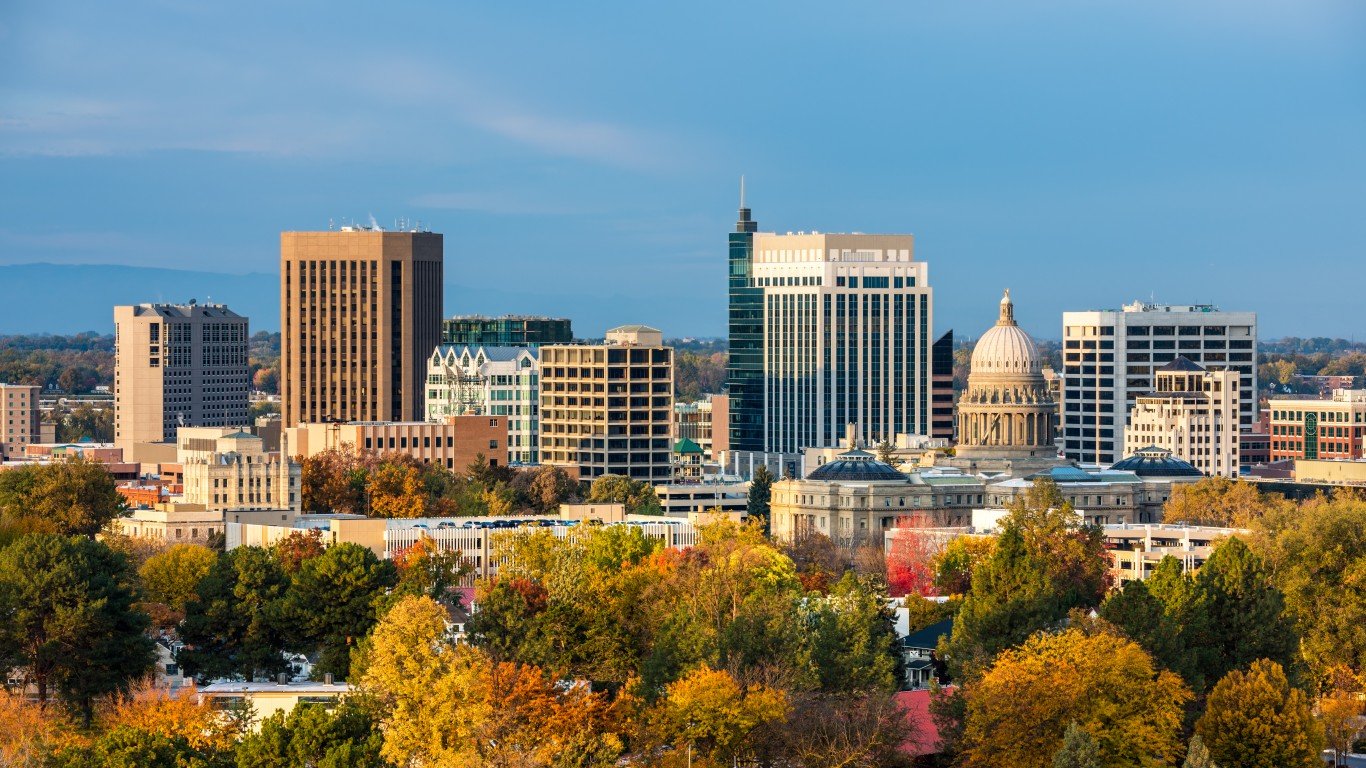
Source: knowlesgallery / iStock via Getty Images
Idaho: Boise City:
>Cost of living in Boise City: 6.5% less expensive than U.S. avg.
>Cost of living in Idaho: 8.8% less expensive than U.S. avg.
>Poverty rate: 10.5% (state:11.9%)
>Median household income: $64,717 (state: $58,915)
 24/7 Wall St.
Source: JaySi / iStock via Getty Images
Illinois: Chicago-Naperville-Elgin:
>Cost of living in Chicago-Naperville-Elgin: 4.8% more expensive than U.S. avg.
>Cost of living in Illinois: 0.5% more expensive than U.S. avg.
>Poverty rate: 11.3% (state:12.0%)
>Median household income: $74,621 (state: $68,428)

Source: Sean Pavone / iStock via Getty Images
Indiana: Indianapolis-Carmel-Anderson:
>Cost of living in Indianapolis-Carmel-Anderson: 5.3% less expensive than U.S. avg.
>Cost of living in Indiana: 7.5% less expensive than U.S. avg.
>Poverty rate: 11.5% (state:12.9%)
>Median household income: $63,545 (state: $58,235)
[in-text-ad-2]
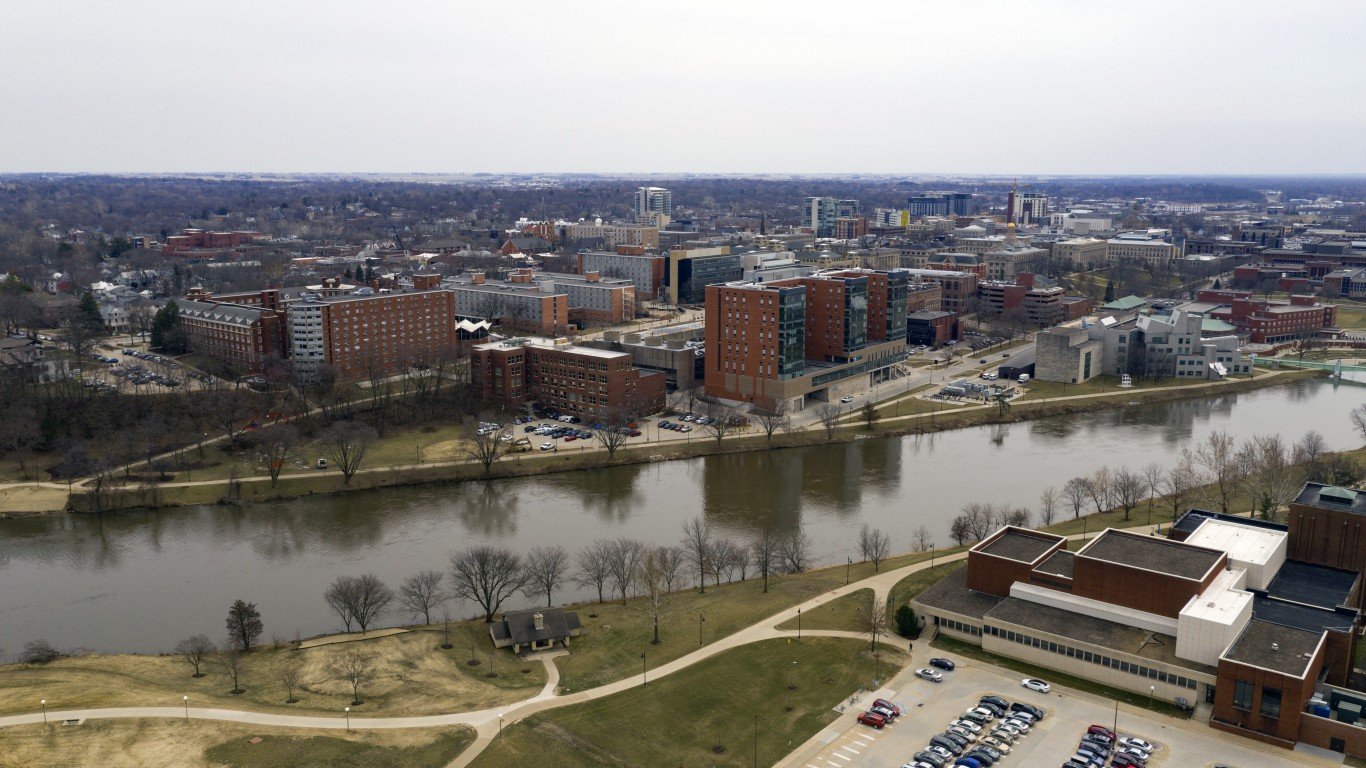
Source: ChrisBoswell / iStock via Getty Images
Iowa: Iowa City:
>Cost of living in Iowa City: 4.7% less expensive than U.S. avg.
>Cost of living in Iowa: 9% less expensive than U.S. avg.
>Poverty rate: 16.0% (state:11.1%)
>Median household income: $63,131 (state: $61,836)
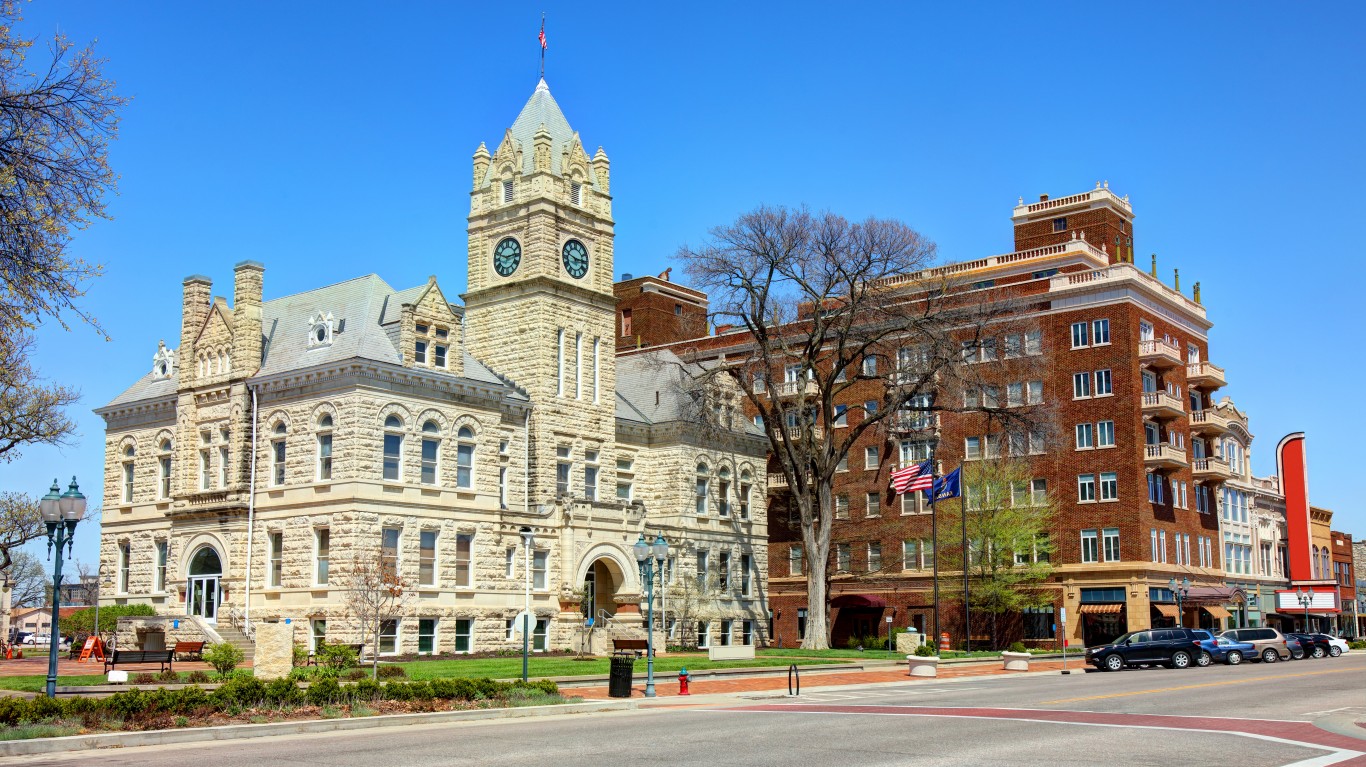
Source: DenisTangneyJr / iStock via Getty Images
Kansas: Manhattan:
>Cost of living in Manhattan: 6.2% less expensive than U.S. avg.
>Cost of living in Kansas: 7.6% less expensive than U.S. avg.
>Poverty rate: 17.8% (state:11.4%)
>Median household income: $54,488 (state: $61,091)
[in-text-ad]
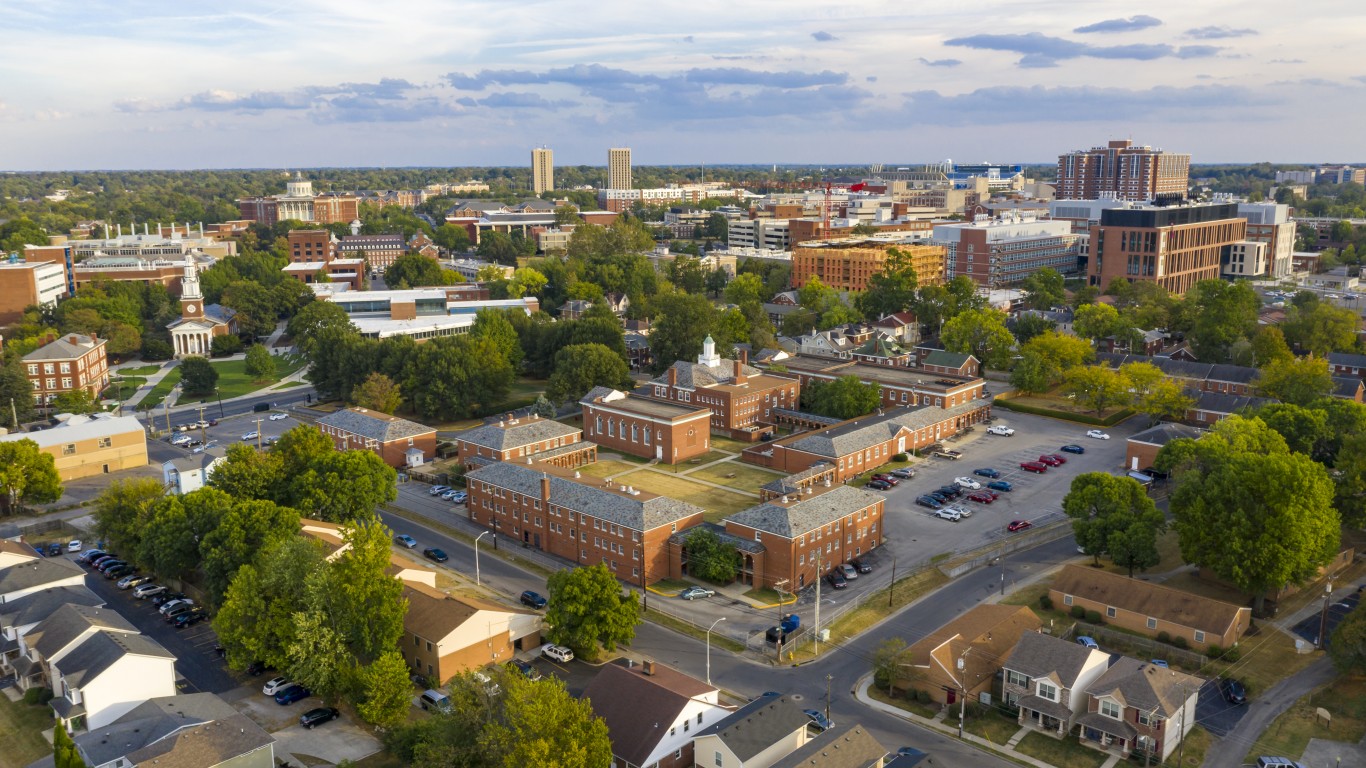
Source: ChrisBoswell / iStock via Getty Images
Kentucky: Lexington-Fayette:
>Cost of living in Lexington-Fayette: 6.8% less expensive than U.S. avg.
>Cost of living in Kentucky: 10.2% less expensive than U.S. avg.
>Poverty rate: 14.5% (state:16.6%)
>Median household income: $60,769 (state: $52,238)

Source: f11photo / iStock via Getty Images
Louisiana: New Orleans-Metairie:
>Cost of living in New Orleans-Metairie: 3.1% less expensive than U.S. avg.
>Cost of living in Louisiana: 7.3% less expensive than U.S. avg.
>Poverty rate: 16.9% (state:18.6%)
>Median household income: $54,388 (state: $50,800)

Source: Jorge Moro / iStock via Getty Images
Maine: Portland-South Portland:
>Cost of living in Portland-South Portland: 0.3% more expensive than U.S. avg.
>Cost of living in Maine: 3.2% less expensive than U.S. avg.
>Poverty rate: 8.1% (state:11.1%)
>Median household income: $72,552 (state: $59,489)
[in-text-ad-2]
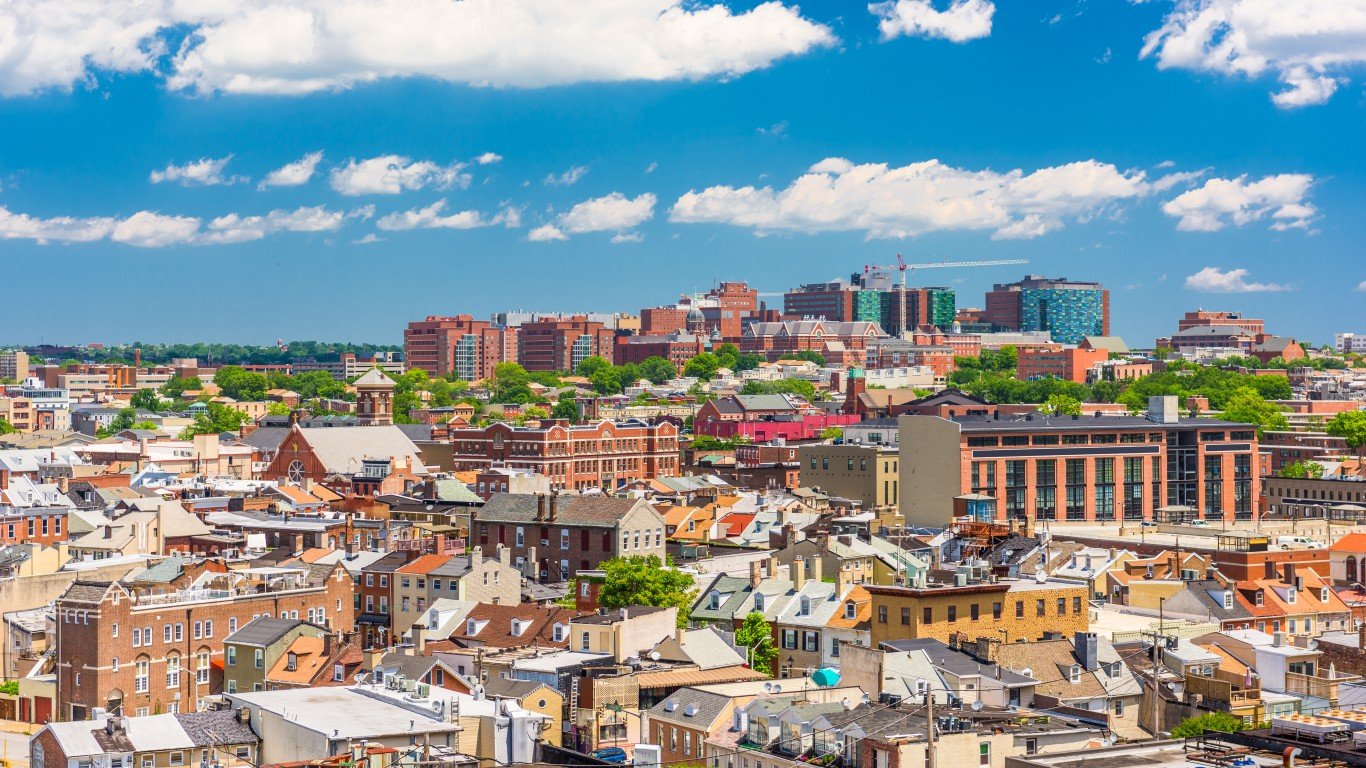
Source: Sean Pavone / iStock via Getty Images
Maryland: Baltimore-Columbia-Towson:
>Cost of living in Baltimore-Columbia-Towson: 5.4% more expensive than U.S. avg.
>Cost of living in Maryland: 6.5% more expensive than U.S. avg.
>Poverty rate: 9.8% (state:9.0%)
>Median household income: $83,811 (state: $87,063)

Source: JohnnyH5 / iStock via Getty Images
Massachusetts: Boston-Cambridge-Newton:
>Cost of living in Boston-Cambridge-Newton: 10.2% more expensive than U.S. avg.
>Cost of living in Massachusetts: 7.4% more expensive than U.S. avg.
>Poverty rate: 9.0% (state:9.8%)
>Median household income: $93,537 (state: $84,385)
[in-text-ad]
Source: Davel5957 / iStock Unreleased via Getty Images
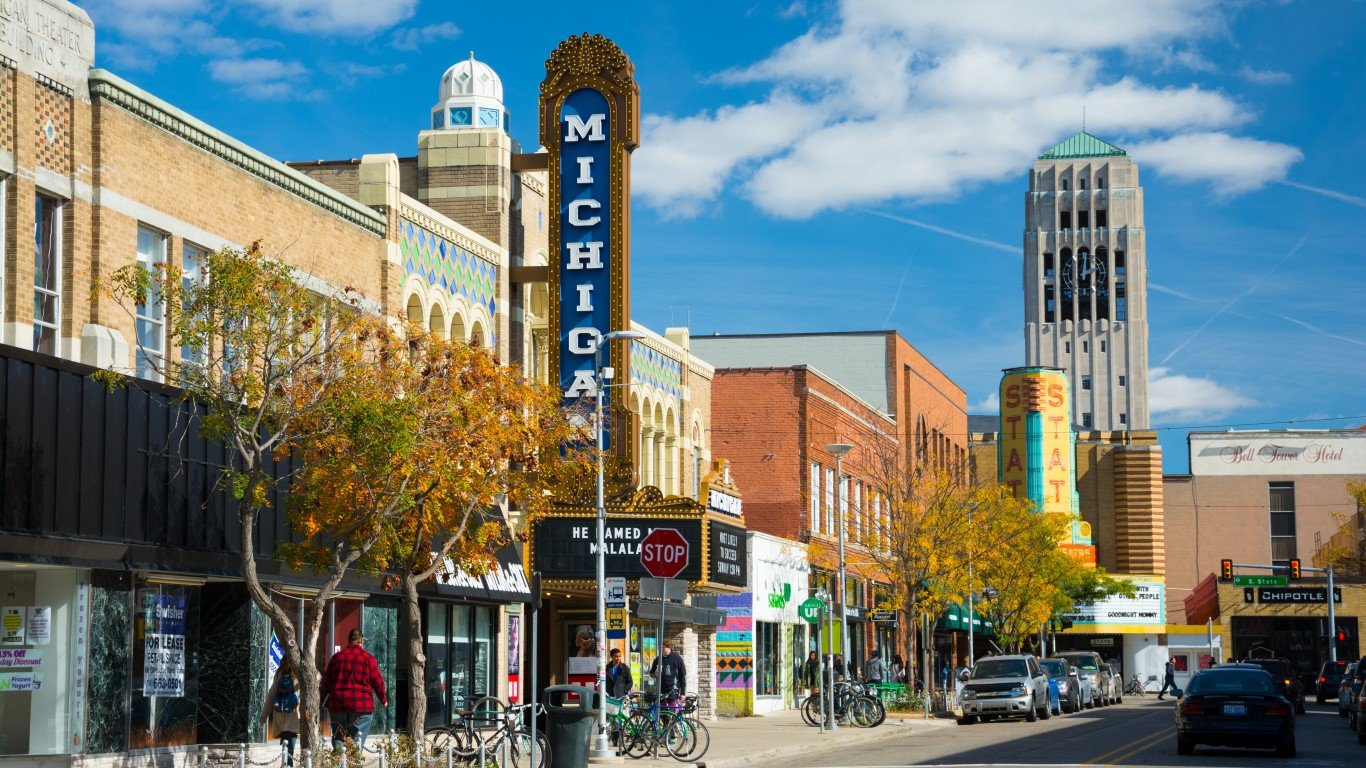
Michigan: Ann Arbor:
>Cost of living in Ann Arbor: 1% less expensive than U.S. avg.
>Cost of living in Michigan: 6% less expensive than U.S. avg.
>Poverty rate: 13.9% (state:13.7%)
>Median household income: $75,730 (state: $59,234)
 24/7 Wall St.
Source: RudyBalasko / iStock via Getty Images
Minnesota: Minneapolis-St. Paul-Bloomington:
>Cost of living in Minneapolis-St. Paul-Bloomington: 3.2% more expensive than U.S. avg.
>Cost of living in Minnesota: 1.4% less expensive than U.S. avg.
>Poverty rate: 8.3% (state:9.3%)
>Median household income: $82,887 (state: $73,382)

Source: dszc / iStock via Getty Images
Mississippi: Gulfport-Biloxi:
>Cost of living in Gulfport-Biloxi: 9.2% less expensive than U.S. avg.
>Cost of living in Mississippi: 12.2% less expensive than U.S. avg.
>Poverty rate: 16.6% (state:19.6%)
>Median household income: $51,058 (state: $46,511)
[in-text-ad-2]

Source: Art Wager / iStock via Getty Images
Missouri: St. Louis:
>Cost of living in St. Louis: 4.3% less expensive than U.S. avg.
>Cost of living in Missouri: 7.5% less expensive than U.S. avg.
>Poverty rate: 15.3% (state:13.0%)
>Median household income: $51,504 (state: $57,290)
Source: peeterv / iStock via Getty Images
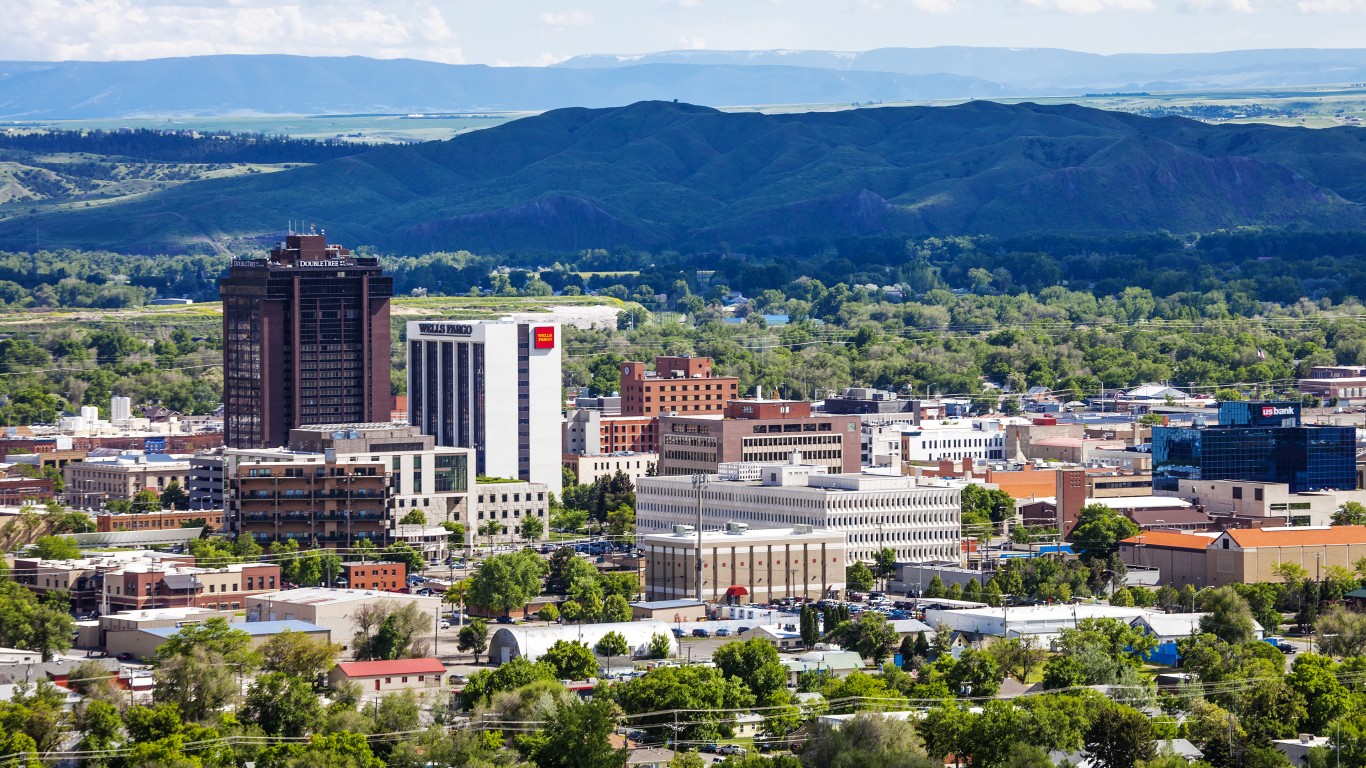
Montana: Billings:
>Cost of living in Billings: 6.3% less expensive than U.S. avg.
>Cost of living in Montana: 7.6% less expensive than U.S. avg.
>Poverty rate: 9.5% (state:12.8%)
>Median household income: $62,722 (state: $56,539)
[in-text-ad]

Nebraska: Omaha-Council Bluffs:
>Cost of living in Omaha-Council Bluffs: 4.7% less expensive than U.S. avg.
>Cost of living in Nebraska: 7.1% less expensive than U.S. avg.
>Poverty rate: 9.3% (state:10.4%)
>Median household income: $69,439 (state: $63,015)

Source: Rex_Wholster / iStock via Getty Images
Nevada: Reno:
>Cost of living in Reno: 1.1% less expensive than U.S. avg.
>Cost of living in Nevada: 2.9% less expensive than U.S. avg.
>Poverty rate: 10.9% (state:12.8%)
>Median household income: $68,214 (state: $62,043)

Source: Sean Pavone / iStock via Getty Images
New Hampshire: Manchester-Nashua:
>Cost of living in Manchester-Nashua: 4% more expensive than U.S. avg.
>Cost of living in New Hampshire: 3.7% more expensive than U.S. avg.
>Poverty rate: 7.4% (state:7.4%)
>Median household income: $82,099 (state: $77,923)
[in-text-ad-2]

Source: ChrisBoswell / iStock via Getty Images
New Jersey: Trenton-Princeton:
>Cost of living in Trenton-Princeton: 3.8% more expensive than U.S. avg.
>Cost of living in New Jersey: 11.2% more expensive than U.S. avg.
>Poverty rate: 11.1% (state:9.7%)
>Median household income: $83,306 (state: $85,245)
Source: Sean Pavone / iStock via Getty Images
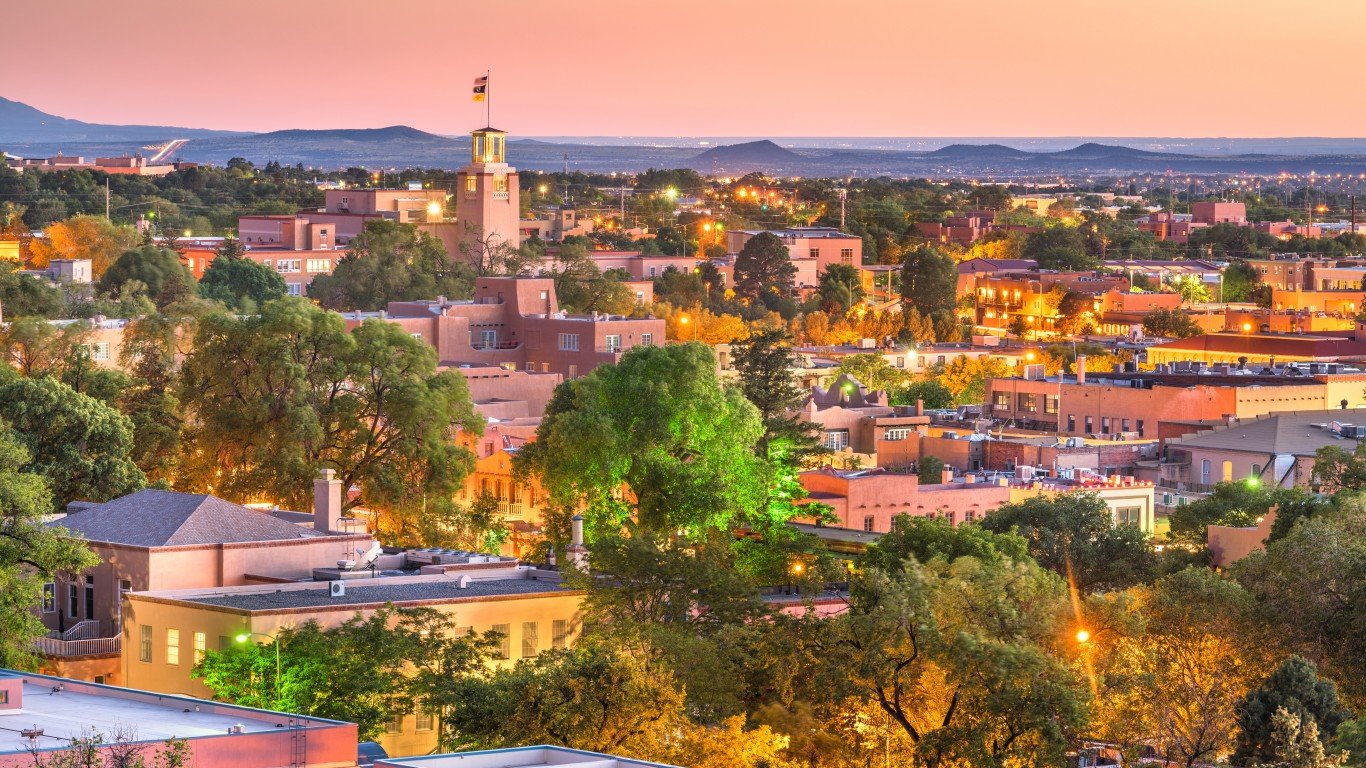
New Mexico: Santa Fe:
>Cost of living in Santa Fe: 5.6% less expensive than U.S. avg.
>Cost of living in New Mexico: 8.4% less expensive than U.S. avg.
>Poverty rate: 13.0% (state:18.6%)
>Median household income: $60,668 (state: $51,243)
[in-text-ad]

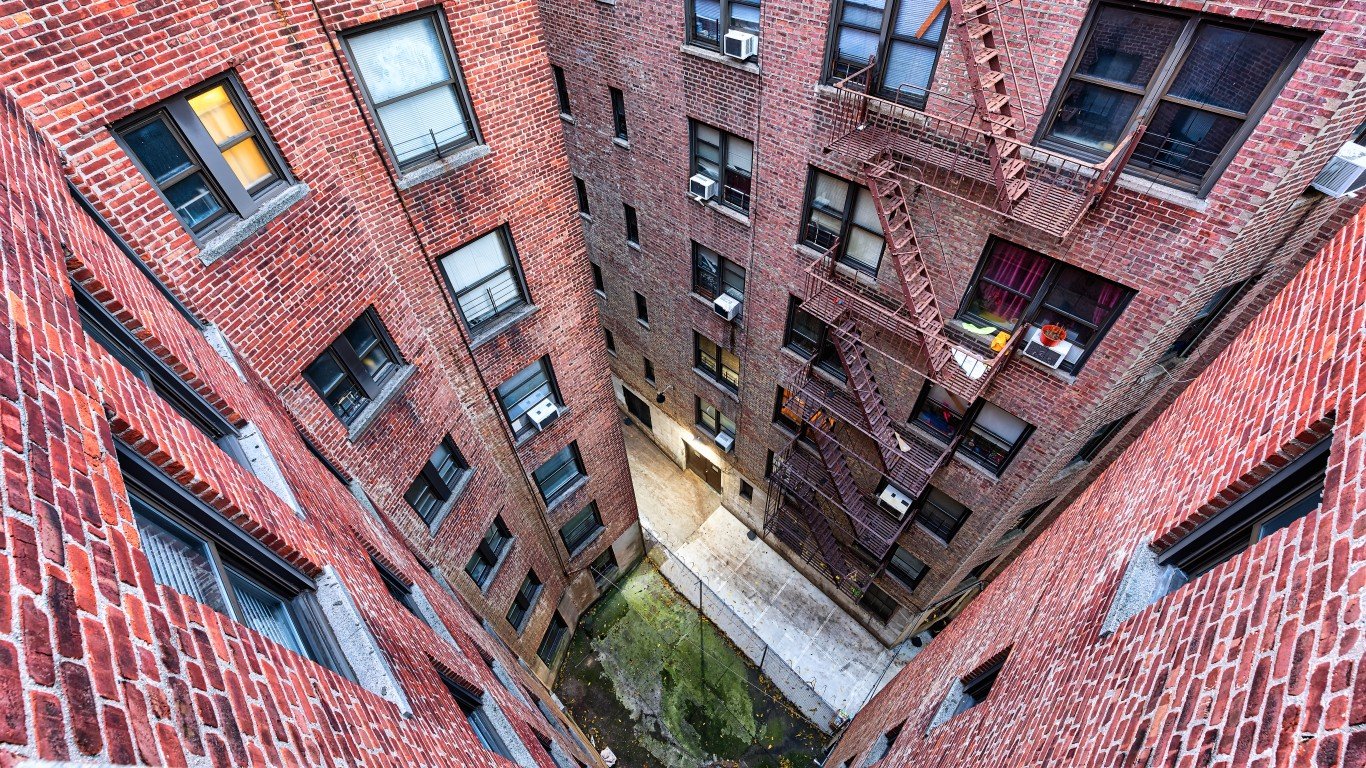
Source: TomasSereda / iStock via Getty Images
New York: New York-Newark-Jersey City:
>Cost of living in New York-Newark-Jersey City: 15.5% more expensive than U.S. avg.
>Cost of living in New York: 10.2% more expensive than U.S. avg.
>Poverty rate: 12.4% (state:13.6%)
>Median household income: $81,951 (state: $71,117)

Source: Kruck20 / iStock via Getty Images
North Carolina: Raleigh-Cary:
>Cost of living in Raleigh-Cary: 4.3% less expensive than U.S. avg.
>Cost of living in North Carolina: 8.2% less expensive than U.S. avg.
>Poverty rate: 9.2% (state:14.0%)
>Median household income: $78,706 (state: $56,642)

Source: Nathan Livedalen / iStock via Getty Images
North Dakota: Bismarck:
>Cost of living in Bismarck: 5.8% less expensive than U.S. avg.
>Cost of living in North Dakota: 8% less expensive than U.S. avg.
>Poverty rate: 7.6% (state:10.5%)
>Median household income: $72,886 (state: $65,315)
[in-text-ad-2]

Source: Sean Pavone / iStock via Getty Images
Ohio: Columbus:
>Cost of living in Columbus: 5.8% less expensive than U.S. avg.
>Cost of living in Ohio: 8.3% less expensive than U.S. avg.
>Poverty rate: 12.7% (state:13.6%)
>Median household income: $66,715 (state: $58,116)

Source: Sean Pavone / iStock via Getty Images
Oklahoma: Oklahoma City:
>Cost of living in Oklahoma City: 6.2% less expensive than U.S. avg.
>Cost of living in Oklahoma: 8.7% less expensive than U.S. avg.
>Poverty rate: 13.5% (state:15.3%)
>Median household income: $60,476 (state: $53,840)
[in-text-ad]

Oregon: Portland-Vancouver-Hillsboro:
>Cost of living in Portland-Vancouver-Hillsboro: 5.7% more expensive than U.S. avg.
>Cost of living in Oregon: 2.6% more expensive than U.S. avg.
>Poverty rate: 10.1% (state:12.4%)
>Median household income: $77,511 (state: $65,667)
Source: peeterv / E+ via Getty Images
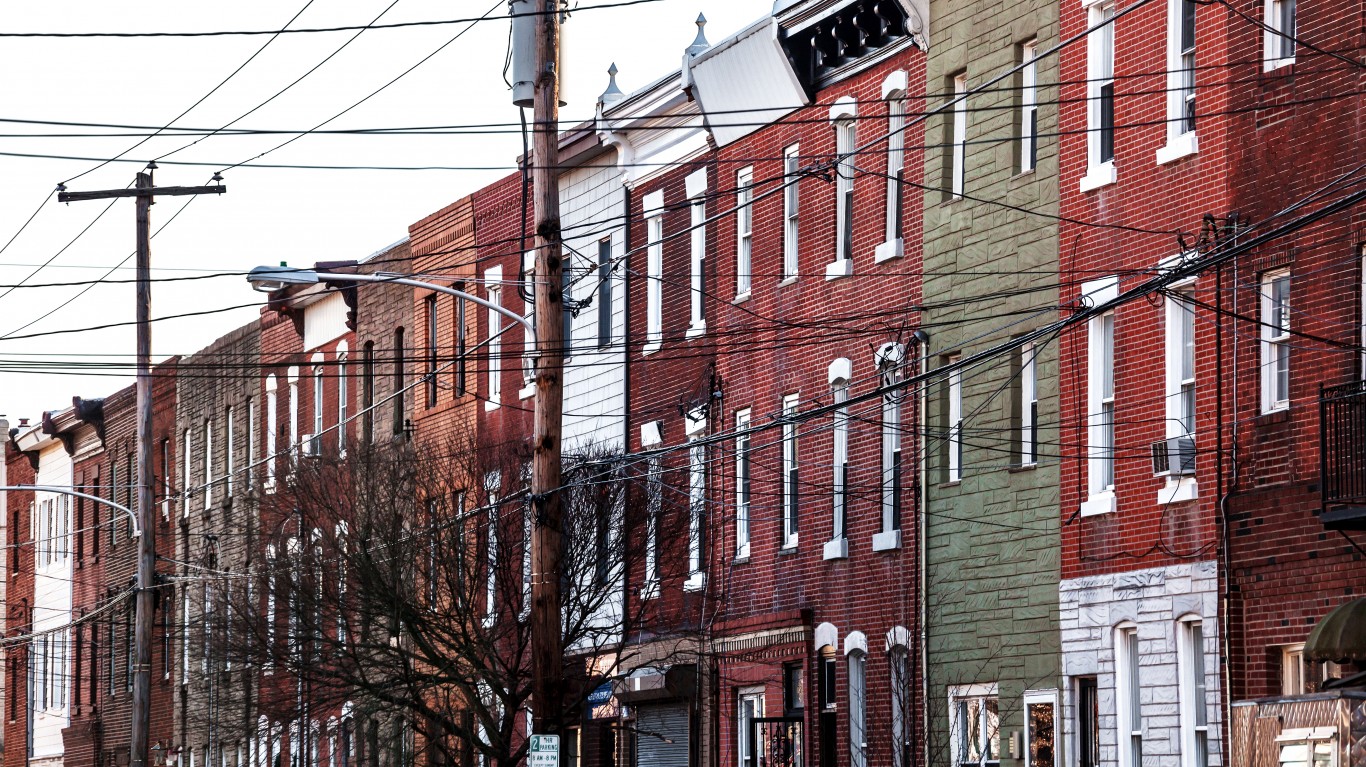
Pennsylvania: Philadelphia-Camden-Wilmington:
>Cost of living in Philadelphia-Camden-Wilmington: 2.3% more expensive than U.S. avg.
>Cost of living in Pennsylvania: 2.4% less expensive than U.S. avg.
>Poverty rate: 11.9% (state:12.4%)
>Median household income: $74,825 (state: $65,667)

Source: SeanPavonePhoto / iStock via Getty Images
Rhode Island: Providence-Warwick:
>Cost of living in Providence-Warwick: 1.2% more expensive than U.S. avg.
>Cost of living in Rhode Island: 1.8% more expensive than U.S. avg.
>Poverty rate: 11.3% (state:11.6%)
>Median household income: $70,676 (state: $70,305)
[in-text-ad-2]

Source: Sean Pavone / iStock via Getty Images
South Carolina: Hilton Head Island-Bluffton:
>Cost of living in Hilton Head Island-Bluffton: 2% less expensive than U.S. avg.
>Cost of living in South Carolina: 8.4% less expensive than U.S. avg.
>Poverty rate: 10.6% (state:14.7%)
>Median household income: $67,723 (state: $54,864)
Source: DenisTangneyJr / iStock via Getty Images
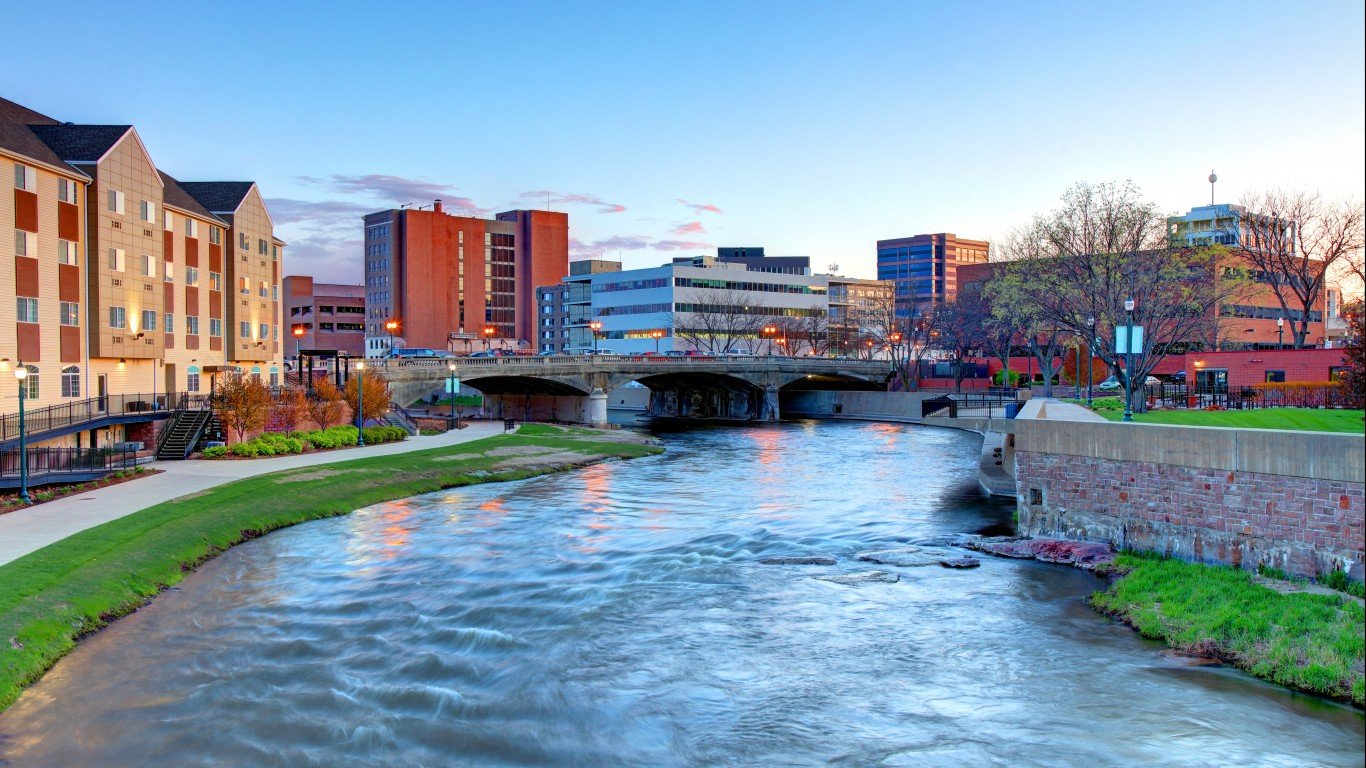
South Dakota: Sioux Falls:
>Cost of living in Sioux Falls: 5.9% less expensive than U.S. avg.
>Cost of living in South Dakota: 8.5% less expensive than U.S. avg.
>Poverty rate: 8.2% (state:12.8%)
>Median household income: $67,713 (state: $59,896)
[in-text-ad]

Source: Kruck20 / iStock via Getty Images
Tennessee: Nashville
>Cost of living in Nashville metro area: 3%less expensive than U.S. avg.
>Cost of living in Tennessee: 7.8% less expensive than U.S. avg.
>Poverty rate: 11.0% (state:12.8%)
>Median household income: $68,406 (state: $59,896)
 24/7 Wall St.
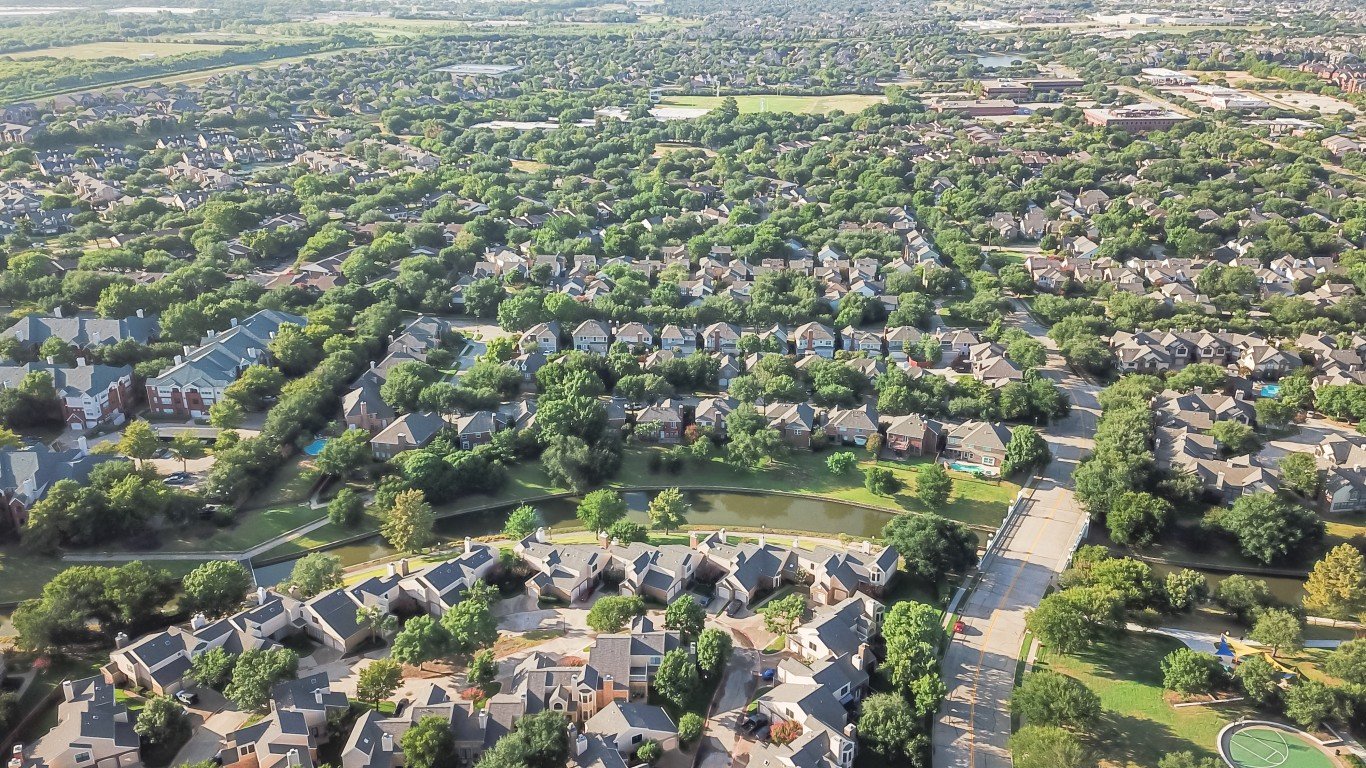
Source: TrongNguyen / iStock via Getty Images
Texas: Dallas-Fort Worth-Arlington:
>Cost of living in Dallas-Fort Worth-Arlington: 5.1% more expensive than U.S. avg.
>Cost of living in Texas: 0.5% less expensive than U.S. avg.
>Poverty rate: 11.1% (state:14.2%)
>Median household income: $72,882 (state: $63,826)

Source: Sean Pavone / iStock via Getty Images
Utah: Salt Lake City:
>Cost of living in Salt Lake City: 2.3% less expensive than U.S. avg.
>Cost of living in Utah: 4.7% less expensive than U.S. avg.
>Poverty rate: 17.6% (state:9.1%)
>Median household income: $49,565 (state: $74,197)
[in-text-ad-2]
Source: SeanPavonePhoto / iStock via Getty Images
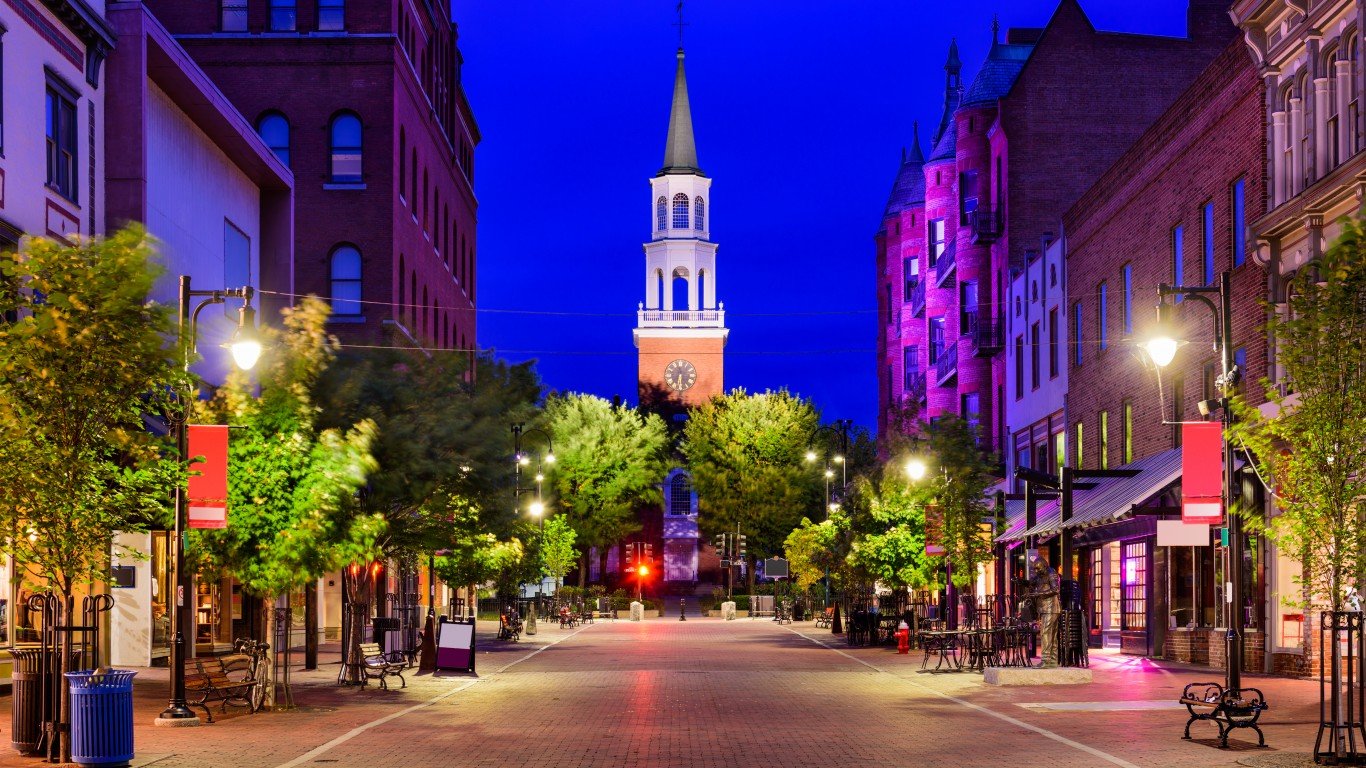
Vermont: Burlington-South Burlington:
>Cost of living in Burlington-South Burlington: 2.3% more expensive than U.S. avg.
>Cost of living in Vermont: 0.7% less expensive than U.S. avg.
>Poverty rate: 10.7% (state:10.8%)
>Median household income: $73,447 (state: $63,477)

Source: DenisTangneyJr / iStock via Getty Images
Virginia: Charlottesville:
>Cost of living in Charlottesville: 3.4% less expensive than U.S. avg.
>Cost of living in Virginia: 1% more expensive than U.S. avg.
>Poverty rate: 11.1% (state:10.0%)
>Median household income: $75,176 (state: $76,398)
[in-text-ad]

Source: roman_slavik / iStock via Getty Images
Washington: Seattle-Tacoma-Bellevue:
>Cost of living in Seattle-Tacoma-Bellevue: 12% more expensive than U.S. avg.
>Cost of living in Washington: 7.4% more expensive than U.S. avg.
>Poverty rate: 8.4% (state:10.2%)
>Median household income: $90,790 (state: $77,006)
Source: ChrisBoswell / iStock via Getty Images
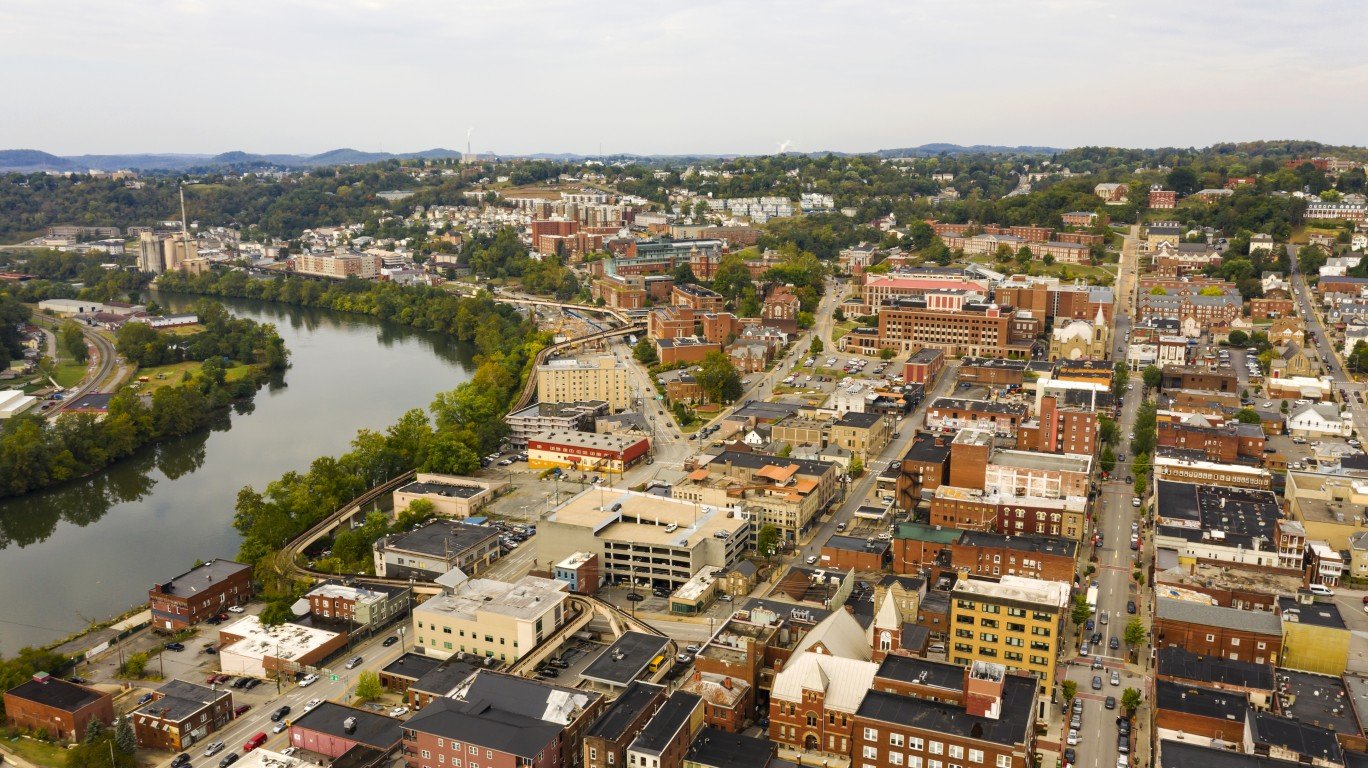
West Virginia: Morgantown:
>Cost of living in Morgantown: 7.8% less expensive than U.S. avg.
>Cost of living in West Virginia: 12% less expensive than U.S. avg.
>Poverty rate: 19.1% (state:17.1%)
>Median household income: $53,681 (state: $48,037)
Source: Sean Pavone / iStock via Getty Images
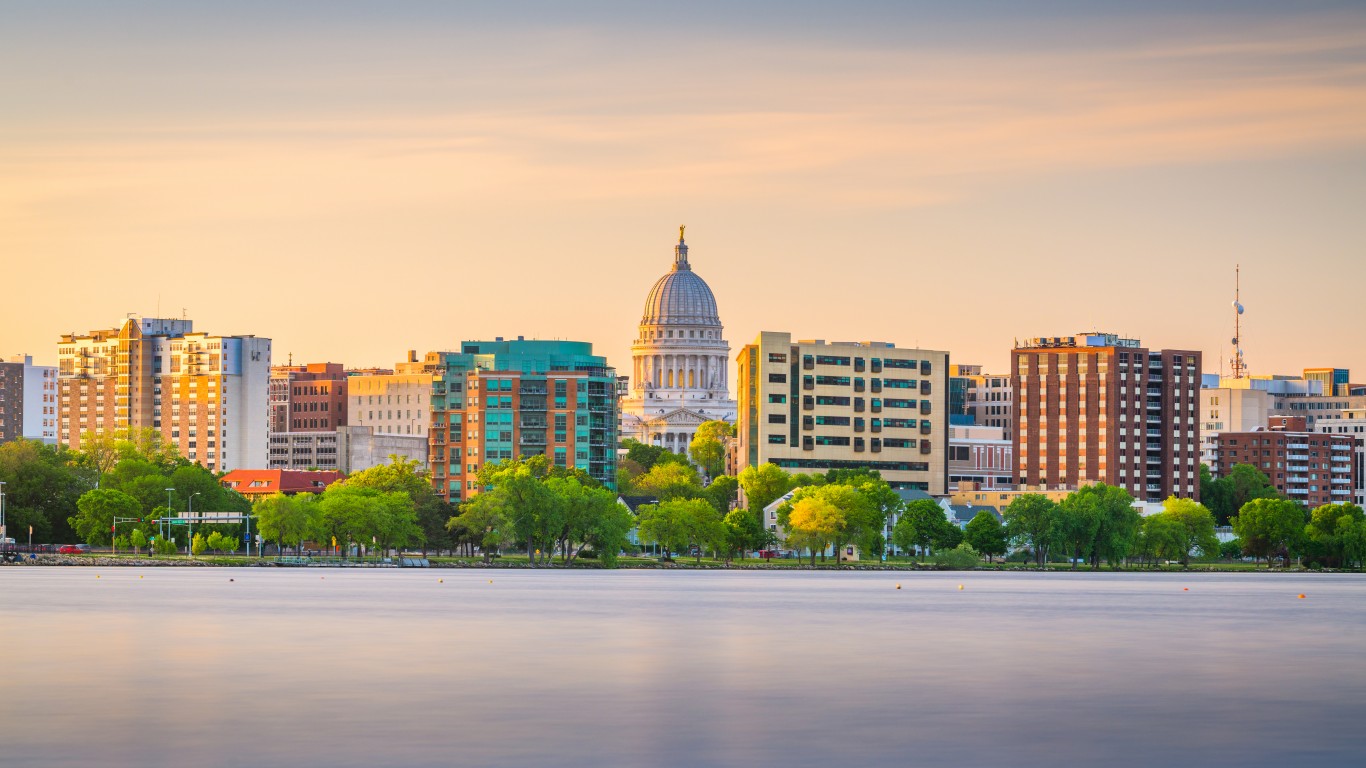
Wisconsin: Madison:
>Cost of living in Madison: 3% less expensive than U.S. avg.
>Cost of living in Wisconsin: 6.8% less expensive than U.S. avg.
>Poverty rate: 10.4% (state:11.0%)
>Median household income: $73,807 (state: $63,293)
[in-text-ad-2]
Source: Davel5957 / iStock via Getty Images
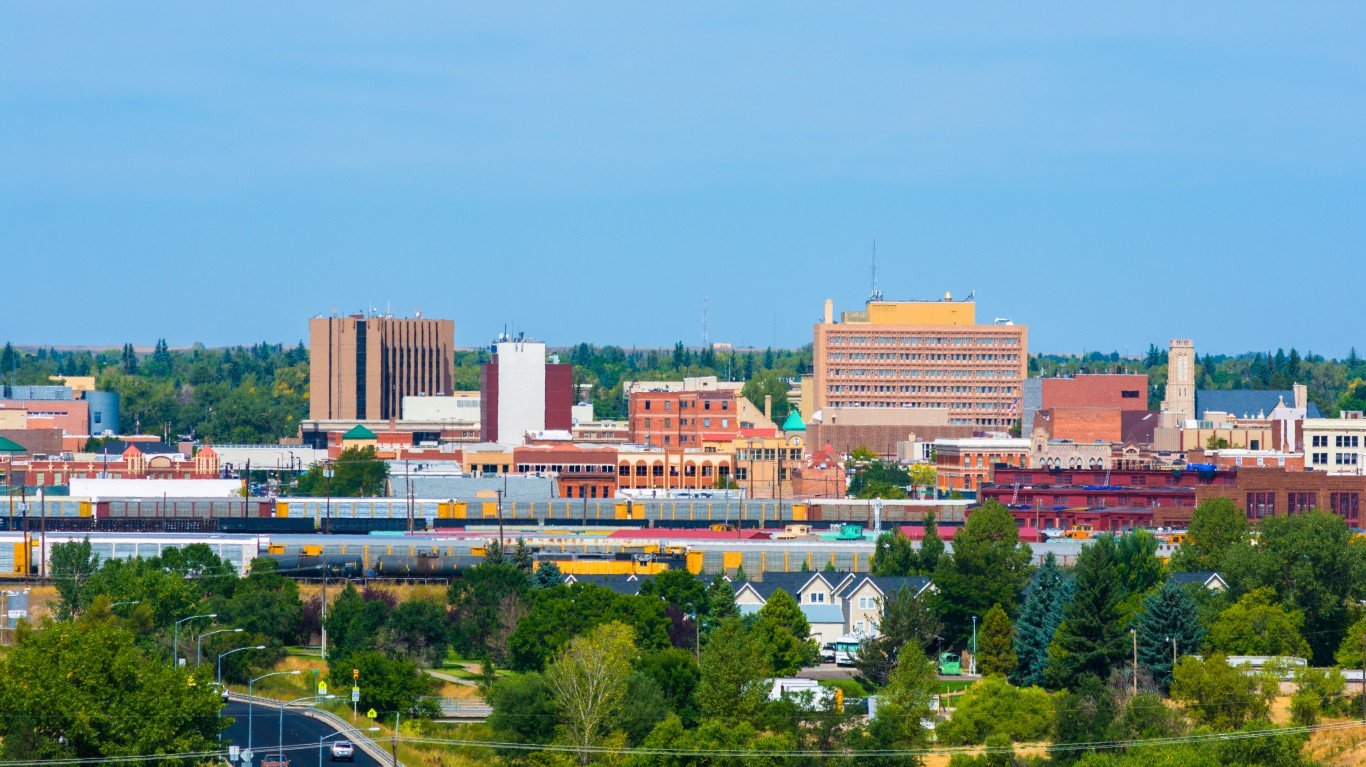
Wyoming: Cheyenne:
>Cost of living in Cheyenne: 6.8% less expensive than U.S. avg.
>Cost of living in Wyoming: 7.7% less expensive than U.S. avg.
>Poverty rate: 8.9% (state:10.8%)
>Median household income: $69,369 (state: $65,304)
Sponsored: Want to Retire Early? Here’s a Great First Step
Want retirement to come a few years earlier than you’d planned? Or are you ready to retire now, but want an extra set of eyes on your finances?
Now you can speak with up to 3 financial experts in your area for FREE. By simply clicking here you can begin to match with financial professionals who can help you build your plan to retire early. And the best part? The first conversation with them is free.
Click here to match with up to 3 financial pros who would be excited to help you make financial decisions.
Thank you for reading! Have some feedback for us?
Contact the 24/7 Wall St. editorial team.