This coming Monday is Juneteenth, a time when Americans celebrate the end of slavery in the United States. It is also a time to recognize the inequalities that still exist in this country.
Black Americans are underrepresented in entrepreneurship. The Black population in the U.S. accounted for 12.6% of the population in 2020, but the percentage of businesses with Black owners was only 2.3%, according to Brookings. Centuries of racist policies have contributed to a wealth gap that negatively affects would-be Black business owners. (These policies have had more damaging effects in certain areas. Here are the worst cities for Black Americans.)
The average net worth of white families is over seven times greater than the net worth of Black families, according to Brookings, and family wealth is one major determining factor in business ownership. While Black entrepreneurs start businesses with an average of $35,000, white entrepreneurs are able to start a business with an average of $107,000, the Stanford Institute for Economic Policy Research found in 2017.
The good news is that the rate of Black business ownership is on the rise. Although Black business owners were hit the hardest at the beginning of the pandemic, according to census data, there is a recovery. In the third quarter of 2021, there were 28% more Black-owned businesses than before the pandemic. (Here are 20 Black-owned wineries you should know.)
To determine the cities with the most Black-owned businesses, 24/7 Wall St. reviewed data on businesses with more than one employee from the U.S. Census Bureau’s 2021 Annual Business Survey. Metropolitan areas were ranked based on the percentage of employer companies owned by individuals who identify as Black or African American.
In all the cities on the list, the percentage of the Black population is higher than the national average – in some cases three or four times higher. Most are in the South. The Black population in cities including Albany, Georgia; Pine Bluff, Arkansas; Memphis, Tennessee; and Columbus, Georgia account for over 40% of the total population. While Georgia, Louisiana, and Virginia have three cities each on the list, Florida has five.
Despite the upward trend, Black entrepreneurs still face hurdles in accessing startup capital. They are denied loans at about twice the rate of white entrepreneurs, according to the federal reserve. If the percentage of Black-owned businesses were proportionate to the population, these establishments would create nearly 7 million more job opportunities and generate an additional $733 billion in revenue. (Here are America’s best companies to work for according to Black workers.)
Click here to see the cities with the most black-owned businesses.
Click here to read our detailed methodology.
Source: ehrlif / iStock Editorial via Getty Images
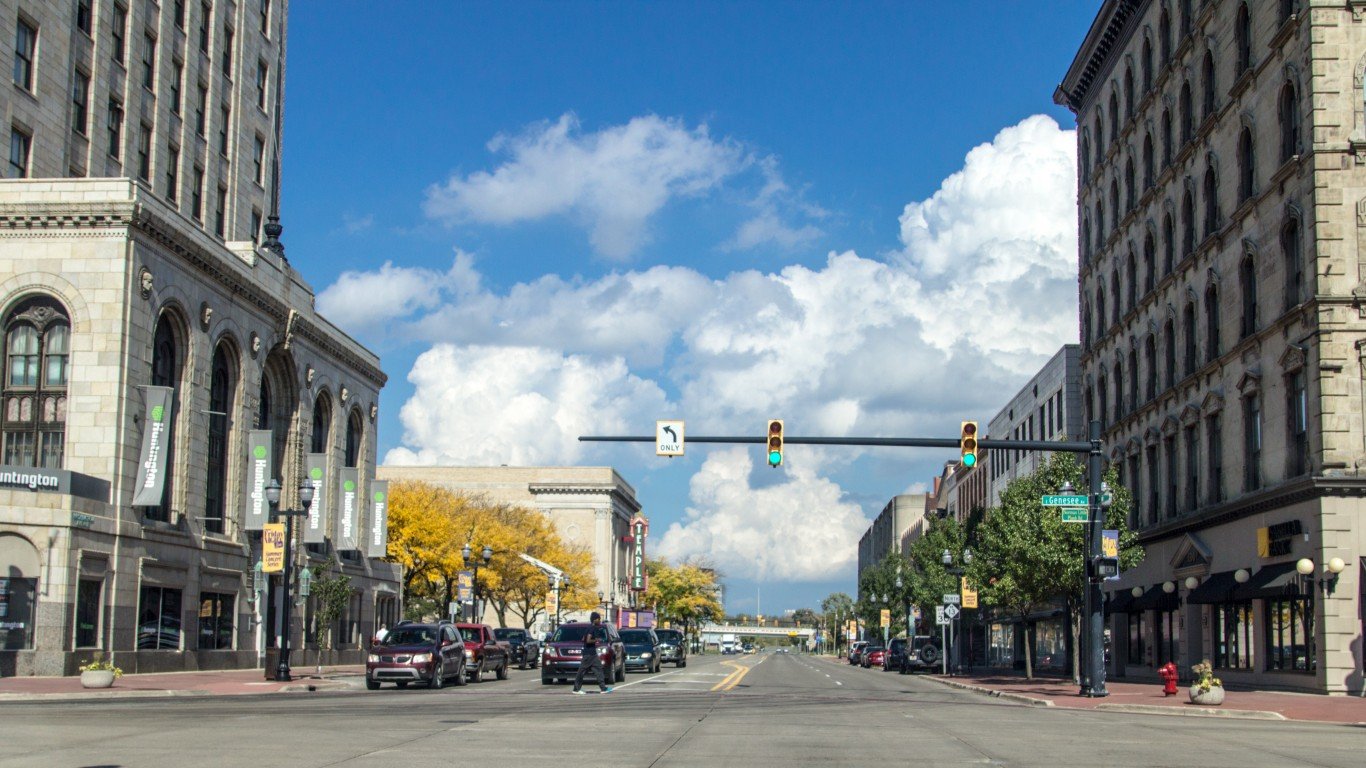
25. Saginaw, MI
> Firms owned by Black residents: 3.1% (117)
> Black population share: 19.0% (36,205)
> Black median household income: $33,532 (vs. $52,749 for all races)
> Black homeownership rate: 50.0% (vs. 72.1% for all races)
[in-text-ad]
Source: Sean Pavone / iStock via Getty Images
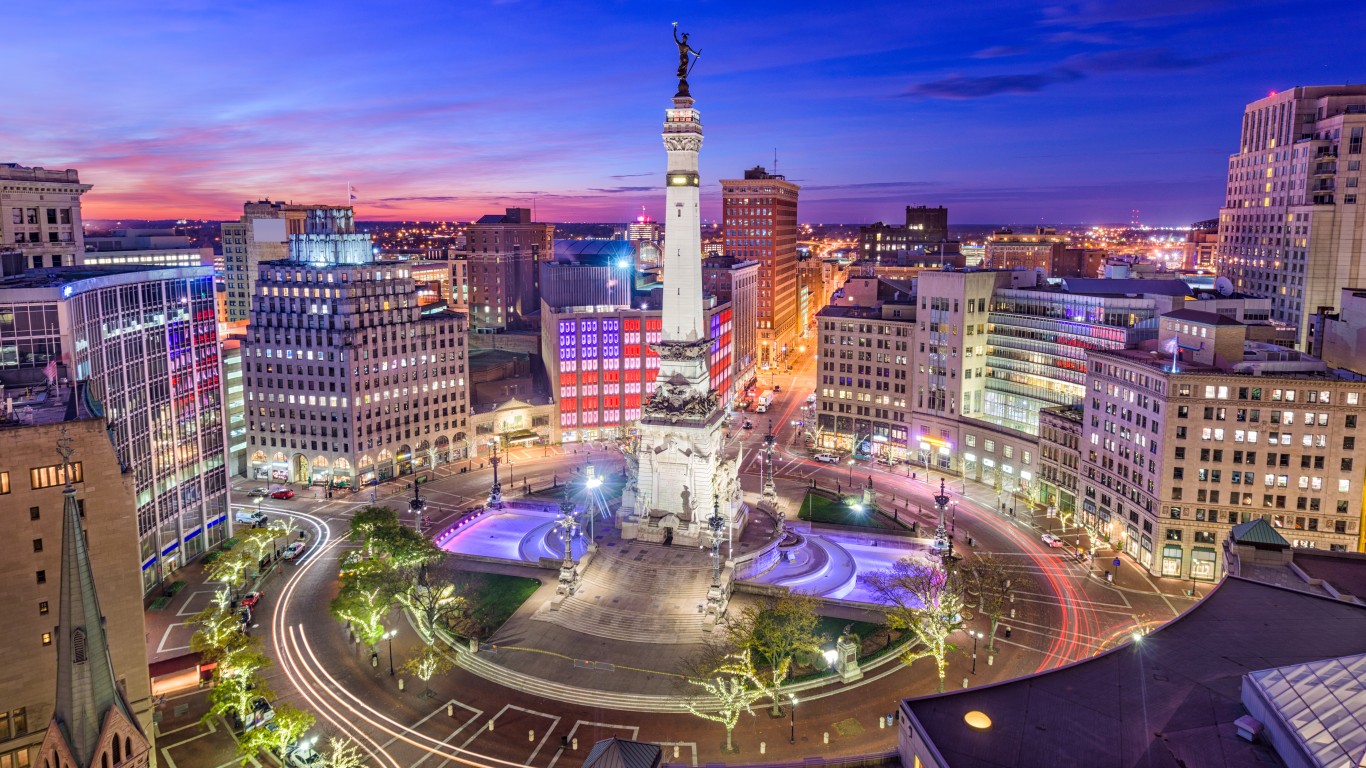
24. Indianapolis-Carmel-Anderson, IN
> Firms owned by Black residents: 3.3% (1,113)
> Black population share: 15.2% (318,341)
> Black median household income: $40,282 (vs. $67,330 for all races)
> Black homeownership rate: 36.8% (vs. 66.0% for all races)
 24/7 Wall St.
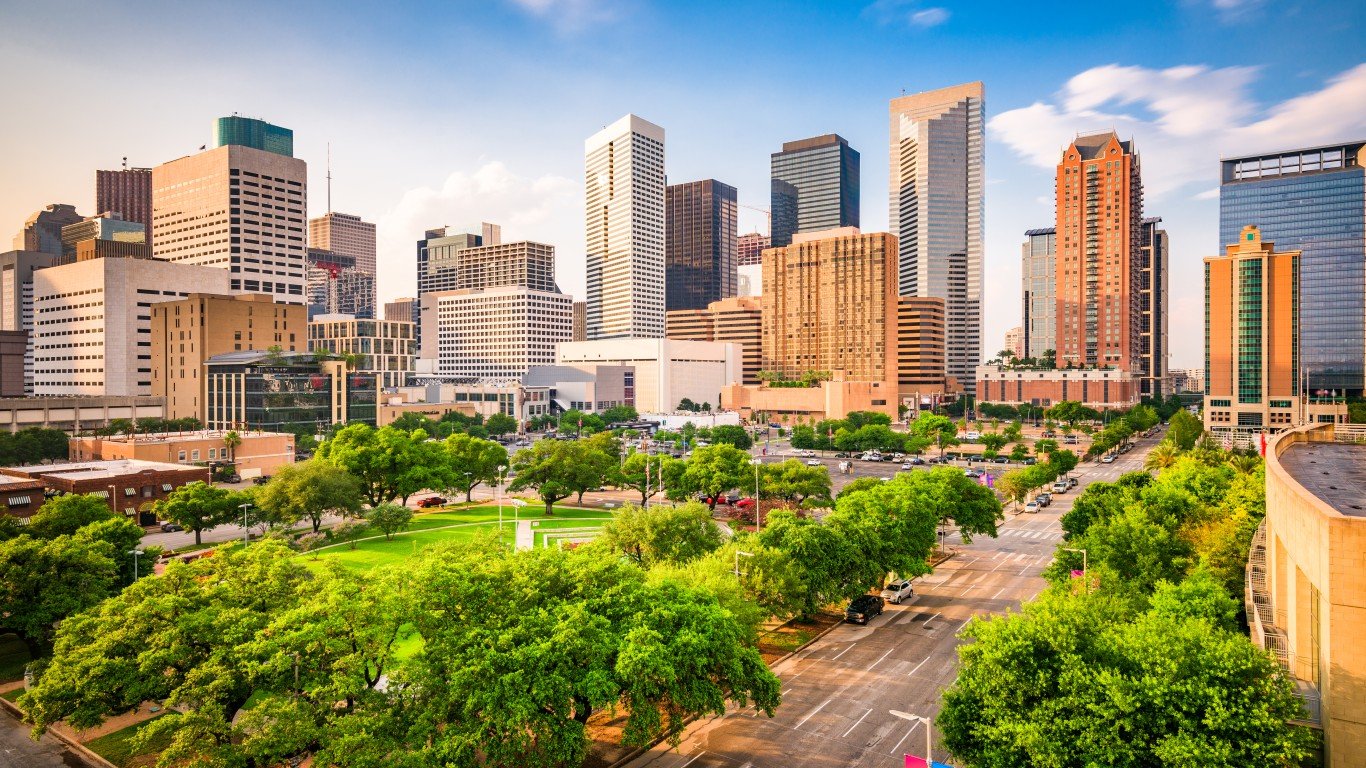
Source: Sean Pavone / iStock via Getty Images
23. Houston-The Woodlands-Sugar Land, TX
> Firms owned by Black residents: 3.3% (3,586)
> Black population share: 17.2% (1,210,170)
> Black median household income: $53,801 (vs. $72,551 for all races)
> Black homeownership rate: 42.5% (vs. 61.2% for all races)

22. Killeen-Temple, TX
> Firms owned by Black residents: 3.4% (165)
> Black population share: 21.1% (98,852)
> Black median household income: $49,741 (vs. $58,426 for all races)
> Black homeownership rate: 40.3% (vs. 56.3% for all races)
[in-text-ad-2]
Source: Kruck20 / iStock via Getty Images
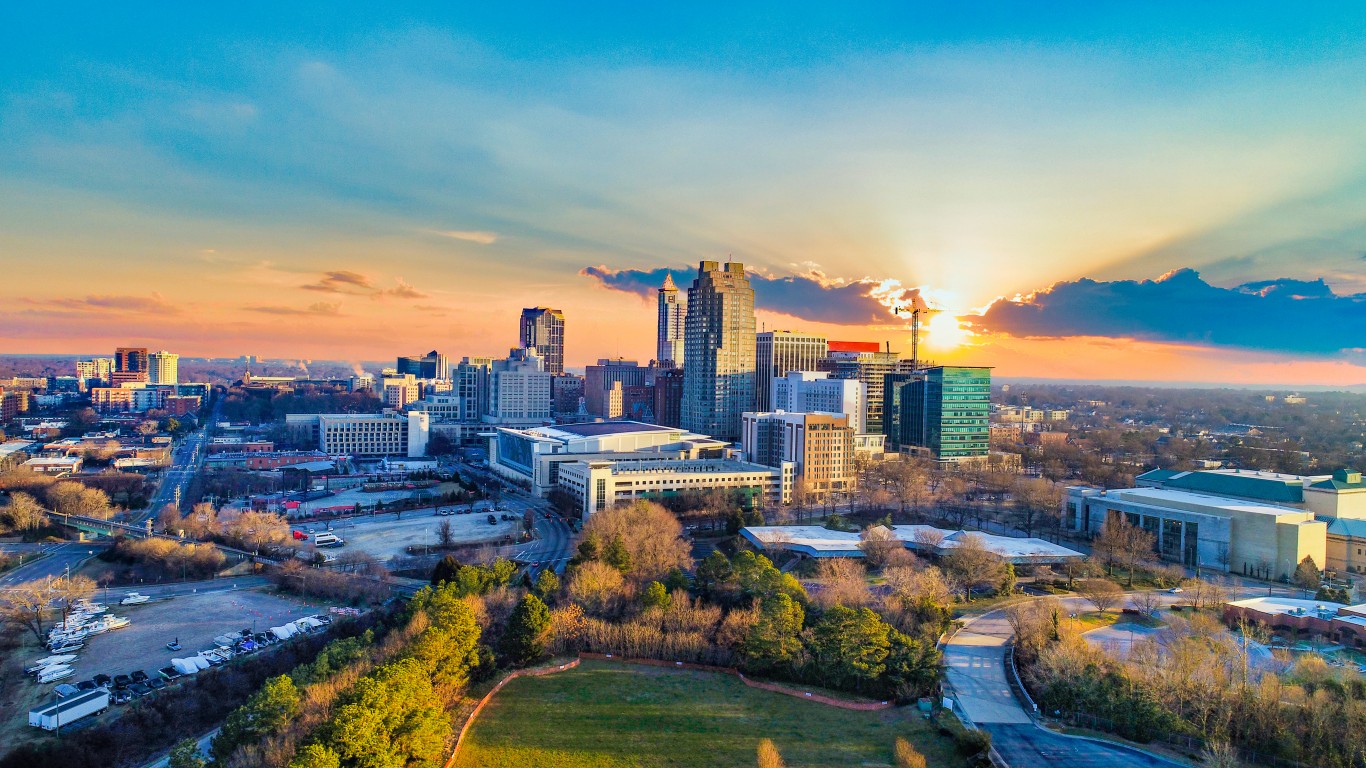
21. Raleigh, NC
> Firms owned by Black residents: 3.5% (988)
> Black population share: 19.5% (271,620)
> Black median household income: $54,432 (vs. $83,581 for all races)
> Black homeownership rate: 46.6% (vs. 66.4% for all races)
Source: Art Wager / iStock via Getty Images
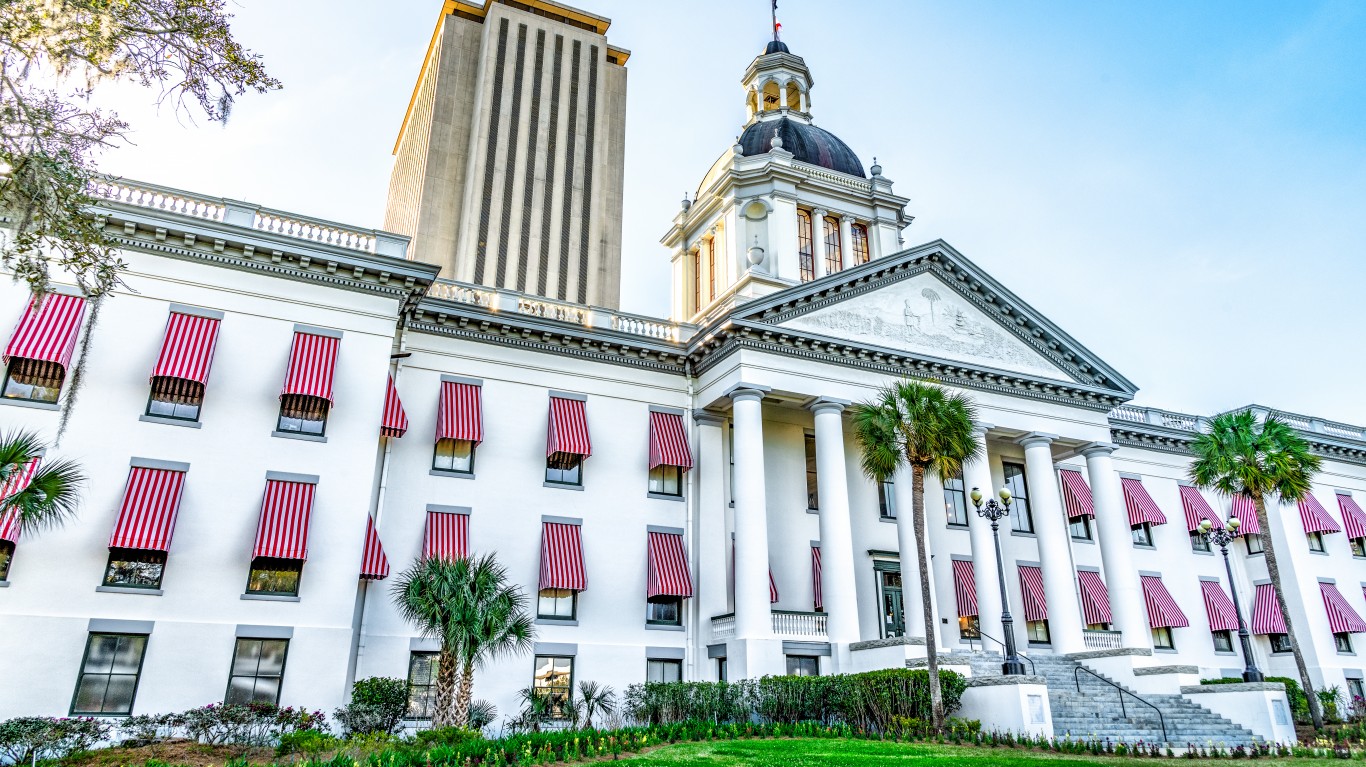
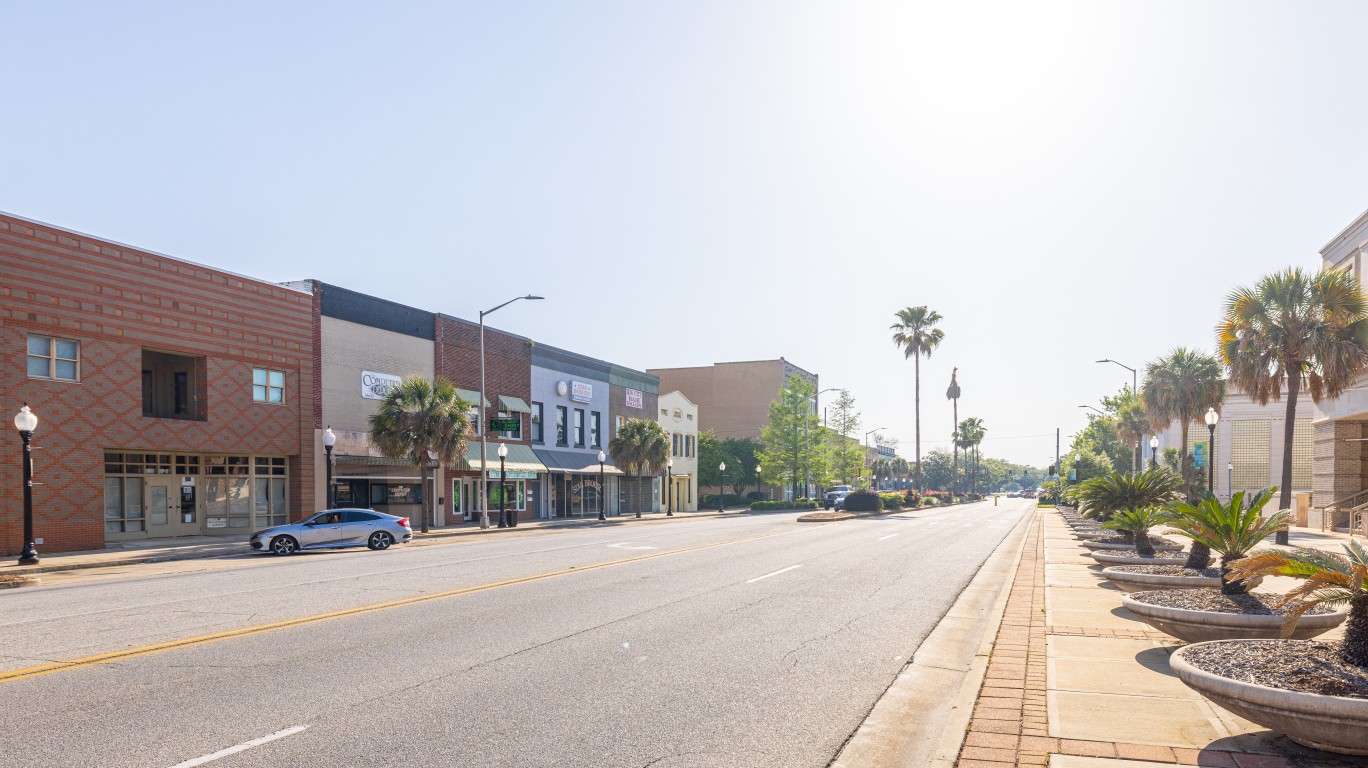
20. Tallahassee, FL
> Firms owned by Black residents: 3.6% (257)
> Black population share: 32.3% (123,767)
> Black median household income: $37,435 (vs. $56,304 for all races)
> Black homeownership rate: 42.3% (vs. 58.0% for all races)
[in-text-ad]
Source: Sean Pavone / iStock via Getty Images
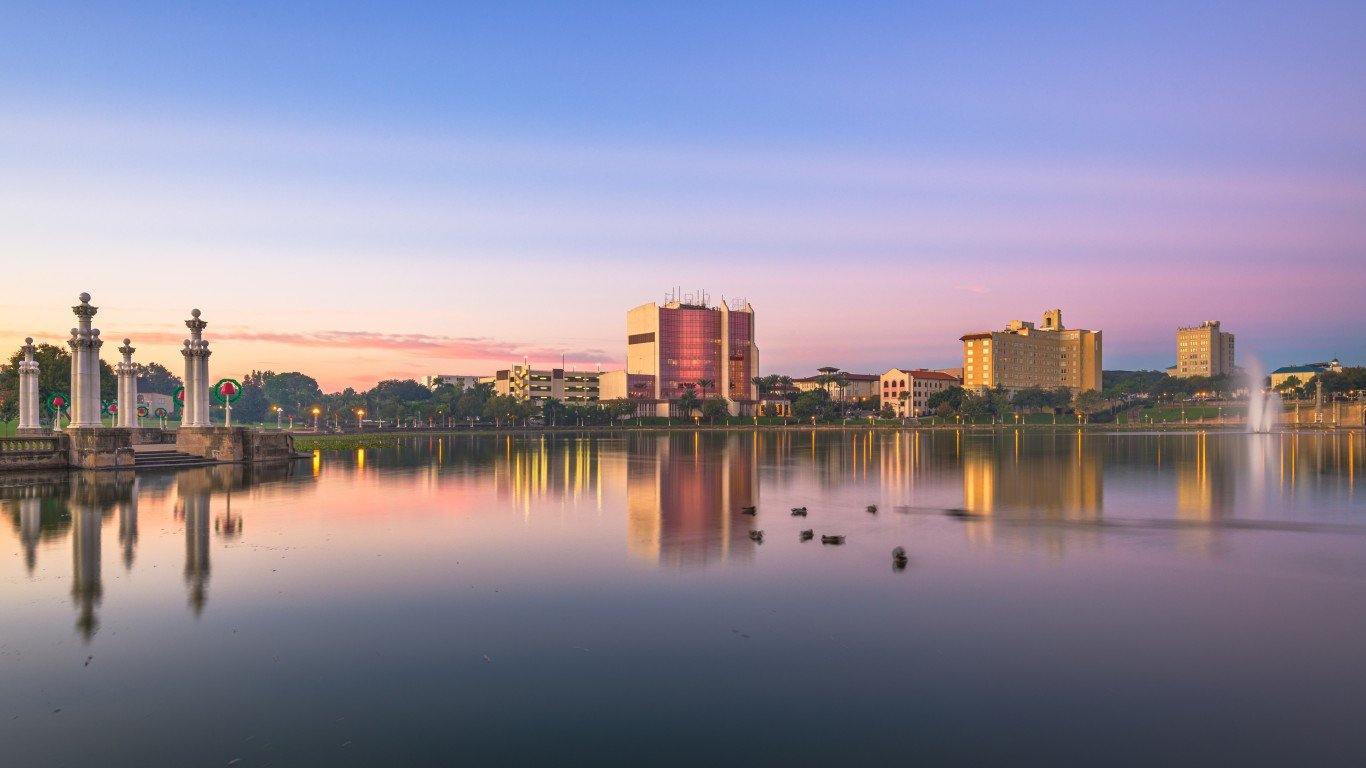
19. Lakeland-Winter Haven, FL
> Firms owned by Black residents: 3.7% (358)
> Black population share: 15.0% (107,169)
> Black median household income: $42,659 (vs. $55,099 for all races)
> Black homeownership rate: 50.0% (vs. 69.1% for all races)
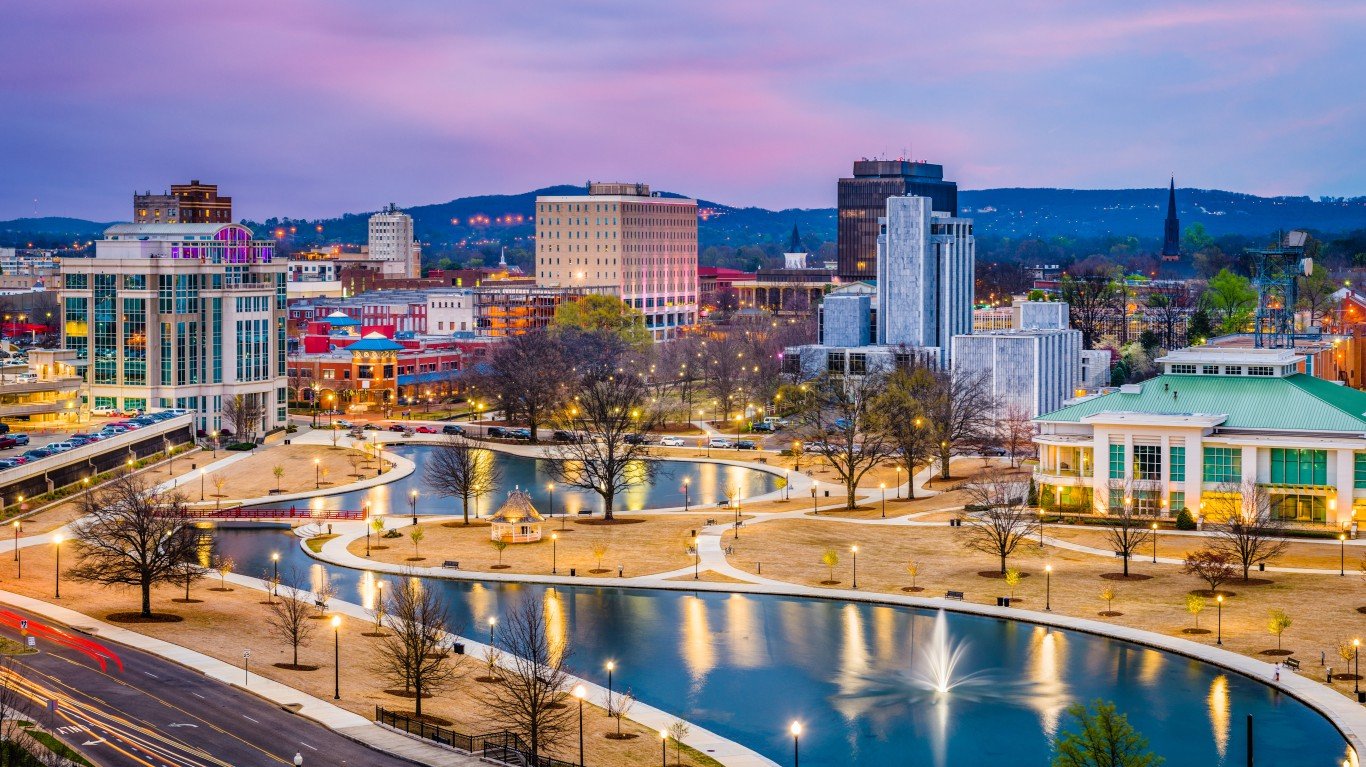
Source: Sean Pavone / iStock via Getty Images
18. Huntsville, AL
> Firms owned by Black residents: 3.7% (295)
> Black population share: 21.9% (106,051)
> Black median household income: $44,461 (vs. $71,057 for all races)
> Black homeownership rate: 51.1% (vs. 69.5% for all races)
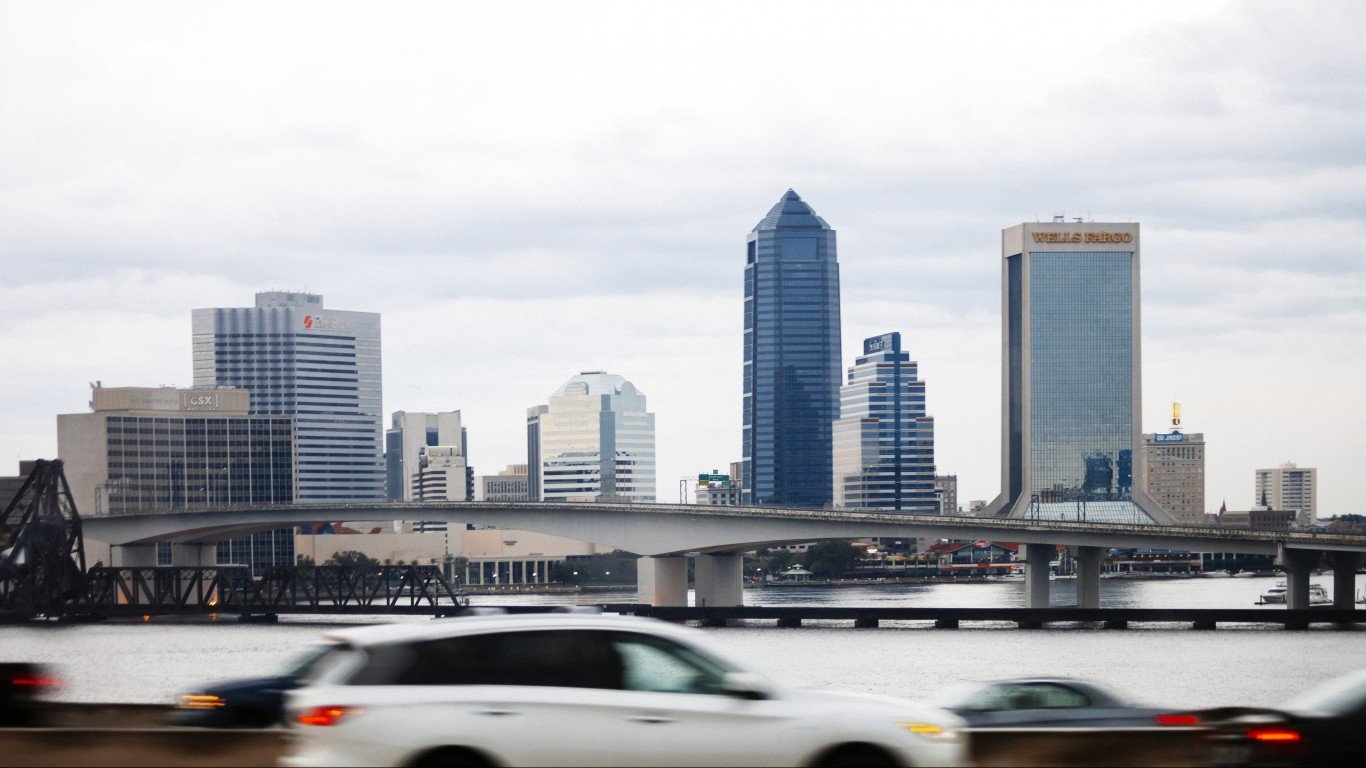
Source: peeterv / iStock via Getty Images
17. Jacksonville, FL
> Firms owned by Black residents: 3.7% (1,167)
> Black population share: 21.2% (335,841)
> Black median household income: $44,929 (vs. $66,664 for all races)
> Black homeownership rate: 44.9% (vs. 65.2% for all races)
[in-text-ad-2]
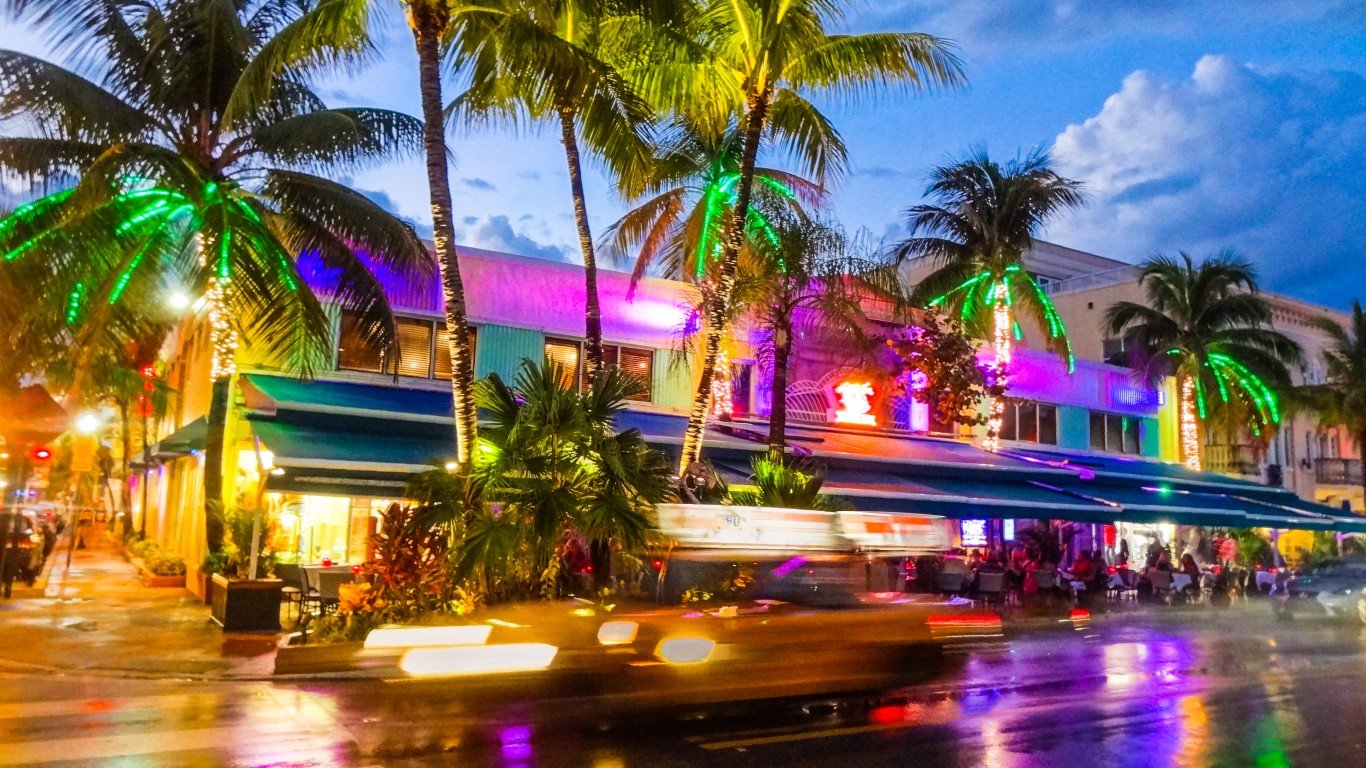
Source: S_Hoss / iStock via Getty Images
16. Miami-Fort Lauderdale-West Palm Beach, FL
> Firms owned by Black residents: 4.0% (7,072)
> Black population share: 20.7% (1,265,978)
> Black median household income: $48,731 (vs. $62,870 for all races)
> Black homeownership rate: 47.2% (vs. 59.9% for all races)
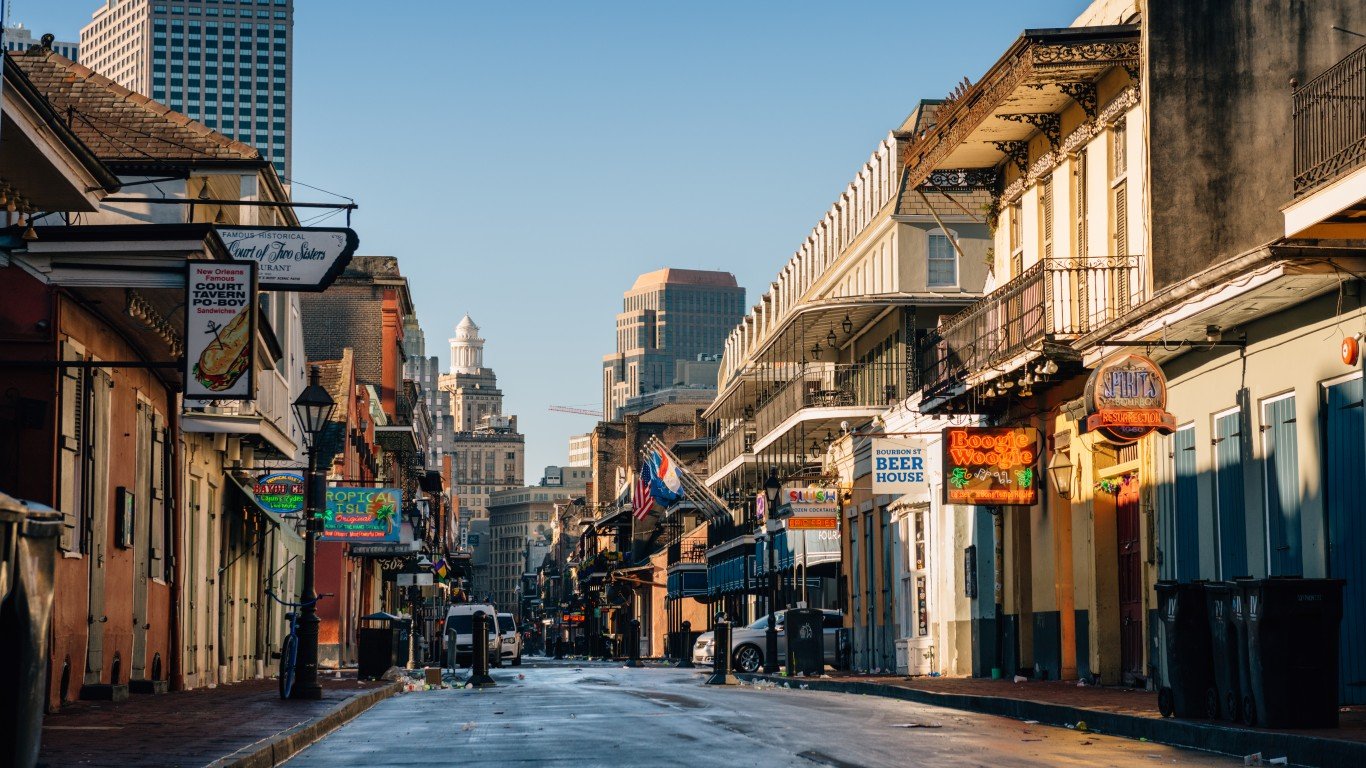
Source: ferrantraite / E+ via Getty Images
15. New Orleans-Metairie, LA
> Firms owned by Black residents: 4.2% (987)
> Black population share: 34.4% (436,280)
> Black median household income: $36,404 (vs. $57,656 for all races)
> Black homeownership rate: 47.9% (vs. 63.1% for all races)
[in-text-ad]

Source: aphotostory / iStock via Getty Images
14. Orlando-Kissimmee-Sanford, FL
> Firms owned by Black residents: 4.3% (2,425)
> Black population share: 16.3% (428,870)
> Black median household income: $50,560 (vs. $65,086 for all races)
> Black homeownership rate: 47.2% (vs. 62.6% for all races)
 24/7 Wall St.
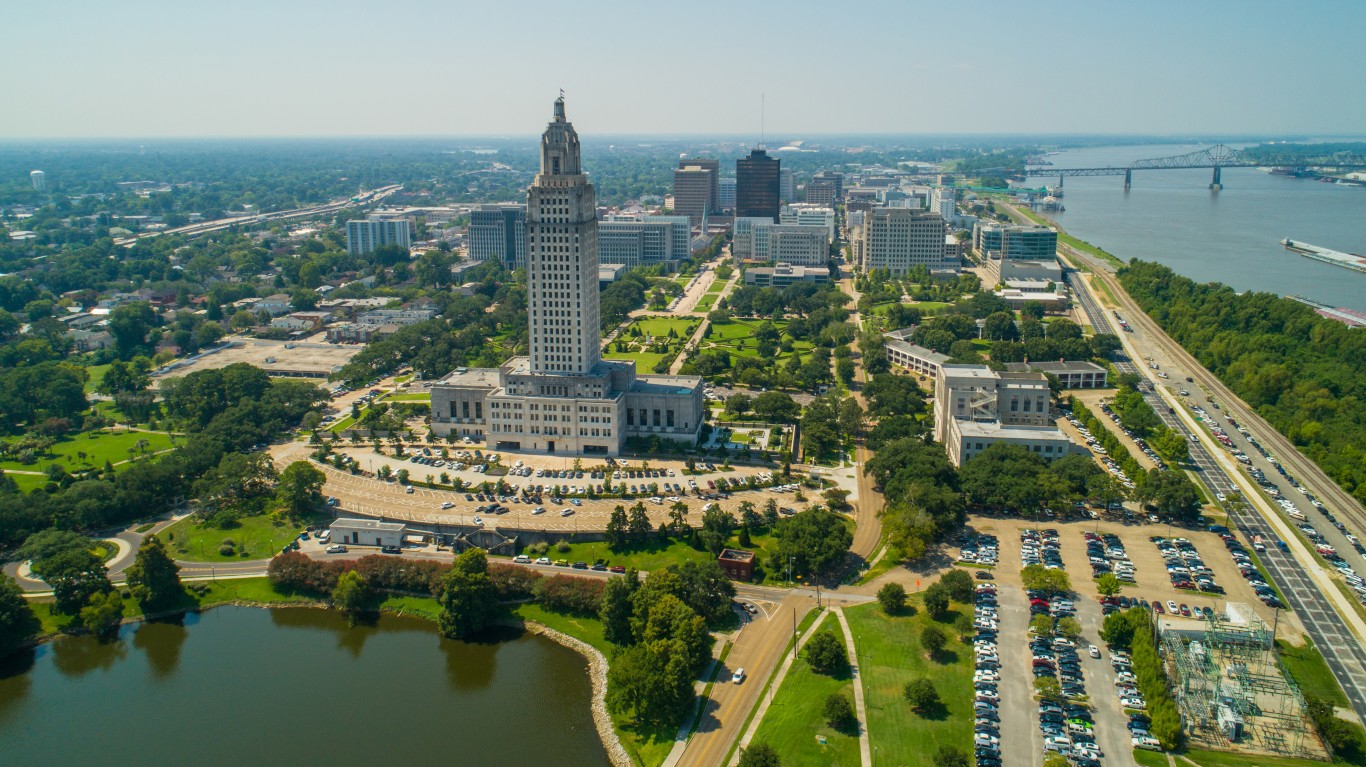
Source: felixmizioznikov / iStock via Getty Images
13. Baton Rouge, LA
> Firms owned by Black residents: 4.4% (626)
> Black population share: 35.1% (304,225)
> Black median household income: $43,322 (vs. $63,270 for all races)
> Black homeownership rate: 53.5% (vs. 69.3% for all races)
Source: Roberto Galan / iStock Editorial via Getty Images
12. Albany, GA
> Firms owned by Black residents: 4.4% (109)
> Black population share: 52.9% (79,044)
> Black median household income: $38,178 (vs. $49,500 for all races)
> Black homeownership rate: 40.9% (vs. 56.2% for all races)
[in-text-ad-2]
Source: DenisTangneyJr / E+ via Getty Images
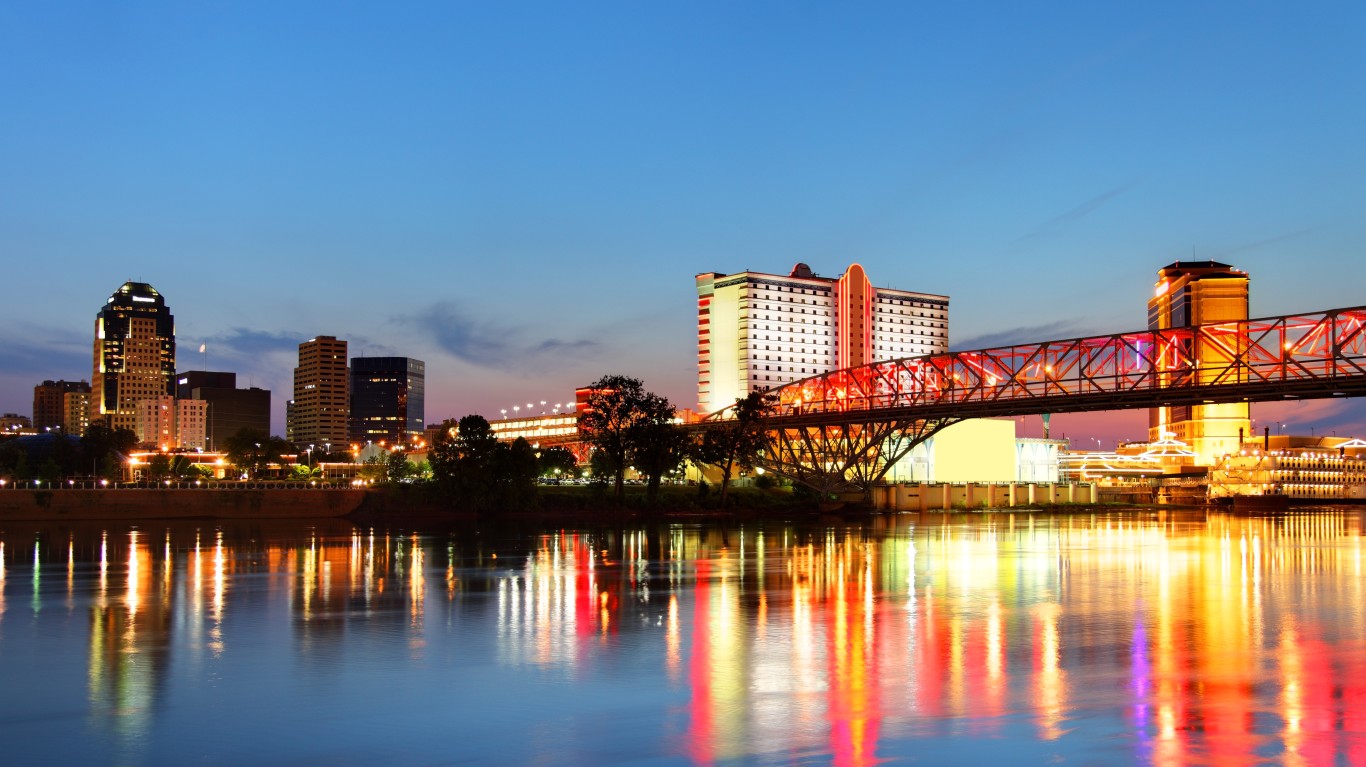
11. Shreveport-Bossier City, LA
> Firms owned by Black residents: 4.5% (360)
> Black population share: 39.8% (157,084)
> Black median household income: $31,435 (vs. $47,729 for all races)
> Black homeownership rate: 46.7% (vs. 62.3% for all races)
Source: Kruck20 / iStock via Getty Images
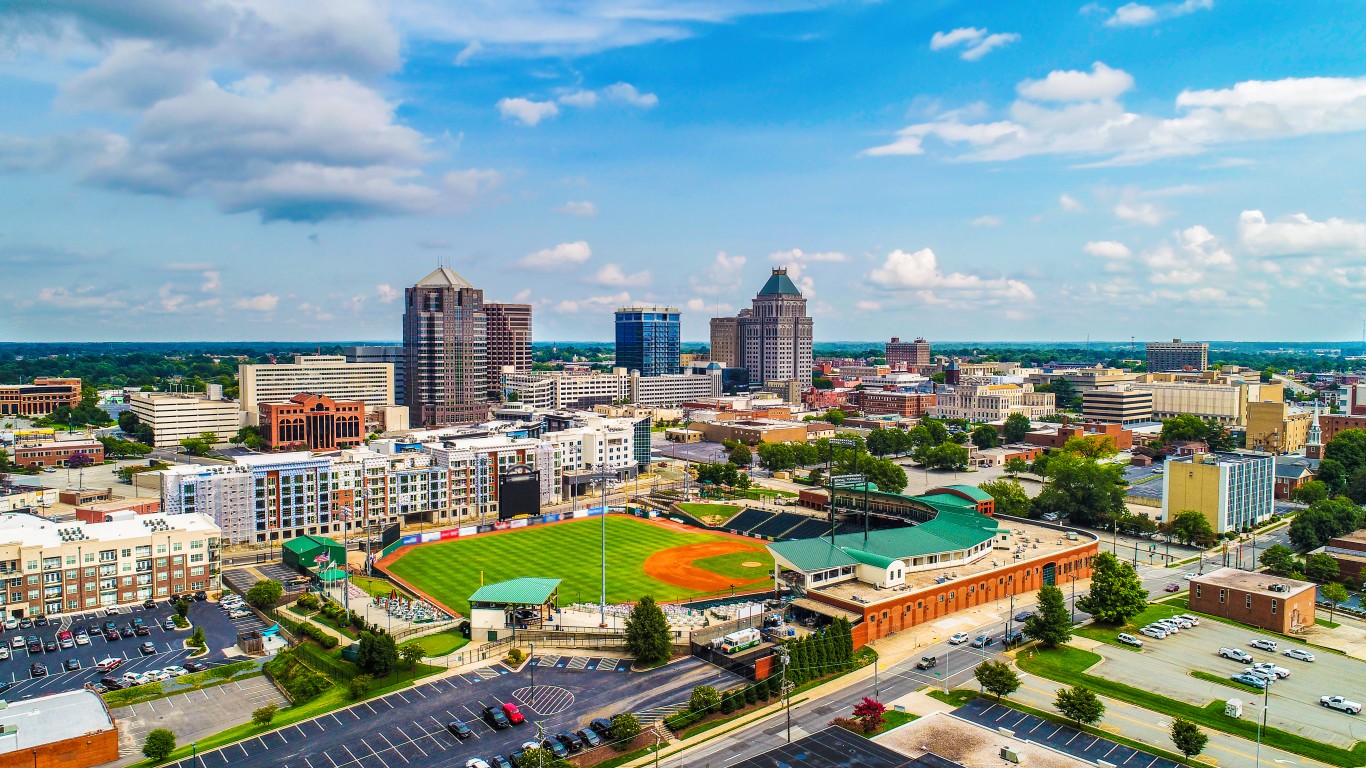
10. Greensboro-High Point, NC
> Firms owned by Black residents: 4.5% (621)
> Black population share: 27.2% (209,977)
> Black median household income: $42,506 (vs. $55,544 for all races)
> Black homeownership rate: 41.0% (vs. 63.5% for all races)
[in-text-ad]
Source: Kruck20 / iStock via Getty Images
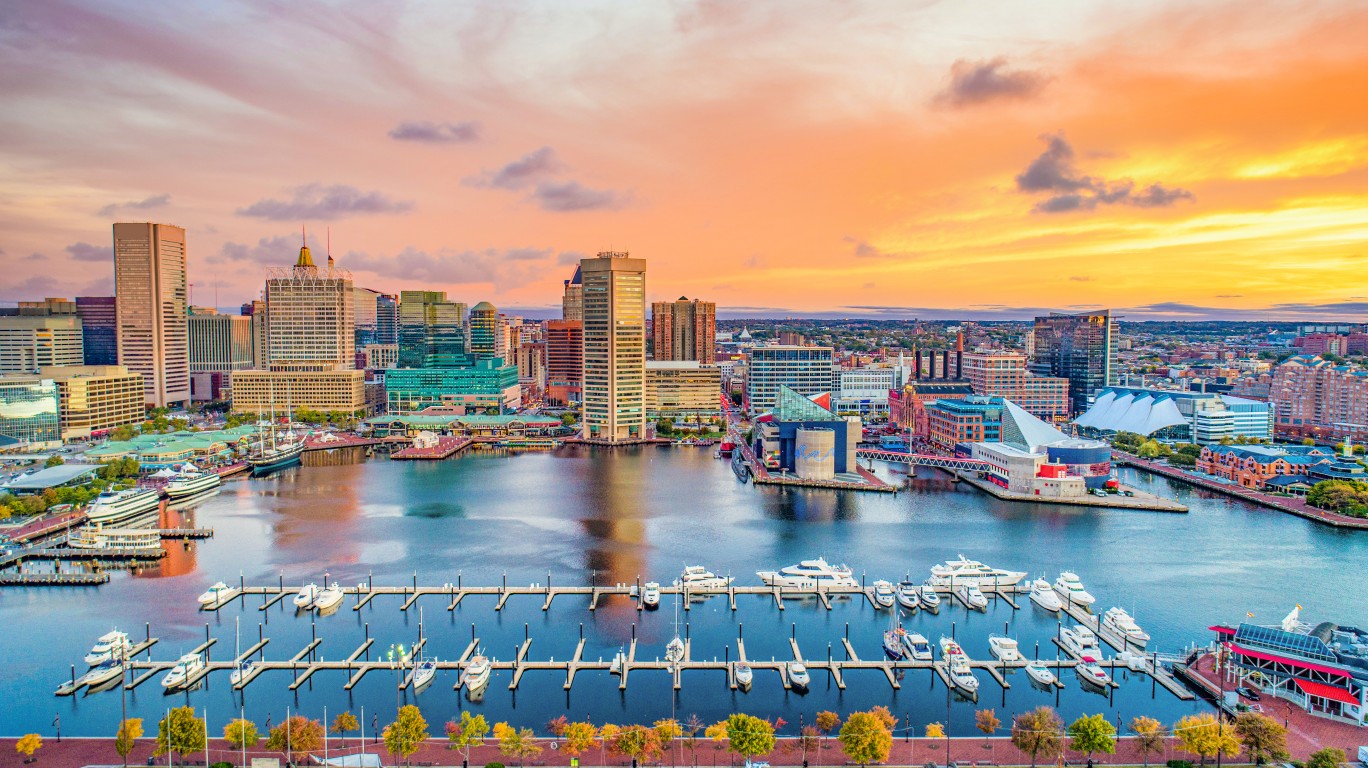
9. Baltimore-Columbia-Towson, MD
> Firms owned by Black residents: 4.5% (2,331)
> Black population share: 29.1% (824,757)
> Black median household income: $59,374 (vs. $87,513 for all races)
> Black homeownership rate: 46.8% (vs. 67.0% for all races)
 24/7 Wall St.
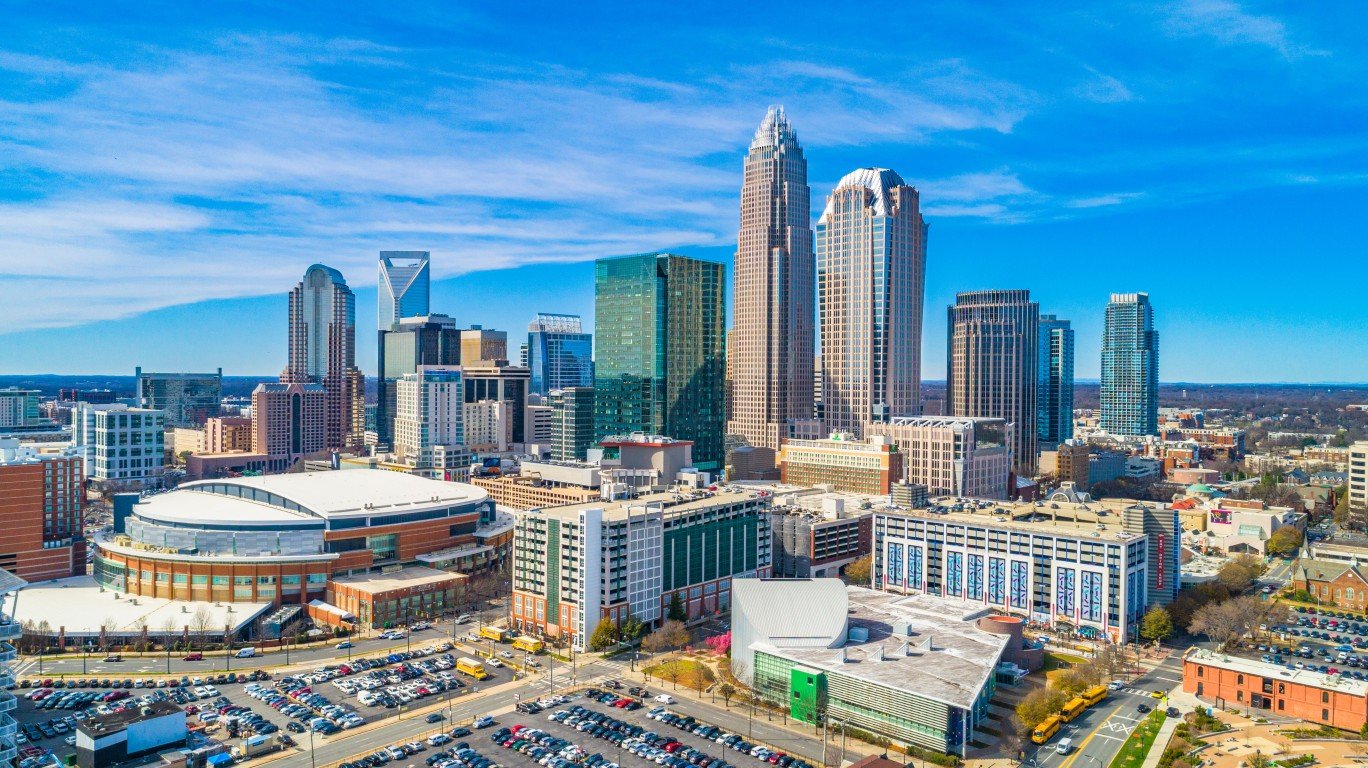
Source: Kruck20 / iStock via Getty Images
8. Charlotte-Concord-Gastonia, NC-SC
> Firms owned by Black residents: 4.9% (2,414)
> Black population share: 22.8% (598,004)
> Black median household income: $49,873 (vs. $69,559 for all races)
> Black homeownership rate: 45.8% (vs. 66.0% for all races)
Source: Sean Pavone / iStock via Getty Images
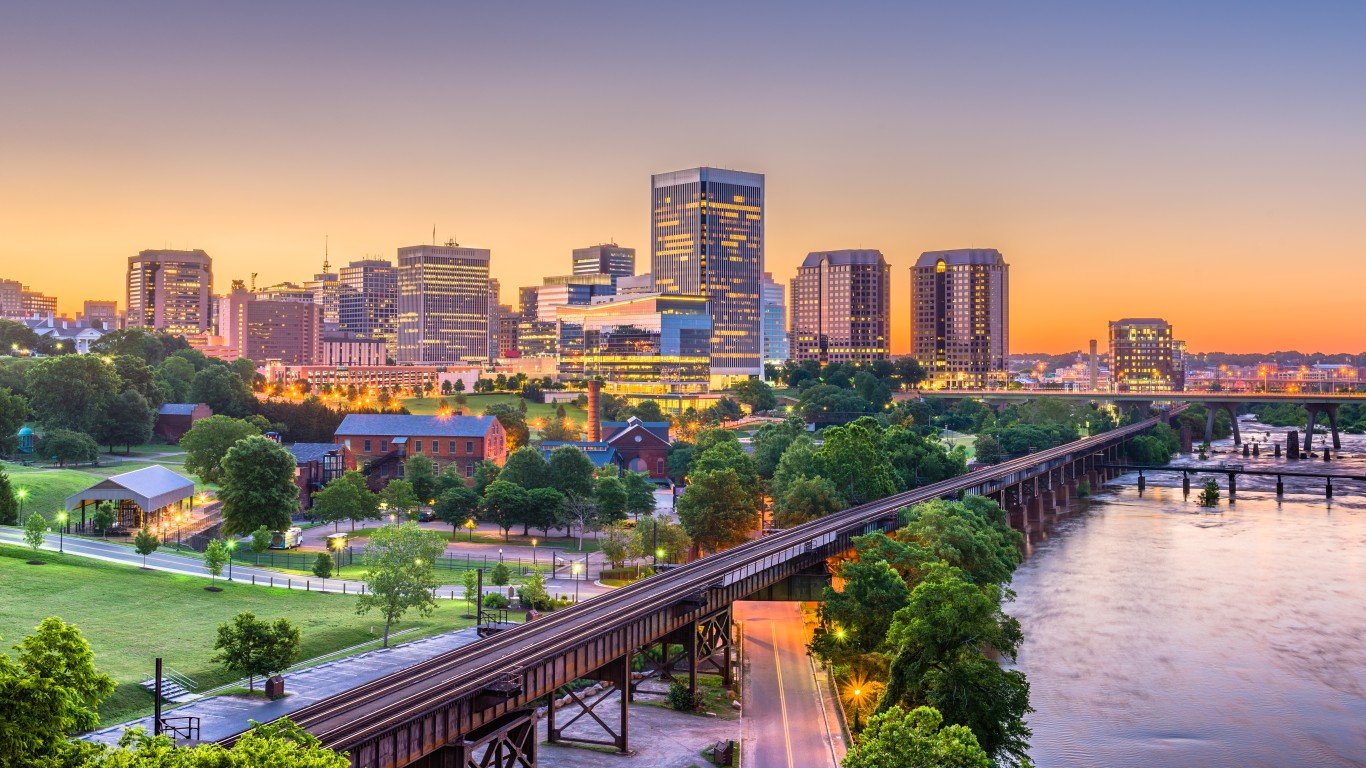
7. Richmond, VA
> Firms owned by Black residents: 5.9% (1,397)
> Black population share: 29.2% (380,284)
> Black median household income: $52,169 (vs. $74,592 for all races)
> Black homeownership rate: 49.9% (vs. 66.4% for all races)
[in-text-ad-2]
Source: benedek / iStock via Getty Images
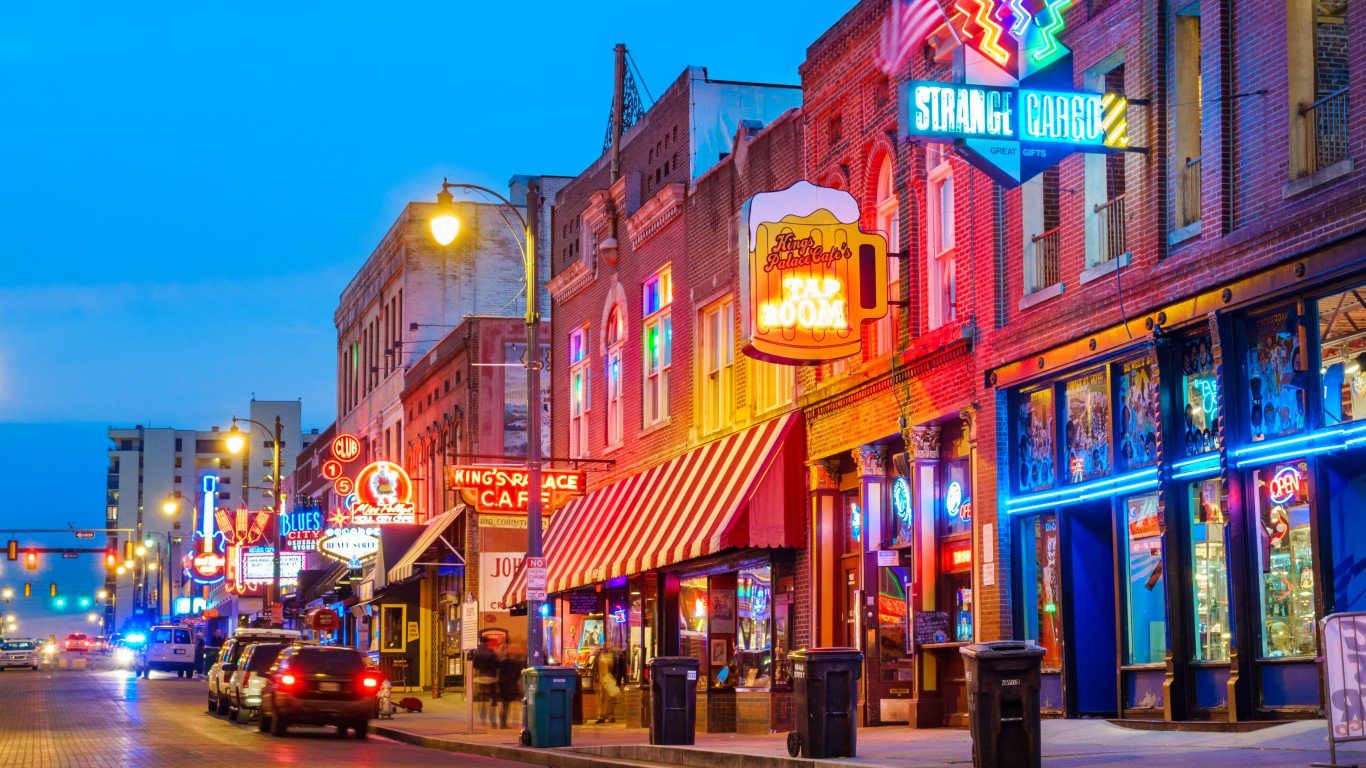
6. Memphis, TN-MS-AR
> Firms owned by Black residents: 6.4% (1,158)
> Black population share: 47.4% (632,459)
> Black median household income: $41,771 (vs. $56,926 for all races)
> Black homeownership rate: 46.0% (vs. 60.7% for all races)
Source: SeanPavonePhoto / iStock via Getty Images
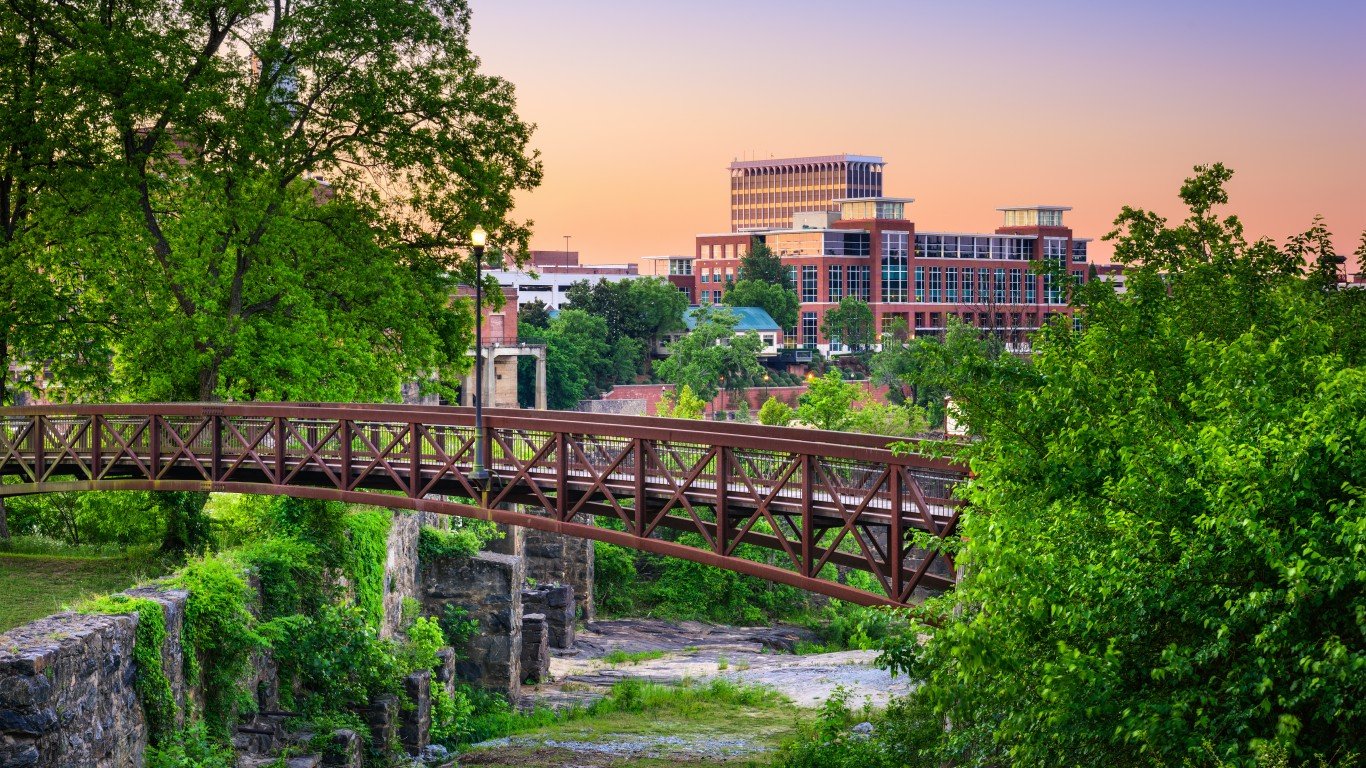
5. Columbus, GA-AL
> Firms owned by Black residents: 6.7% (273)
> Black population share: 42.1% (136,995)
> Black median household income: $39,255 (vs. $51,694 for all races)
> Black homeownership rate: 46.0% (vs. 56.1% for all races)
[in-text-ad]

Source: ABEMOS / iStock via Getty Images
4. Virginia Beach-Norfolk-Newport News, VA-NC
> Firms owned by Black residents: 6.8% (1,937)
> Black population share: 30.2% (540,402)
> Black median household income: $51,148 (vs. $71,612 for all races)
> Black homeownership rate: 44.1% (vs. 62.2% for all races)
Source: f11photo / iStock via Getty Images
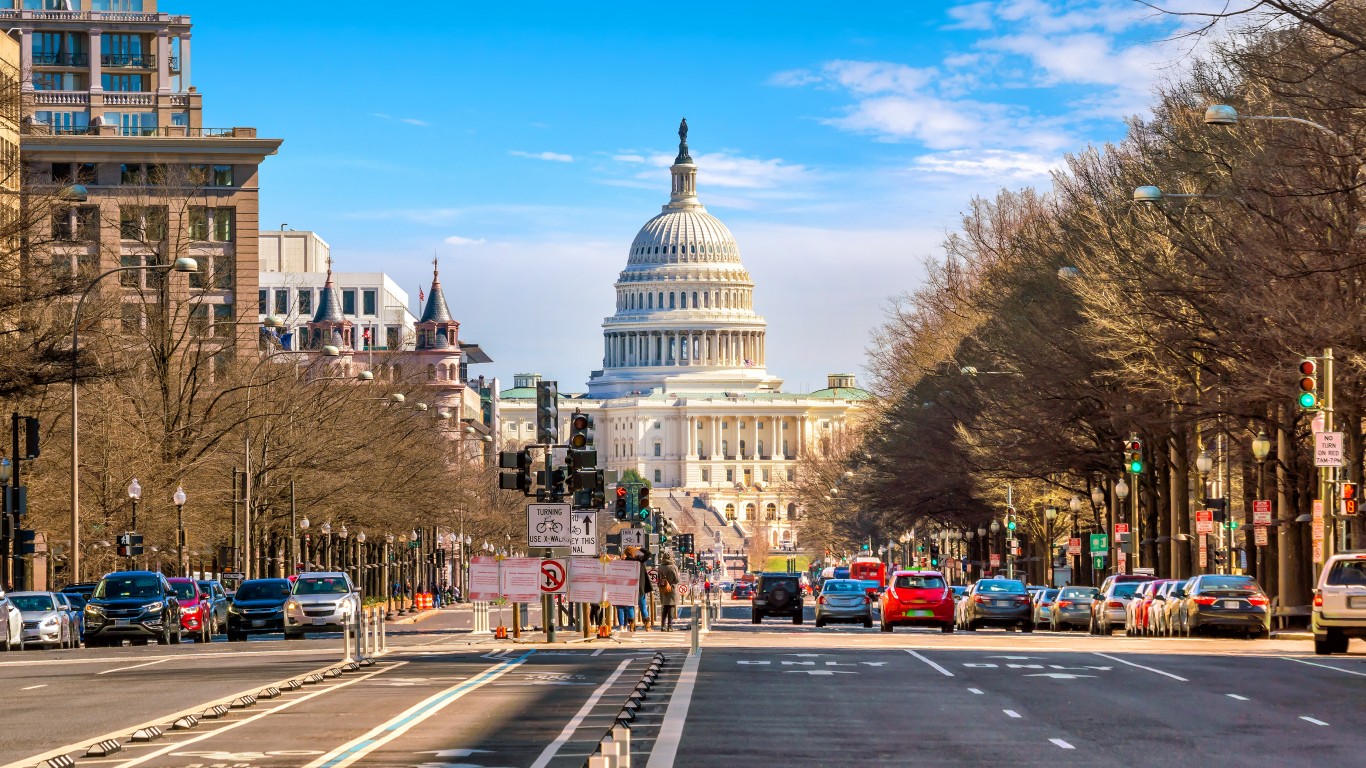
3. Washington-Arlington-Alexandria, DC-VA-MD-WV
> Firms owned by Black residents: 7.0% (7,933)
> Black population share: 25.1% (1,591,396)
> Black median household income: $82,045 (vs. $111,252 for all races)
> Black homeownership rate: 51.3% (vs. 63.7% for all races)
Source: Kruck20 / iStock via Getty Images
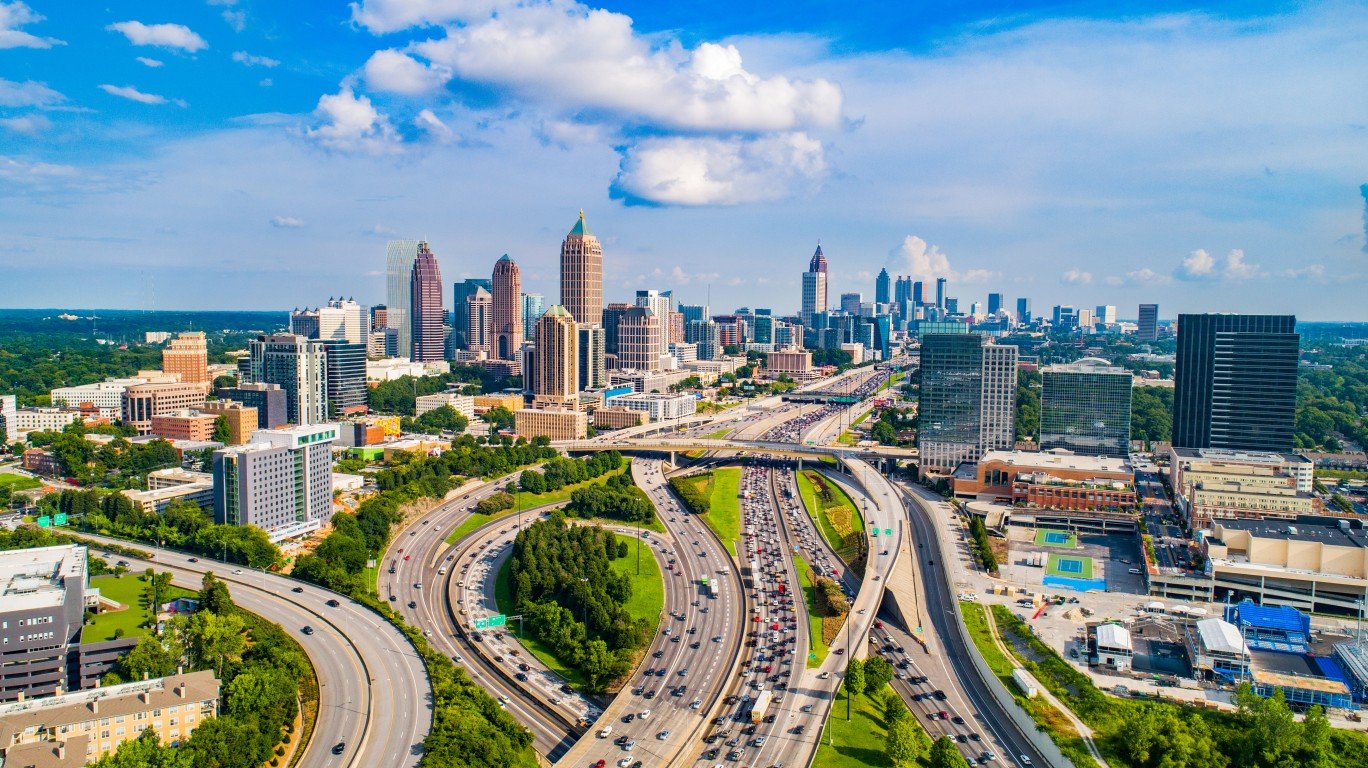
2. Atlanta-Sandy Springs-Roswell, GA
> Firms owned by Black residents: 7.4% (8,663)
> Black population share: 34.2% (2,061,473)
> Black median household income: $58,684 (vs. $75,267 for all races)
> Black homeownership rate: 49.8% (vs. 64.8% for all races)
[in-text-ad-2]
Source: Public Domain / Wikimedia Commons
1. Pine Bluff, AR
> Firms owned by Black residents: 8.5% (82)
> Black population share: 48.4% (43,068)
> Black median household income: $37,588 (vs. $44,756 for all races)
> Black homeownership rate: 54.2% (vs. 67.2% for all races)
Methodology
To determine the cities with the most Black-owned businesses, 24/7 Wall St. reviewed data on businesses with more than one employee from the U.S. Census Bureau’s 2021 Annual Business Survey. Metropolitan statistical areas were ranked based on the percentage of employer companies owned by individuals who identify as Black or African American.
Ownership is defined as having more than 50% of the stock or equity in the business. The percentage of residents identifying as Black or African Americans out of the total population was calculated using five-year data from the Census Bureau’s 2021 American Community Survey.
Data on median household income for Black or African American households and Black or African American homeownership rates also came from the 2021 ACS and are five-year estimates. All data includes all Black or African American respondents regardless of reported Hispanic or Latino ethnicity.
Sponsored: Attention Savvy Investors: Speak to 3 Financial Experts – FREE
Ever wanted an extra set of eyes on an investment you’re considering? Now you can speak with up to 3 financial experts in your area for FREE. By simply
clicking here you can begin to match with financial professionals who can help guide you through the financial decisions you’re making. And the best part? The first conversation with them is free.
Click here to match with up to 3 financial pros who would be excited to help you make financial decisions.
Thank you for reading! Have some feedback for us?
Contact the 24/7 Wall St. editorial team.
Editors' Picks