The shift to remote work during the COVID-19 pandemic was a welcome change for many American workers, and one many hope will not go away any time soon. One of the top benefits of remote work, among those in jobs that allow for it, is the elimination of the daily commute to the office – a ritual that takes time, costs money, and exposes workers to the inherent risks associated with driving.
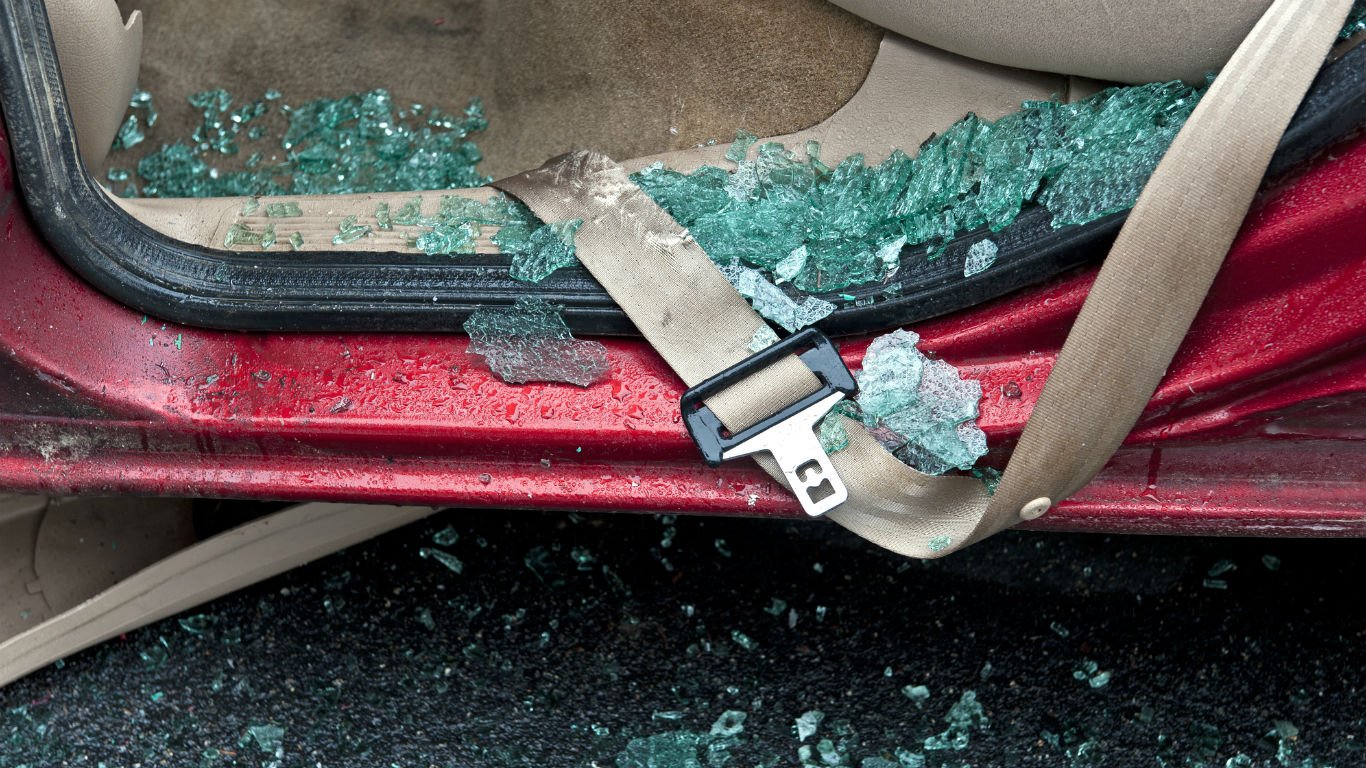
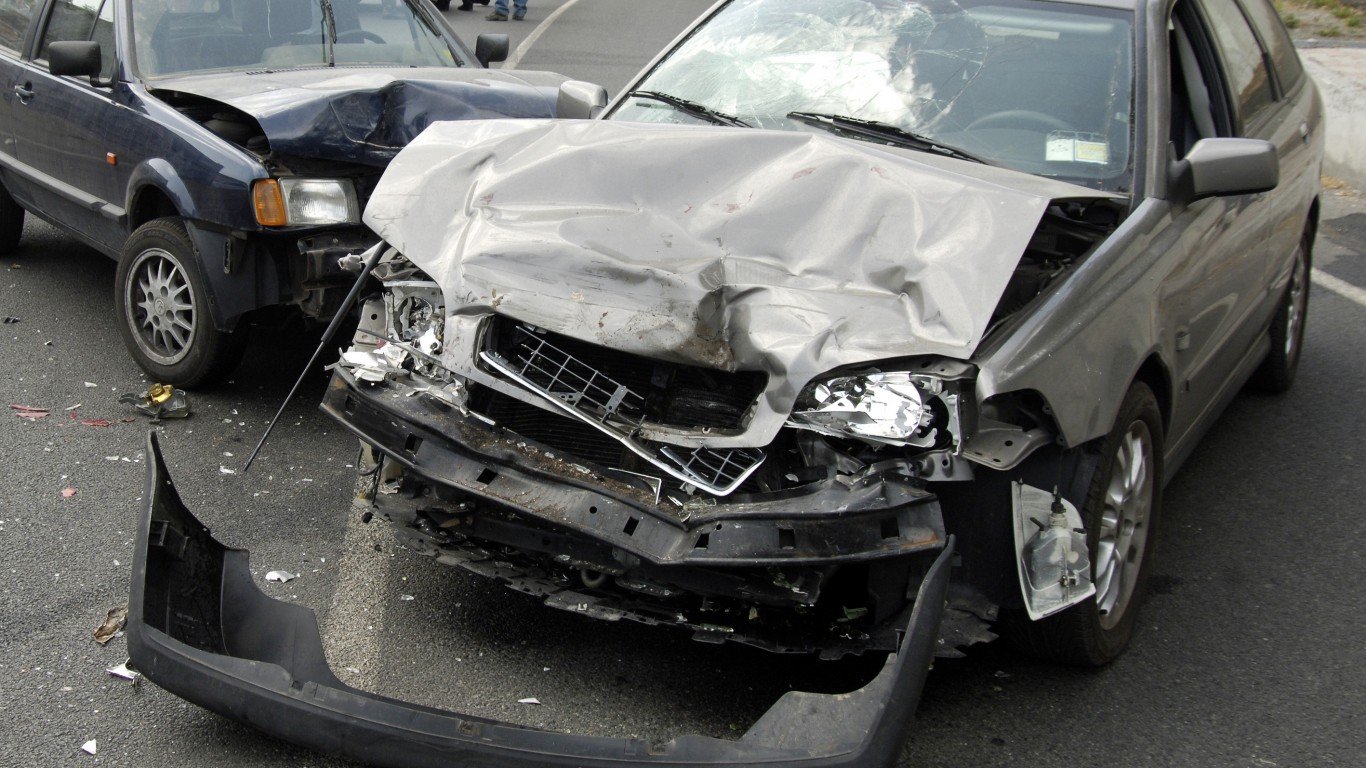
A leading cause of death in the United States, motor vehicle crashes resulted in 41,000 fatalities in 2020, or more than 100 every day, according to the Centers for Disease Control and Prevention. Another 2.1 million Americans were admitted to emergency rooms in 2020 for injuries sustained in auto accidents. And while most drivers are not killed or injured in an accident, there are other drawbacks. For example, the typical commuter in the U.S. spends over four hours getting to and from work each week, and in some parts of the country, daily commuters lose over 40 hours due to traffic congestion every year. (Here is a look at the most congested cities in the world.)
The drawbacks of the daily commute, specifically for drivers, vary across the country. Variables such as weather, unsafe driving habits, road conditions, and population density can make driving in some cities more dangerous and time consuming than in others.
24/7 Wall St. created an index of four key measures to identify the worst city to drive in each state. The four measures include the number of deadly auto accidents adjusted for population, average hours lost to traffic congestion per commuter, average overall commute time, and the motor vehicle theft rate. Each measure is for the latest year of available data. We ranked metro areas in each state by their combined index score.
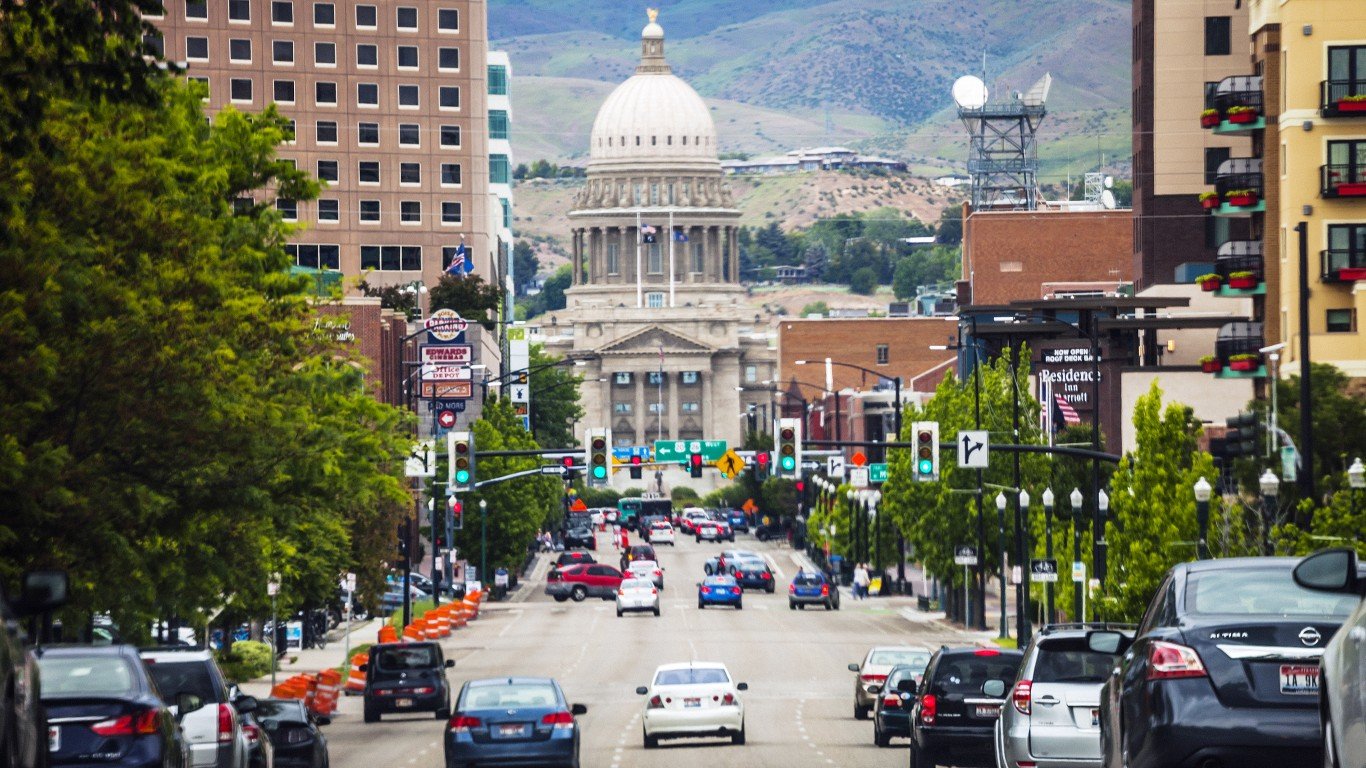
A city’s ranking on this list only means that it compares less favorably to other metro areas in the state. As a result, the roads in several of these places are relatively safe and uncongested. Boise, Idaho, for example, is a worse place to drive than the other four metro areas in the state. However, the city’s average commute time of 22.7 minutes is about three minutes less than the national average, and the local fatal crash rate of 6.4 deadly accidents per 100,000 people is lower than in nearly 85% of all other U.S. metro areas.
Notably, in most metro areas on this list, fatal crash rates are below the comparable statewide average. This is partly because, according to the National Highway Traffic Safety Administration, the rate of traffic deaths per vehicle miles traveled is nearly twice as high in rural areas as it is in urban areas, and metropolitan areas are generally urban and suburban. Drivers in urban areas tend to have better access to emergency medical services, are generally less likely to speed or be distracted, and are more likely to wear a seatbelt than rural drivers. (Here is a look at the worst holidays to drive.)
Click here to see the worst cities to drive in every state.
Click here to see our detailed methodology.
Source: toddmedia / iStock via Getty Images
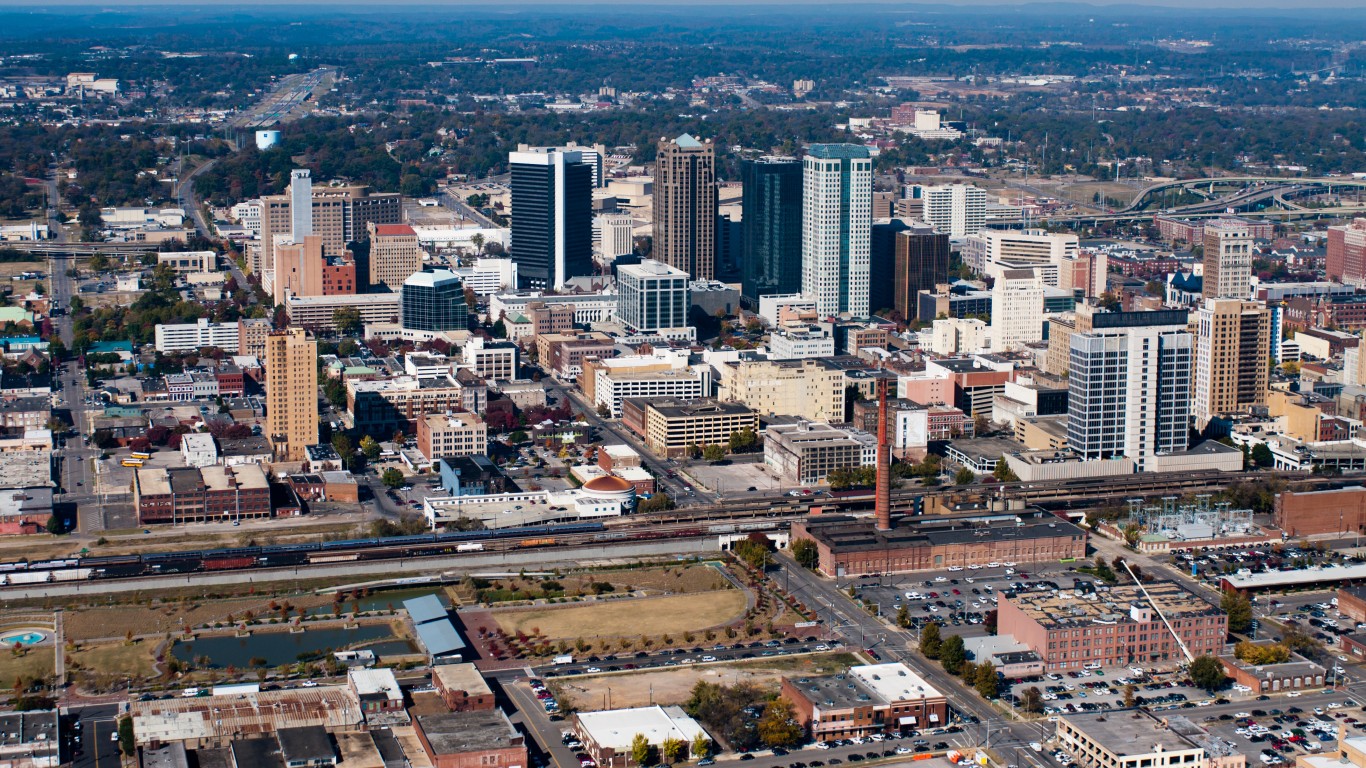
Alabama: Birmingham-Hoover
> Avg. time lost to traffic delays, 2020: 23 hours per commuter
> Incidents of auto theft, 2021: 292 per 100,000 people (226 per 100,000 in state)
> Fatal crash rate, 2020: 17.0 per 100,000 people (16.9 per 100,000 in state)
> Avg. commute time to work in 2021: 26.2 minutes (25.3 minutes in state)
> Metro areas considered in state: 12
[in-text-ad]
Source: prospective56 / iStock via Getty Images
Alaska: Anchorage
> Avg. time lost to traffic delays, 2020: 18 hours per commuter
> Incidents of auto theft, 2021: 331 per 100,000 people (240 per 100,000 in state)
> Fatal crash rate, 2020: 7.0 per 100,000 people (7.2 per 100,000 in state)
> Avg. commute time to work in 2021: 23.0 minutes (19.8 minutes in state)
> Metro areas considered in state: 2
 24/7 Wall St.
Source: peeterv / iStock via Getty Images
Arizona: Tucson
> Avg. time lost to traffic delays, 2020: 21 hours per commuter
> Incidents of auto theft, 2021: 314 per 100,000 people (284 per 100,000 in state)
> Fatal crash rate, 2020: 14.5 per 100,000 people (13.3 per 100,000 in state)
> Avg. commute time to work in 2021: 24.1 minutes (24.8 minutes in state)
> Metro areas considered in state: 7
Source: dlewis33 / iStock via Getty Images
Arkansas: Little Rock-North Little Rock-Conway
> Avg. time lost to traffic delays, 2020: 33 hours per commuter
> Incidents of auto theft, 2021: 423 per 100,000 people (301 per 100,000 in state)
> Fatal crash rate, 2020: 16.1 per 100,000 people (19.3 per 100,000 in state)
> Avg. commute time to work in 2021: 23.1 minutes (22.2 minutes in state)
> Metro areas considered in state: 6
[in-text-ad-2]
Source: Sundry Photography / iStock Editorial via Getty Images
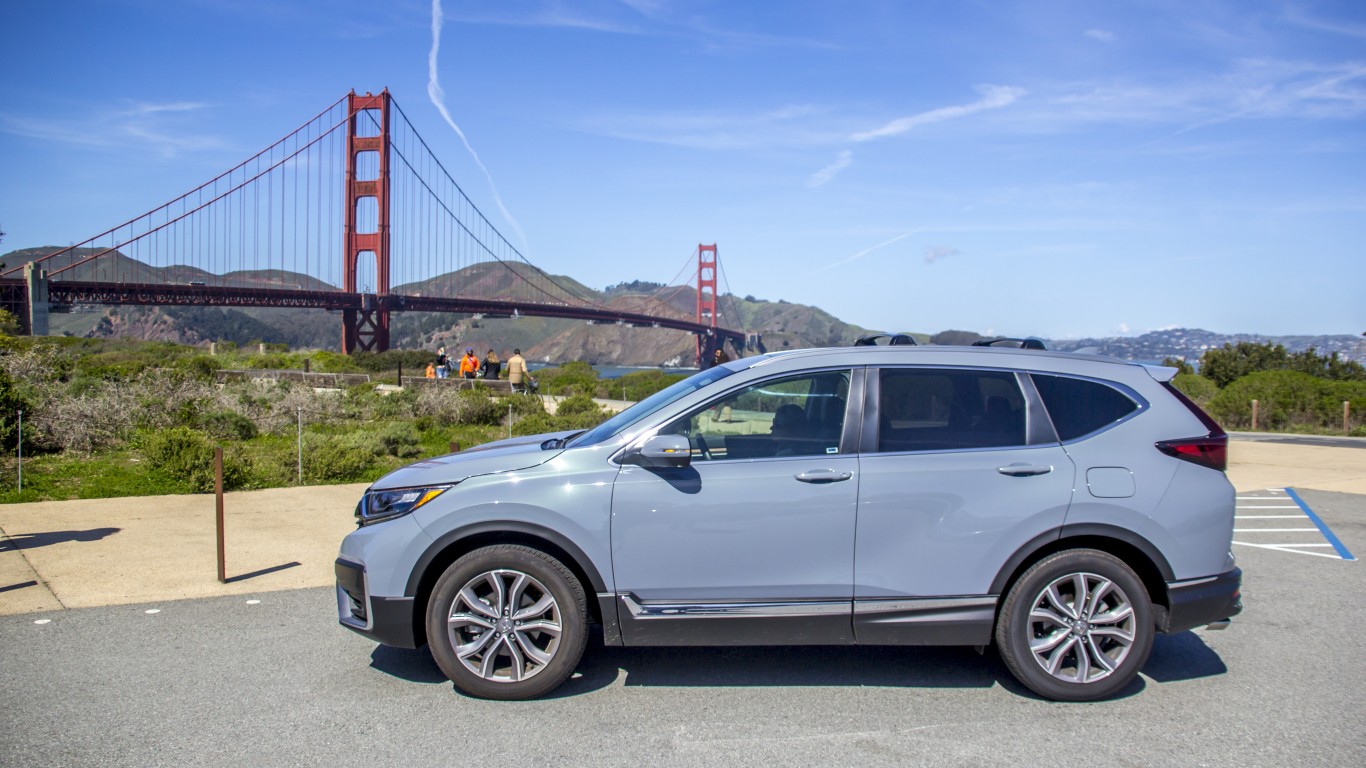
California: San Francisco-Oakland-Berkeley
> Avg. time lost to traffic delays, 2020: 46 hours per commuter
> Incidents of auto theft, 2021: 676 per 100,000 people (511 per 100,000 in state)
> Fatal crash rate, 2020: 5.5 per 100,000 people (9.1 per 100,000 in state)
> Avg. commute time to work in 2021: 28.8 minutes (27.6 minutes in state)
> Metro areas considered in state: 26

Source: pascaluehli / iStock via Getty Images
Colorado: Denver-Aurora-Lakewood
> Avg. time lost to traffic delays, 2020: 26 hours per commuter
> Incidents of auto theft, 2021: 965 per 100,000 people (661 per 100,000 in state)
> Fatal crash rate, 2020: 7.5 per 100,000 people (9.9 per 100,000 in state)
> Avg. commute time to work in 2021: 26.7 minutes (25.0 minutes in state)
> Metro areas considered in state: 7
[in-text-ad]

Source: DenisTangneyJr / iStock via Getty Images
Connecticut: Bridgeport-Stamford-Norwalk
> Avg. time lost to traffic delays, 2020: 40 hours per commuter
> Incidents of auto theft, 2021: 207 per 100,000 people (216 per 100,000 in state)
> Fatal crash rate, 2020: 5.9 per 100,000 people (7.7 per 100,000 in state)
> Avg. commute time to work in 2021: 29.1 minutes (25.6 minutes in state)
> Metro areas considered in state: 4
 24/7 Wall St.
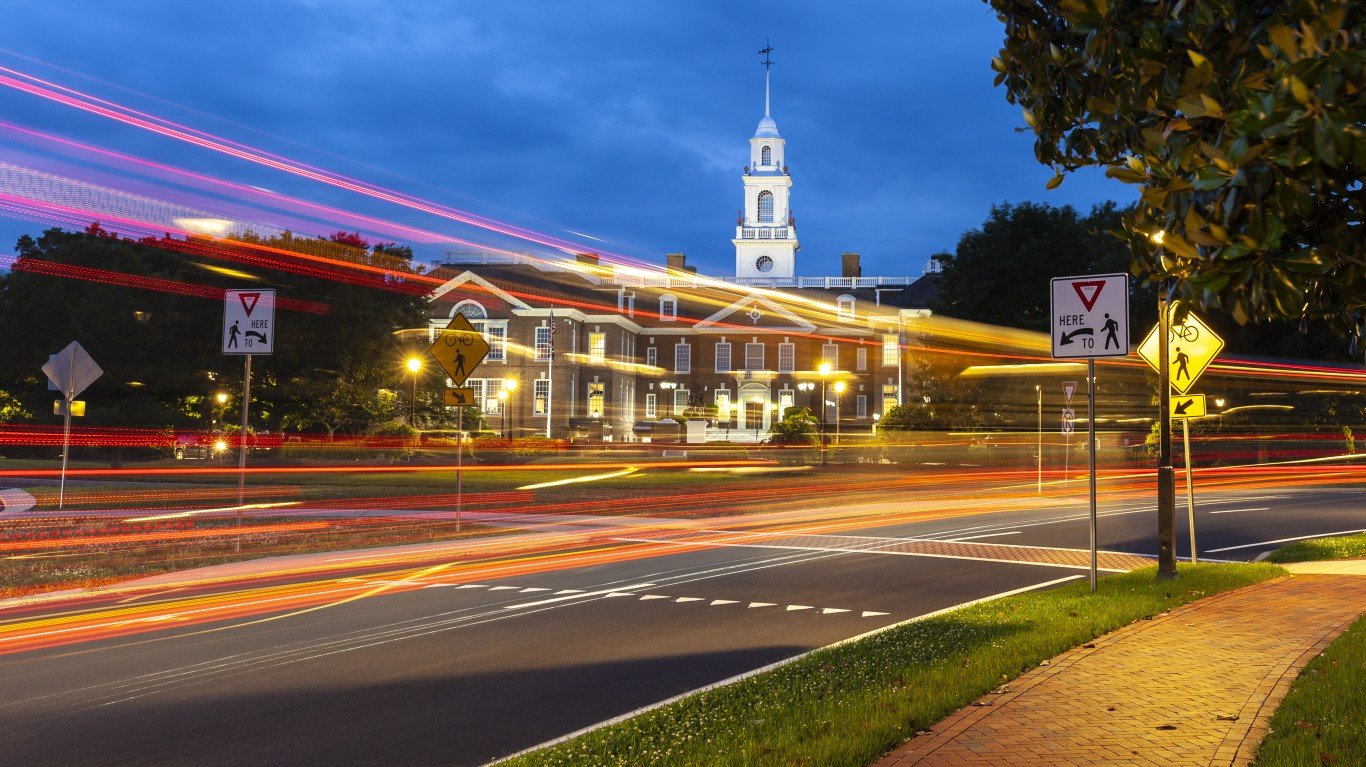
Source: traveler1116 / E+ via Getty Images
Delaware: Dover*
> Avg. time lost to traffic delays, 2020: 10 hours per commuter
> Incidents of auto theft, 2021: 142 per 100,000 people (187 per 100,000 in state)
> Fatal crash rate, 2020: 8.7 per 100,000 people (10.4 per 100,000 in state)
> Avg. commute time to work in 2021: 25.1 minutes (25.4 minutes in state)
> Metro areas considered in state: 1
*Because Dover is the only eligible metro area in Delaware, it ranks as the worst city to drive in by default.
Source: wsfurlan / iStock via Getty Images
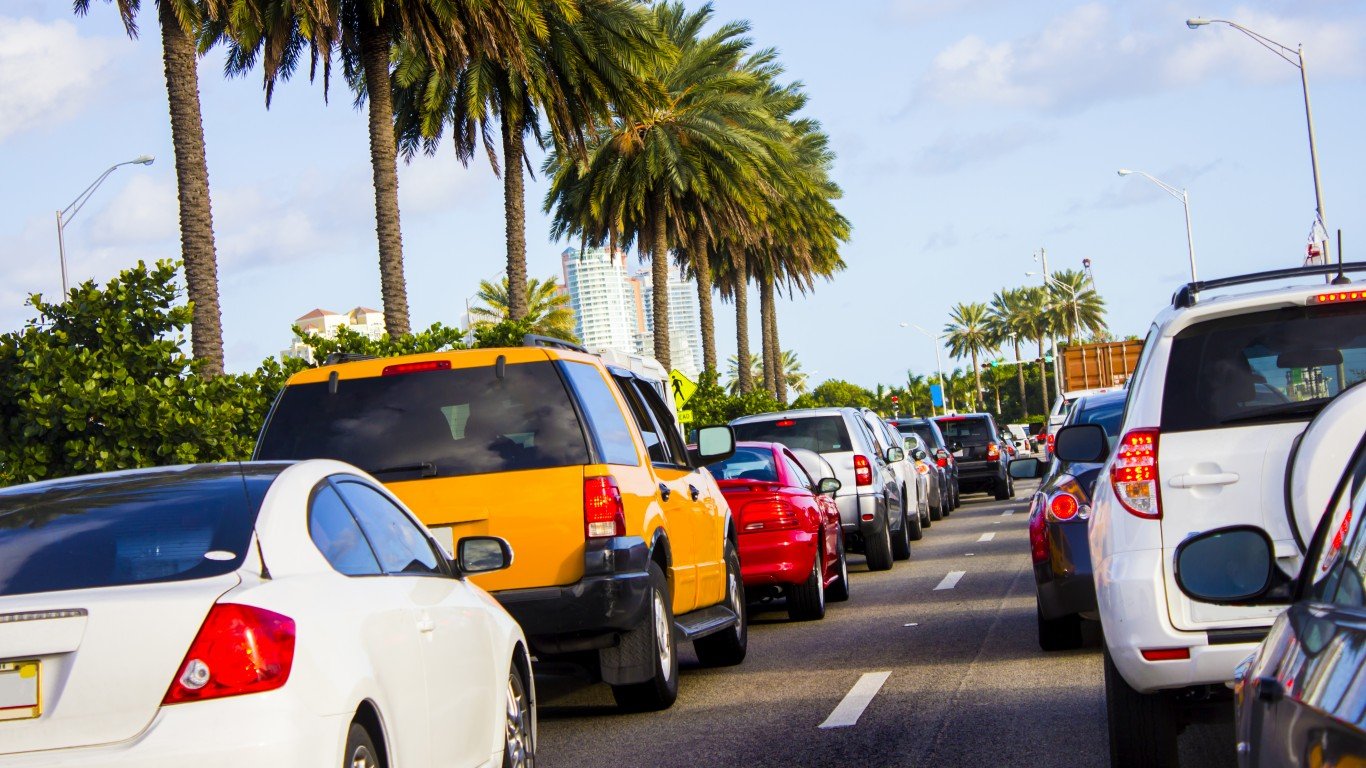
Florida: Miami-Fort Lauderdale-Pompano Beach
> Avg. time lost to traffic delays, 2020: 27 hours per commuter
> Incidents of auto theft, 2021: 279 per 100,000 people (197 per 100,000 in state)
> Fatal crash rate, 2020: 12.0 per 100,000 people (14.2 per 100,000 in state)
> Avg. commute time to work in 2021: 28.3 minutes (27.1 minutes in state)
> Metro areas considered in state: 20
[in-text-ad-2]
Source: Sean Davis / iStock via Getty Images
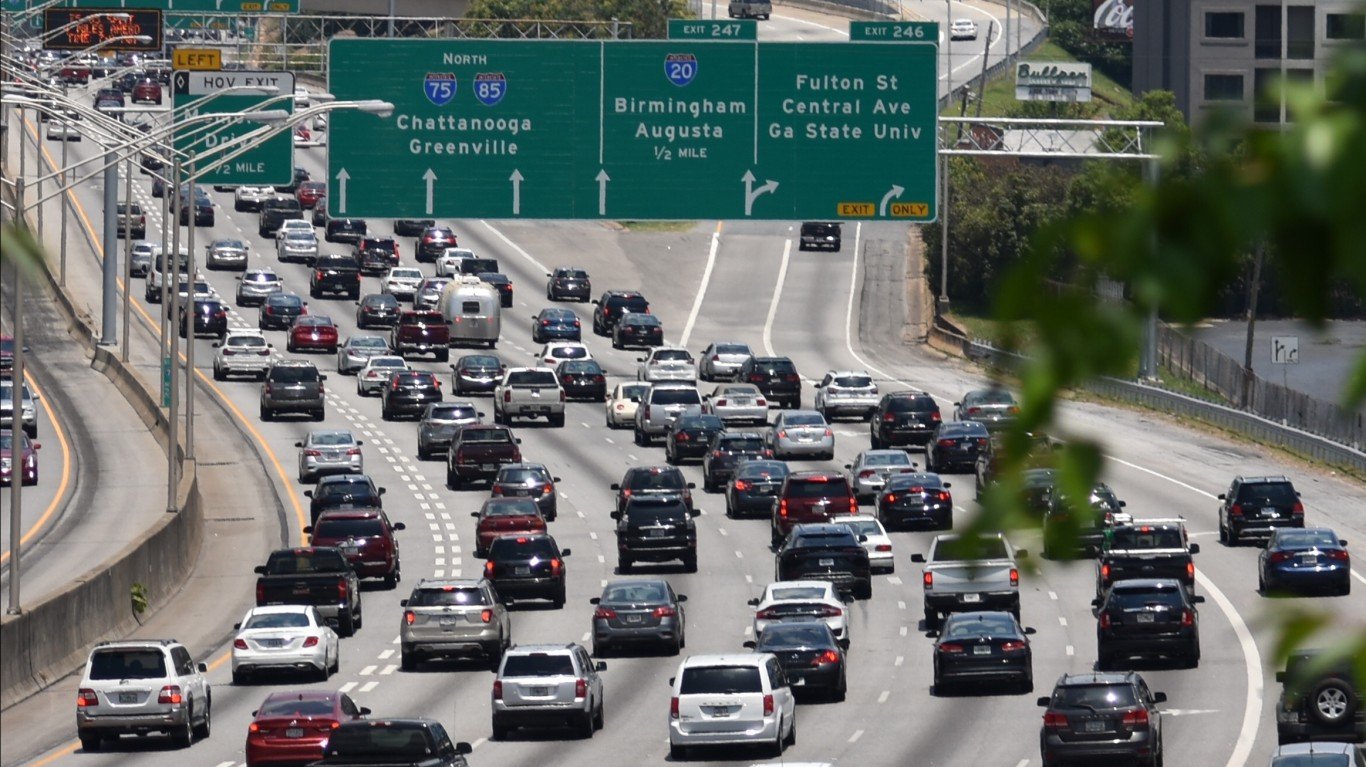
Georgia: Atlanta-Sandy Springs-Alpharetta
> Avg. time lost to traffic delays, 2020: 37 hours per commuter
> Incidents of auto theft, 2021: 271 per 100,000 people (241 per 100,000 in state)
> Fatal crash rate, 2020: 11.2 per 100,000 people (14.1 per 100,000 in state)
> Avg. commute time to work in 2021: 29.6 minutes (27.1 minutes in state)
> Metro areas considered in state: 14
Source: tankbmb / iStock via Getty Images
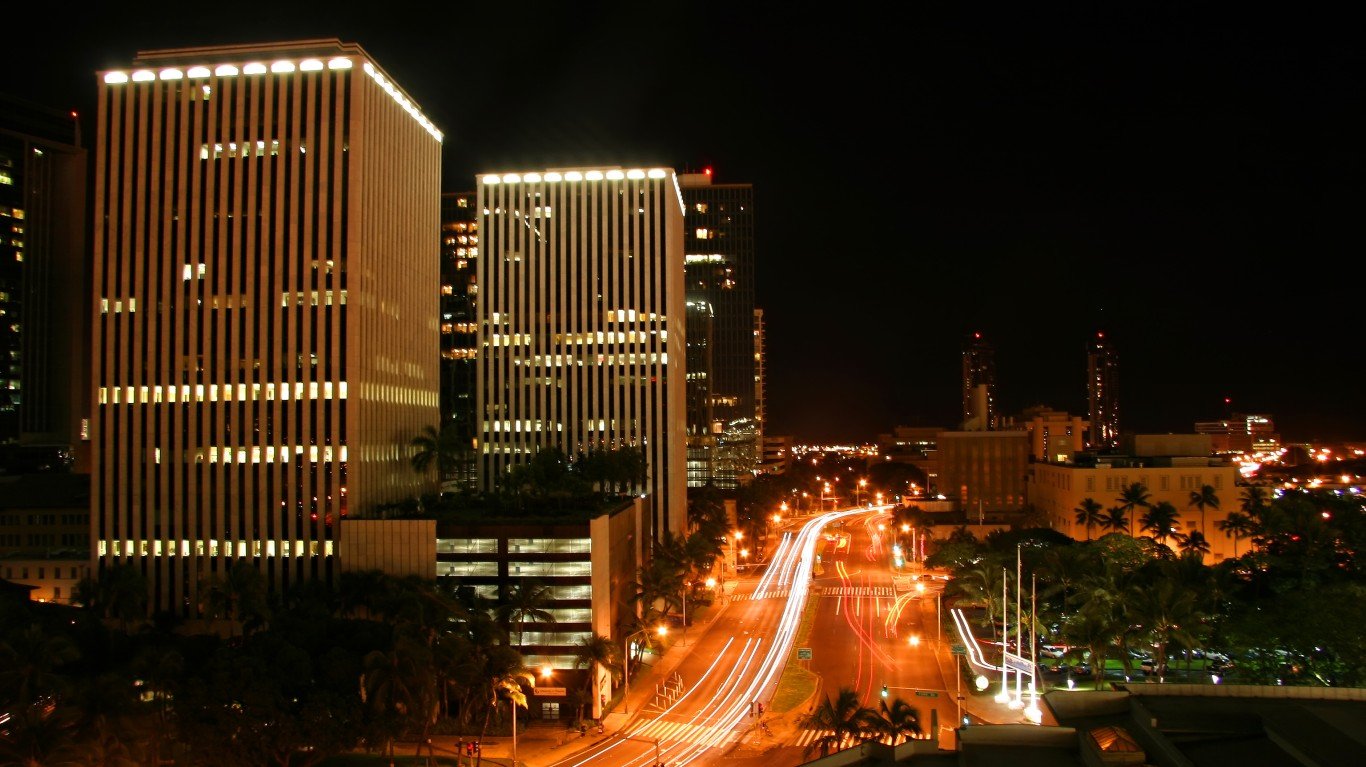
Hawaii: Urban Honolulu
> Avg. time lost to traffic delays, 2020: 24 hours per commuter
> Incidents of auto theft, 2021: 331 per 100,000 people (230 per 100,000 in state)
> Fatal crash rate, 2020: 4.9 per 100,000 people (5.6 per 100,000 in state)
> Avg. commute time to work in 2021: 25.8 minutes (25.3 minutes in state)
> Metro areas considered in state: 2
[in-text-ad]
Source: peeterv / iStock via Getty Images
Idaho: Boise City
> Avg. time lost to traffic delays, 2020: 18 hours per commuter
> Incidents of auto theft, 2021: 94 per 100,000 people (97 per 100,000 in state)
> Fatal crash rate, 2020: 6.4 per 100,000 people (9.9 per 100,000 in state)
> Avg. commute time to work in 2021: 22.7 minutes (21.6 minutes in state)
> Metro areas considered in state: 5
 24/7 Wall St.
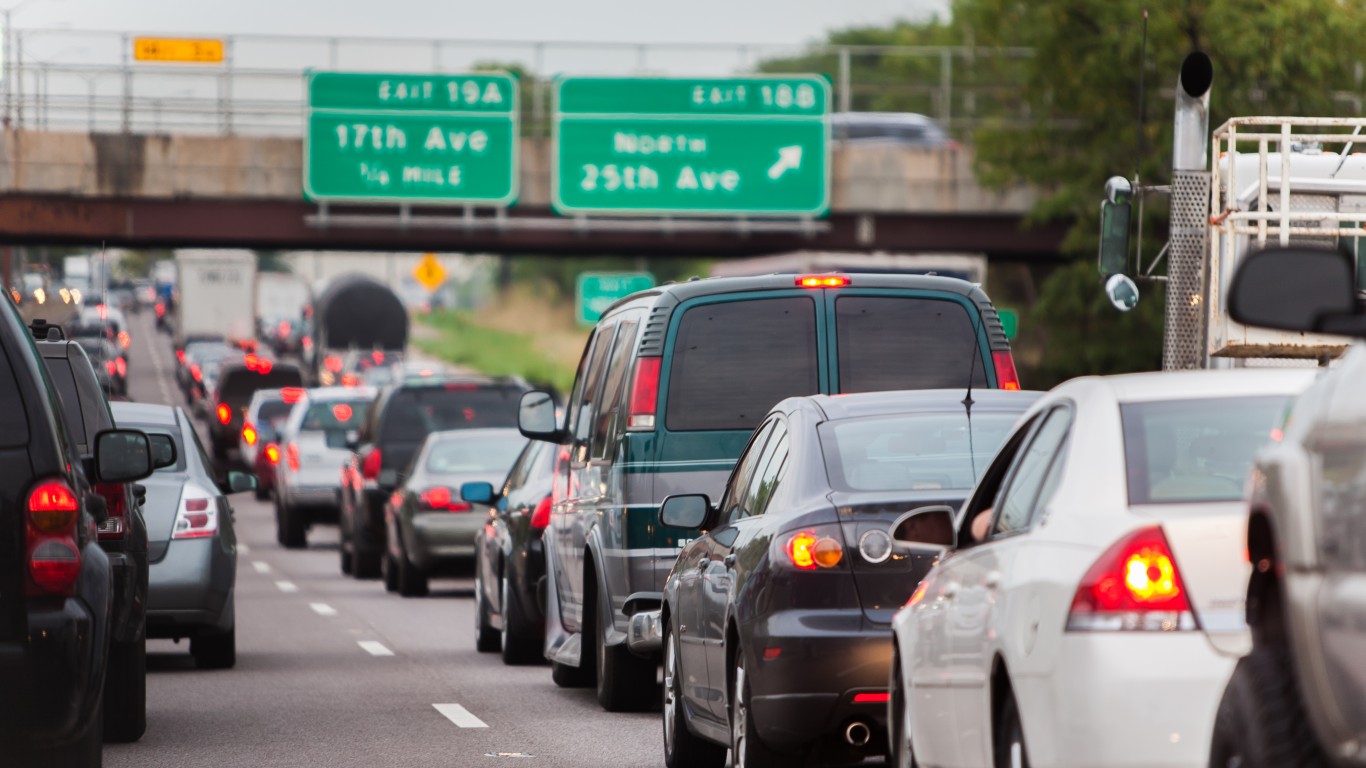
Source: Allkindza / E+ via Getty Images
Illinois: Chicago-Naperville-Elgin
> Avg. time lost to traffic delays, 2020: 39 hours per commuter
> Incidents of auto theft, 2021: 247 per 100,000 people (225 per 100,000 in state)
> Fatal crash rate, 2020: 6.8 per 100,000 people (8.6 per 100,000 in state)
> Avg. commute time to work in 2021: 29.0 minutes (26.8 minutes in state)
> Metro areas considered in state: 10
Source: RudyBalasko / Getty Images
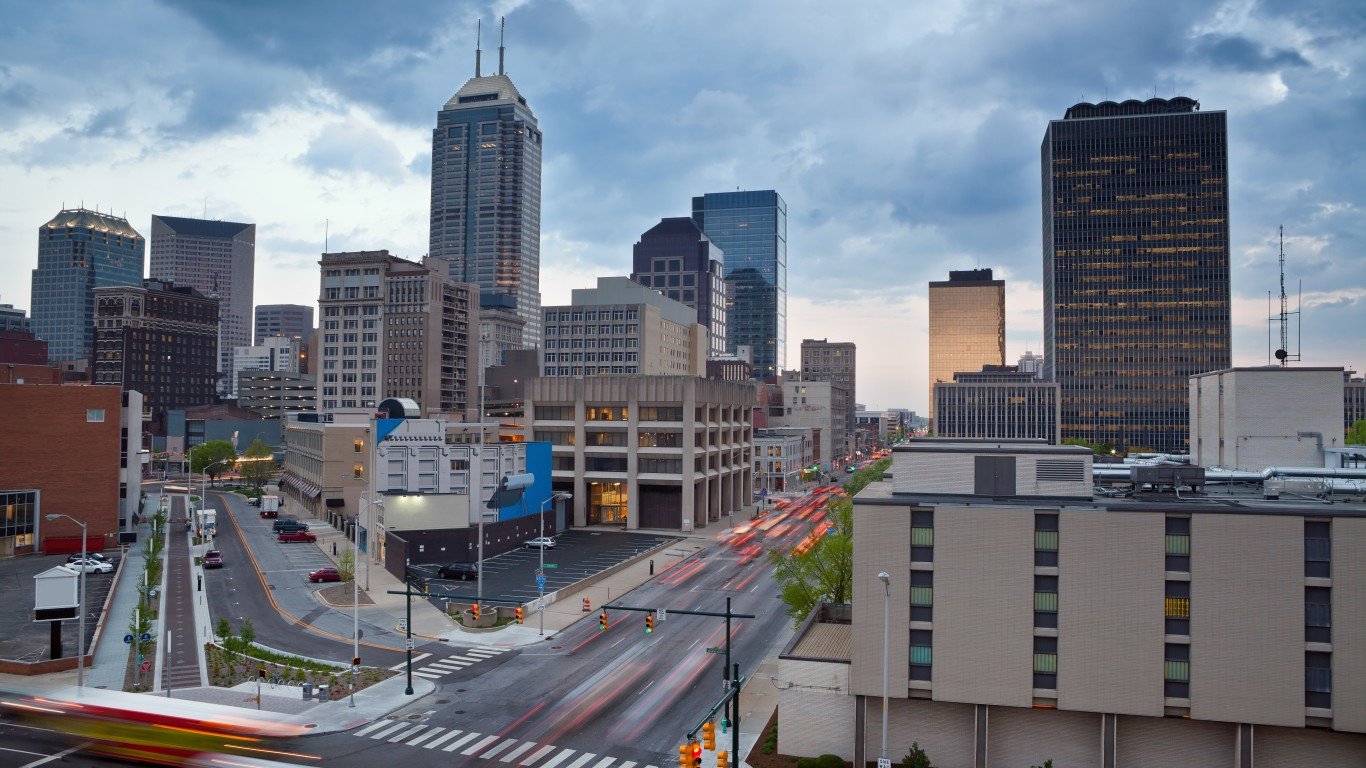
Indiana: Indianapolis-Carmel-Anderson
> Avg. time lost to traffic delays, 2020: 26 hours per commuter
> Incidents of auto theft, 2021: 360 per 100,000 people (236 per 100,000 in state)
> Fatal crash rate, 2020: 11.0 per 100,000 people (12.0 per 100,000 in state)
> Avg. commute time to work in 2021: 24.9 minutes (23.8 minutes in state)
> Metro areas considered in state: 12
[in-text-ad-2]

Source: DenisTangneyJr / E+ via Getty Images
Iowa: Davenport-Moline-Rock Island
> Avg. time lost to traffic delays, 2020: 9 hours per commuter
> Incidents of auto theft, 2021: 319 per 100,000 people (185 per 100,000 in state)
> Fatal crash rate, 2020: 8.1 per 100,000 people (9.5 per 100,000 in state)
> Avg. commute time to work in 2021: 21.6 minutes (19.7 minutes in state)
> Metro areas considered in state: 8

Source: Sean Pavone / iStock via Getty Images
Kansas: Wichita
> Avg. time lost to traffic delays, 2020: 25 hours per commuter
> Incidents of auto theft, 2021: 479 per 100,000 people (312 per 100,000 in state)
> Fatal crash rate, 2020: 12.0 per 100,000 people (13.0 per 100,000 in state)
> Avg. commute time to work in 2021: 20.1 minutes (19.6 minutes in state)
> Metro areas considered in state: 4
[in-text-ad]
Source: catnap72 / E+ via Getty Images
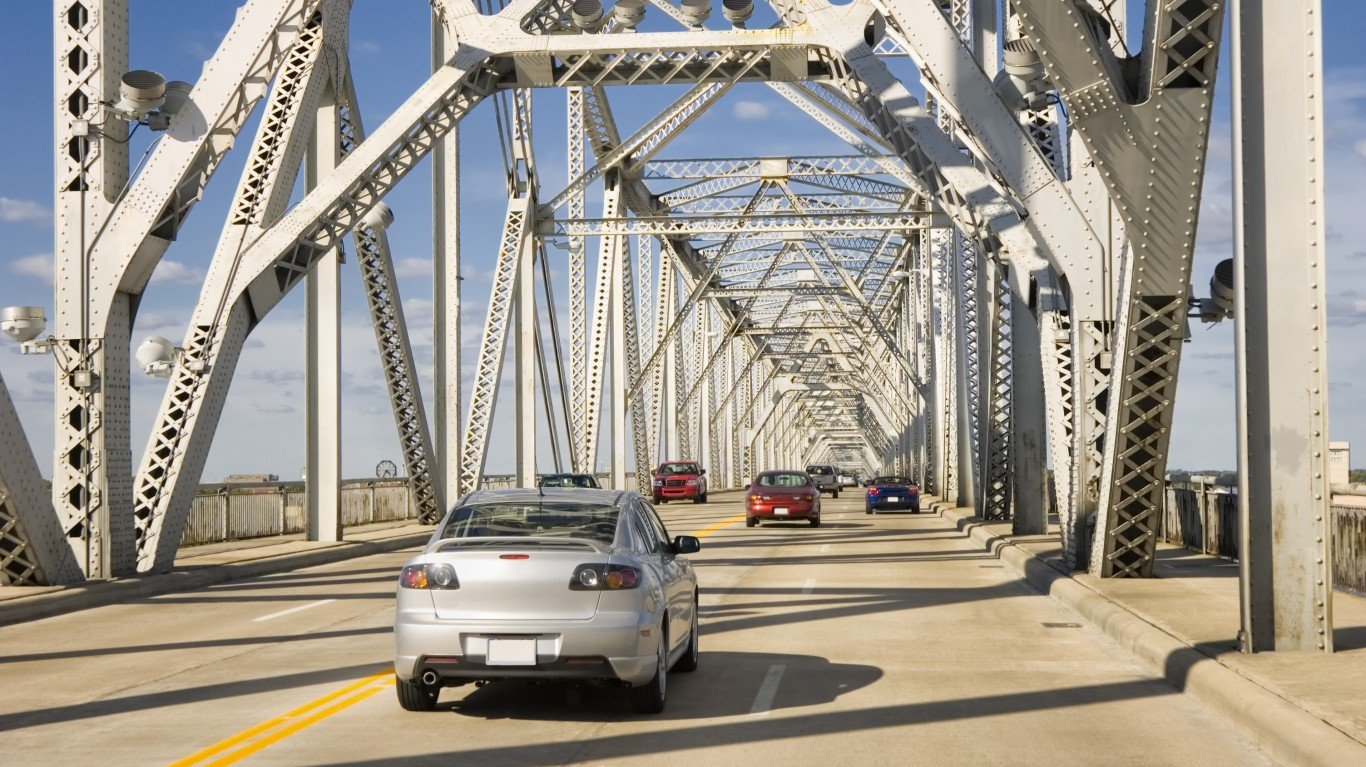
Kentucky: Louisville/Jefferson County
> Avg. time lost to traffic delays, 2020: 22 hours per commuter
> Incidents of auto theft, 2021: 457 per 100,000 people (237 per 100,000 in state)
> Fatal crash rate, 2020: 14.6 per 100,000 people (15.7 per 100,000 in state)
> Avg. commute time to work in 2021: 22.8 minutes (23.6 minutes in state)
> Metro areas considered in state: 5
 24/7 Wall St.
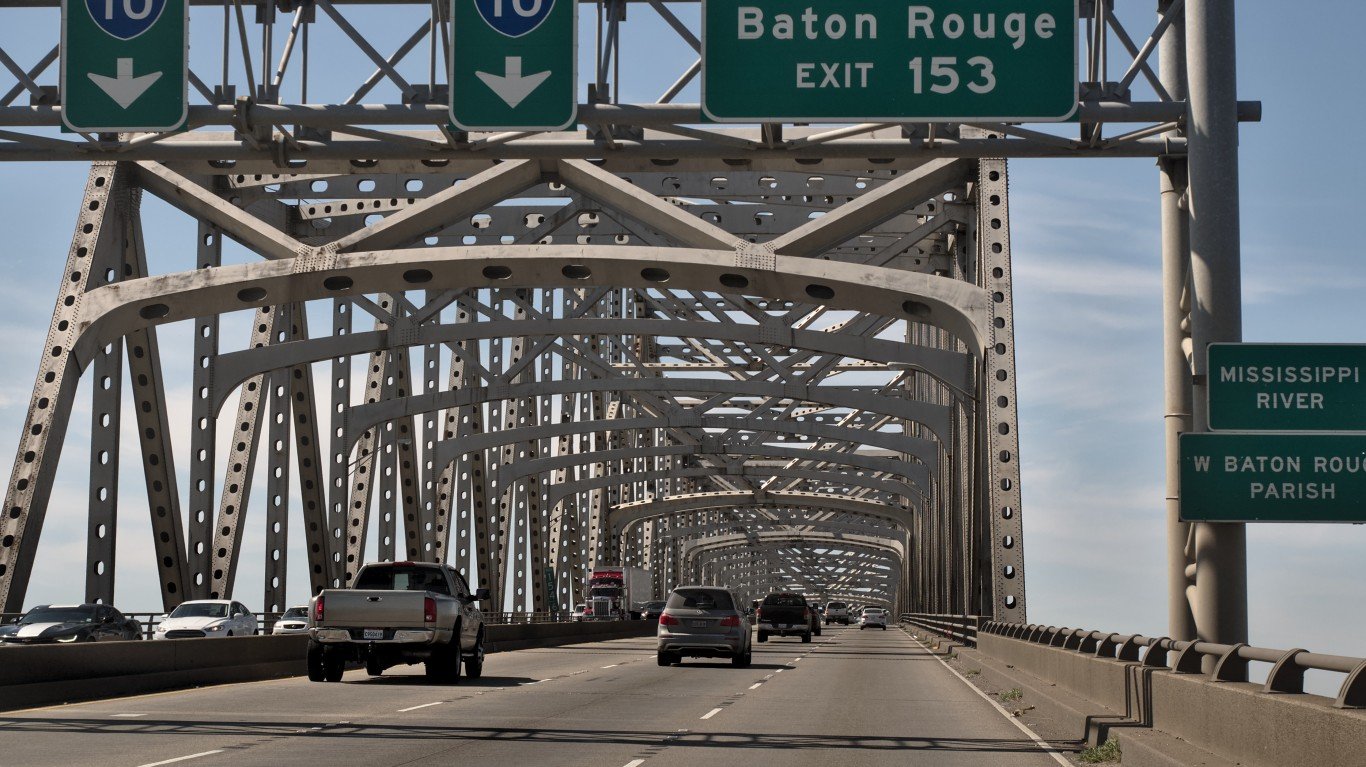
Source: Roberto Michel / iStock Editorial via Getty Images
Louisiana: Baton Rouge
> Avg. time lost to traffic delays, 2020: 24 hours per commuter
> Incidents of auto theft, 2021: 253 per 100,000 people (281 per 100,000 in state)
> Fatal crash rate, 2020: 19.4 per 100,000 people (16.5 per 100,000 in state)
> Avg. commute time to work in 2021: 27.6 minutes (25.5 minutes in state)
> Metro areas considered in state: 9

Source: DenisTangneyJr / iStock via Getty Images
Maine: Bangor
> Avg. time lost to traffic delays, 2020: 14 hours per commuter
> Incidents of auto theft, 2021: 96 per 100,000 people (61 per 100,000 in state)
> Fatal crash rate, 2020: 11.8 per 100,000 people (11.0 per 100,000 in state)
> Avg. commute time to work in 2021: 23.3 minutes (24.2 minutes in state)
> Metro areas considered in state: 3
[in-text-ad-2]

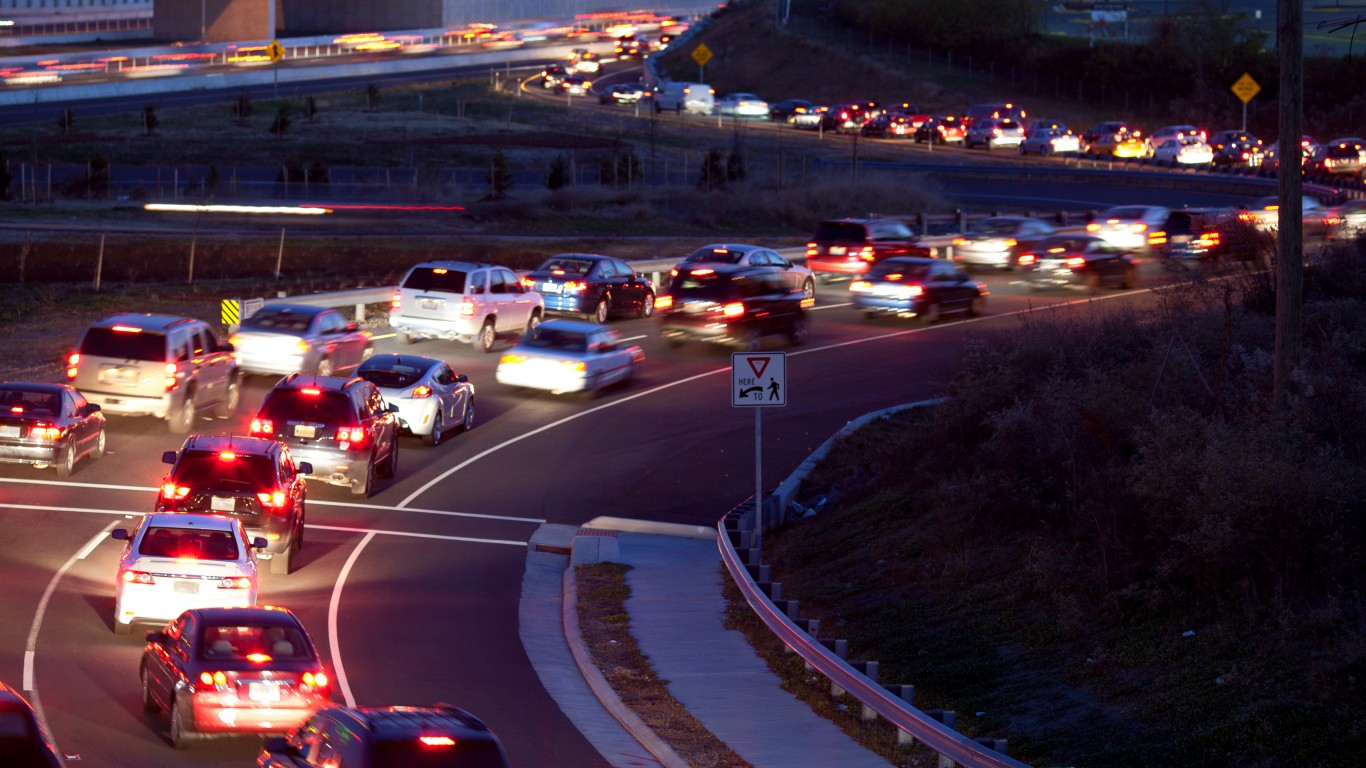
Maryland: Baltimore-Columbia-Towson
> Avg. time lost to traffic delays, 2020: 27 hours per commuter
> Incidents of auto theft, 2021: 238 per 100,000 people (223 per 100,000 in state)
> Fatal crash rate, 2020: 8.1 per 100,000 people (8.8 per 100,000 in state)
> Avg. commute time to work in 2021: 27.7 minutes (29.3 minutes in state)
> Metro areas considered in state: 5
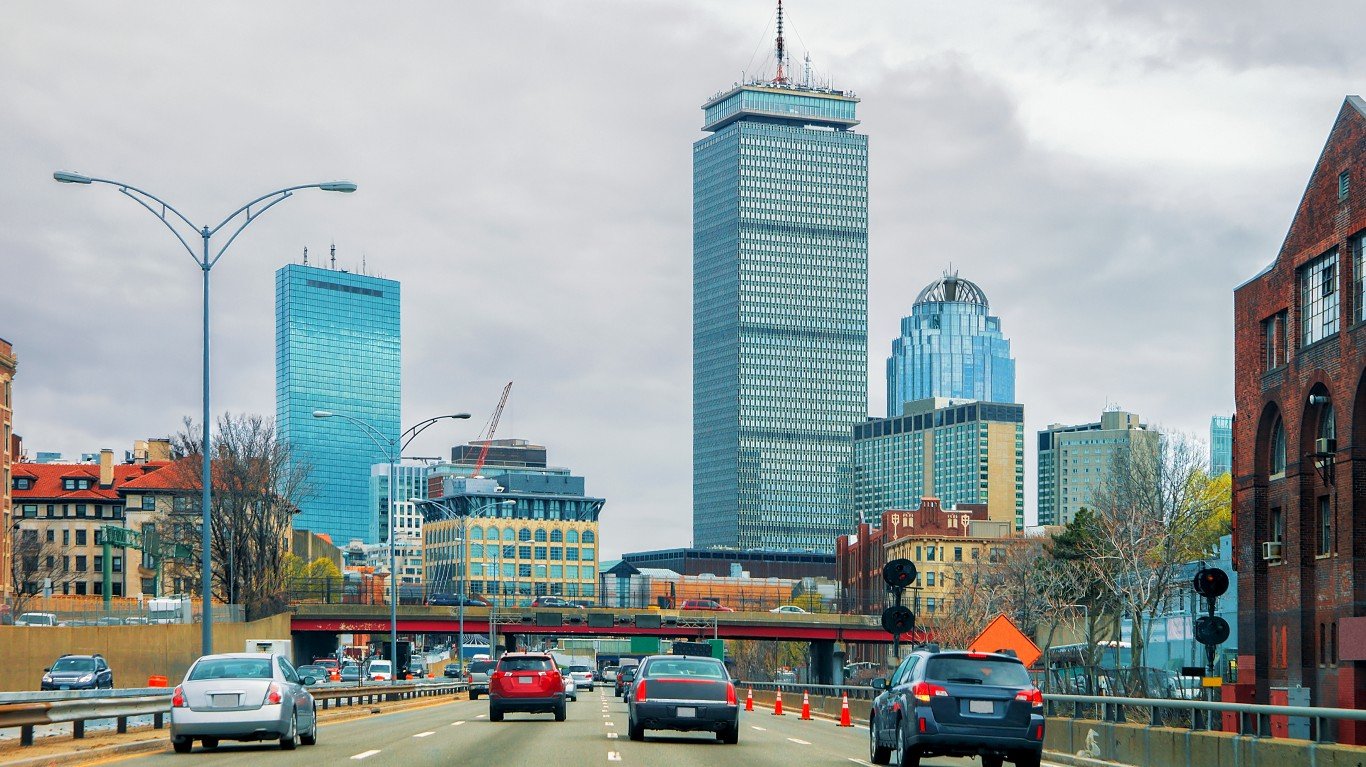
Source: RomanBabakin / iStock via Getty Images
Massachusetts: Boston-Cambridge-Newton
> Avg. time lost to traffic delays, 2020: 50 hours per commuter
> Incidents of auto theft, 2021: 97 per 100,000 people (100 per 100,000 in state)
> Fatal crash rate, 2020: 4.1 per 100,000 people (4.7 per 100,000 in state)
> Avg. commute time to work in 2021: 28.4 minutes (27.5 minutes in state)
> Metro areas considered in state: 5
[in-text-ad]
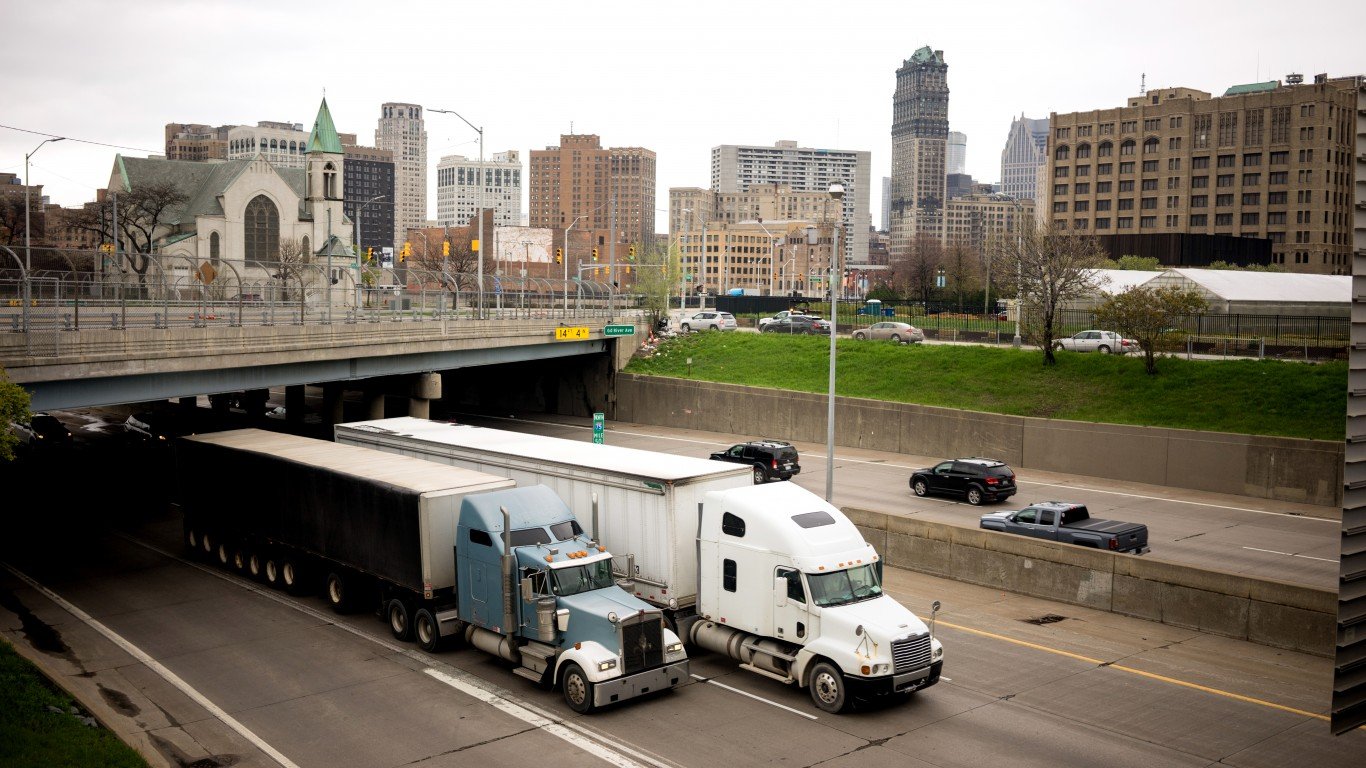
Source: ChrisBoswell / iStock via Getty Images
Michigan: Detroit-Warren-Dearborn
> Avg. time lost to traffic delays, 2020: 35 hours per commuter
> Incidents of auto theft, 2021: 290 per 100,000 people (212 per 100,000 in state)
> Fatal crash rate, 2020: 8.7 per 100,000 people (10.1 per 100,000 in state)
> Avg. commute time to work in 2021: 25.4 minutes (23.8 minutes in state)
> Metro areas considered in state: 13
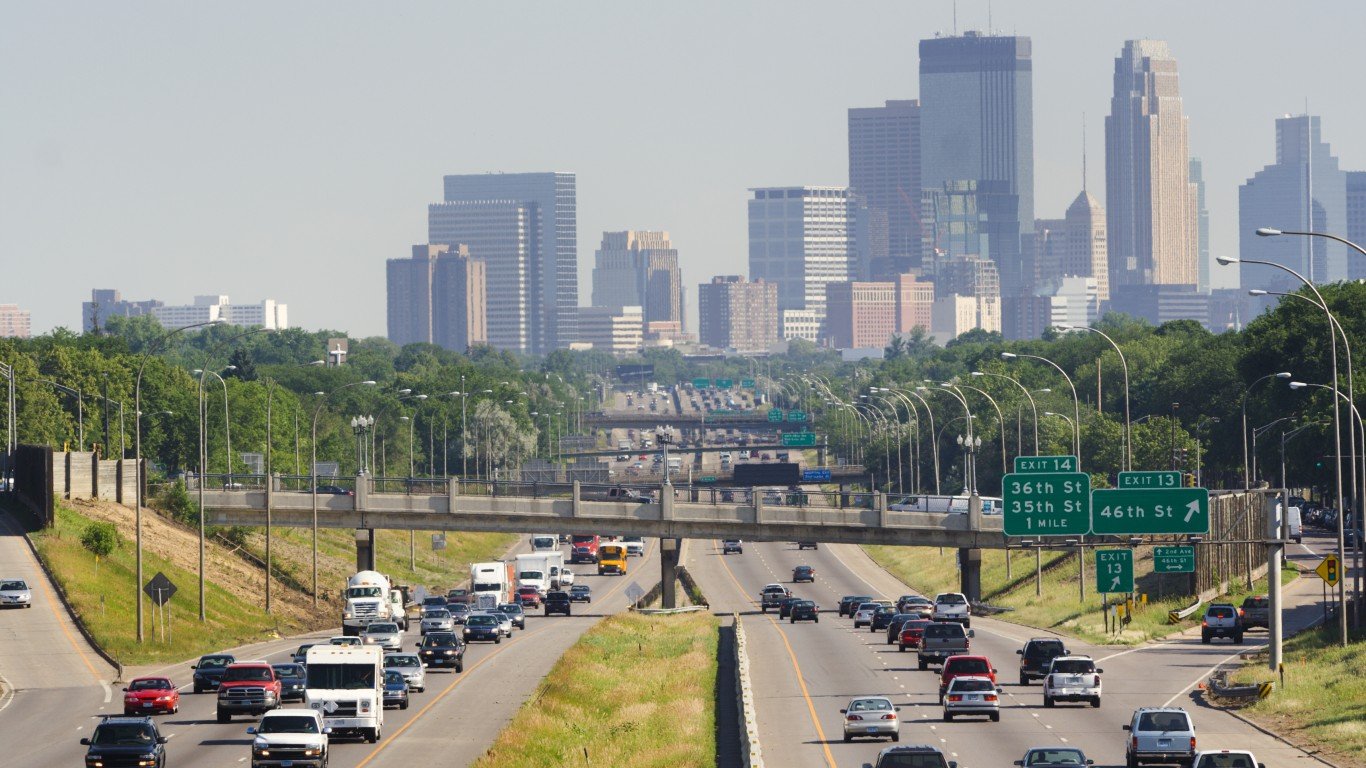
Source: YinYang / E+ via Getty Images
Minnesota: Minneapolis-St. Paul-Bloomington
> Avg. time lost to traffic delays, 2020: 32 hours per commuter
> Incidents of auto theft, 2021: 380 per 100,000 people (297 per 100,000 in state)
> Fatal crash rate, 2020: 4.4 per 100,000 people (6.5 per 100,000 in state)
> Avg. commute time to work in 2021: 23.3 minutes (22.2 minutes in state)
> Metro areas considered in state: 5
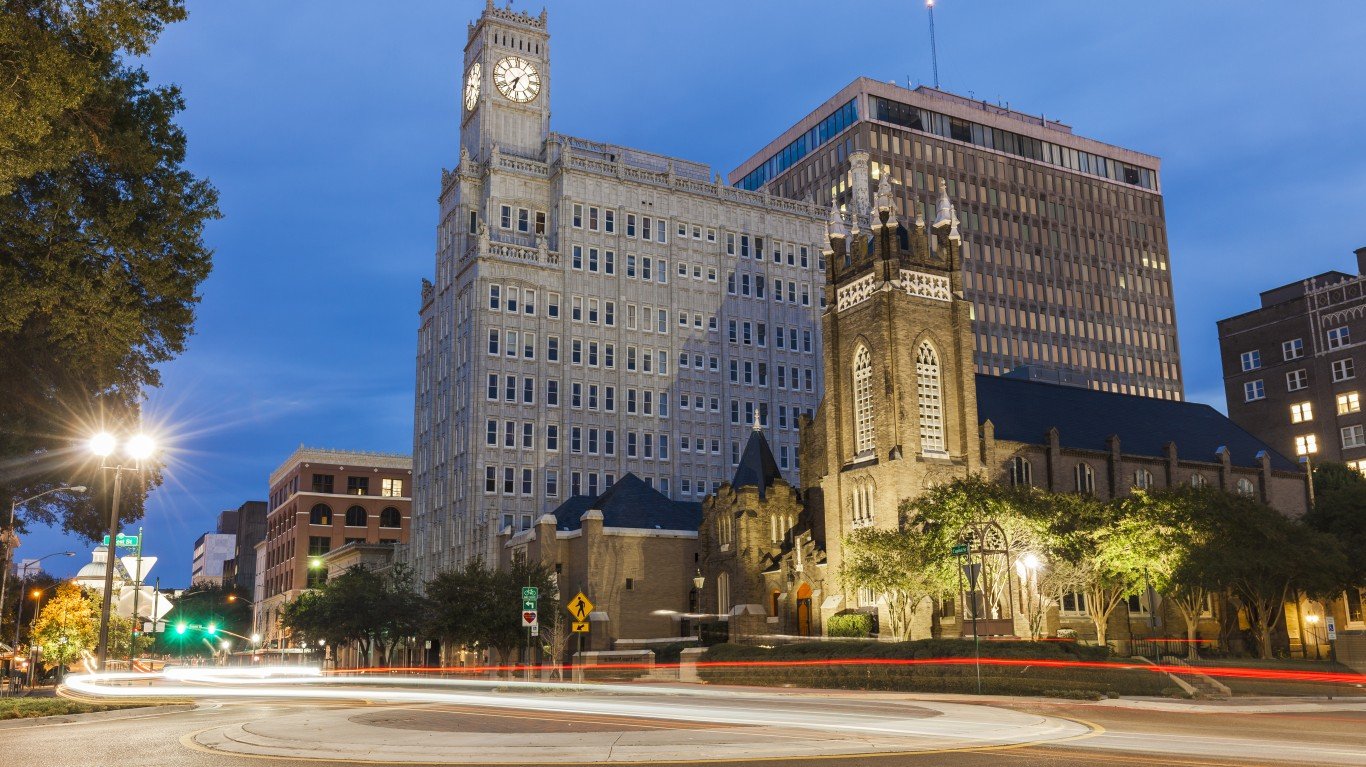
Source: traveler1116 / iStock via Getty Images
Mississippi: Jackson
> Avg. time lost to traffic delays, 2020: 29 hours per commuter
> Incidents of auto theft, 2021: 295 per 100,000 people (217 per 100,000 in state)
> Fatal crash rate, 2020: 19.6 per 100,000 people (23.3 per 100,000 in state)
> Avg. commute time to work in 2021: 25.2 minutes (25.2 minutes in state)
> Metro areas considered in state: 3
[in-text-ad-2]
Source: snipes213 / Getty Images
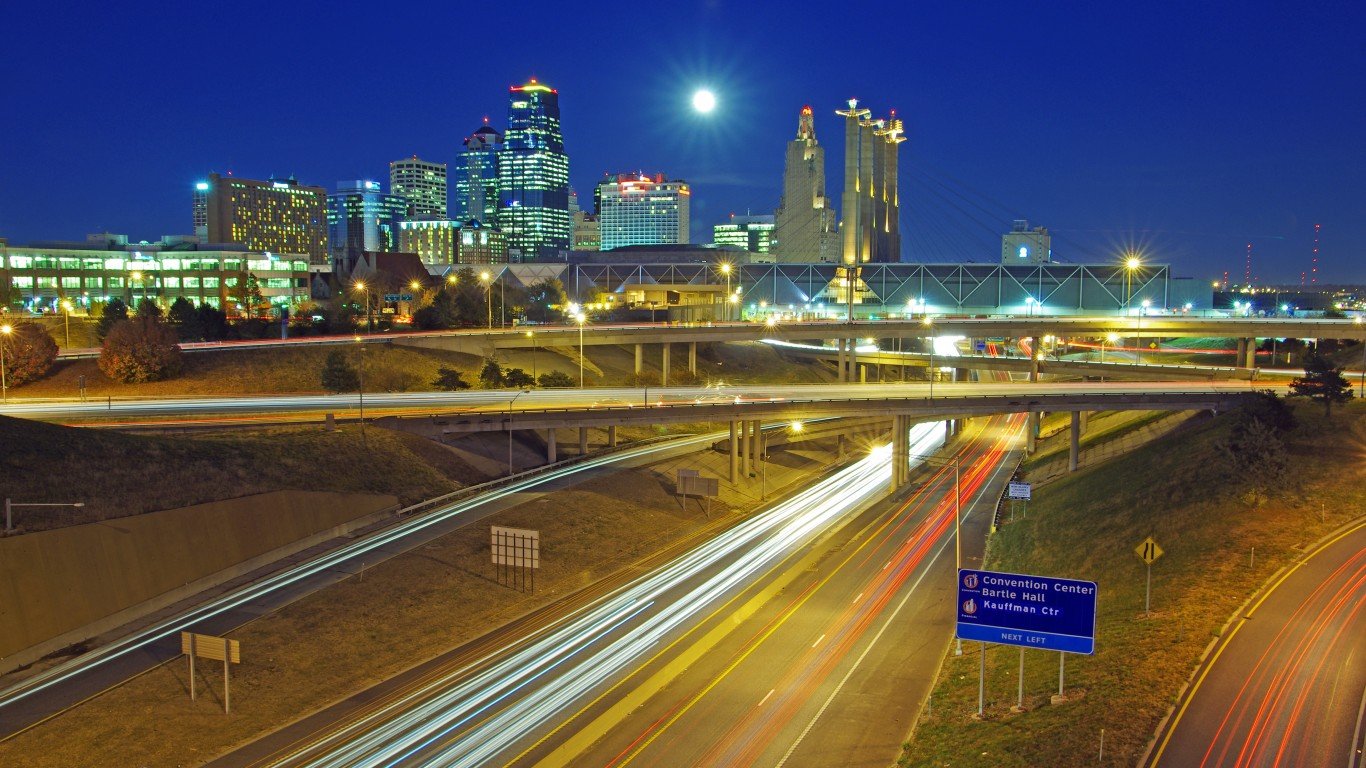
Missouri: Kansas City
> Avg. time lost to traffic delays, 2020: 34 hours per commuter
> Incidents of auto theft, 2021: 530 per 100,000 people (428 per 100,000 in state)
> Fatal crash rate, 2020: 10.9 per 100,000 people (14.8 per 100,000 in state)
> Avg. commute time to work in 2021: 23.0 minutes (23.1 minutes in state)
> Metro areas considered in state: 8
Source: peeterv / iStock via Getty Images
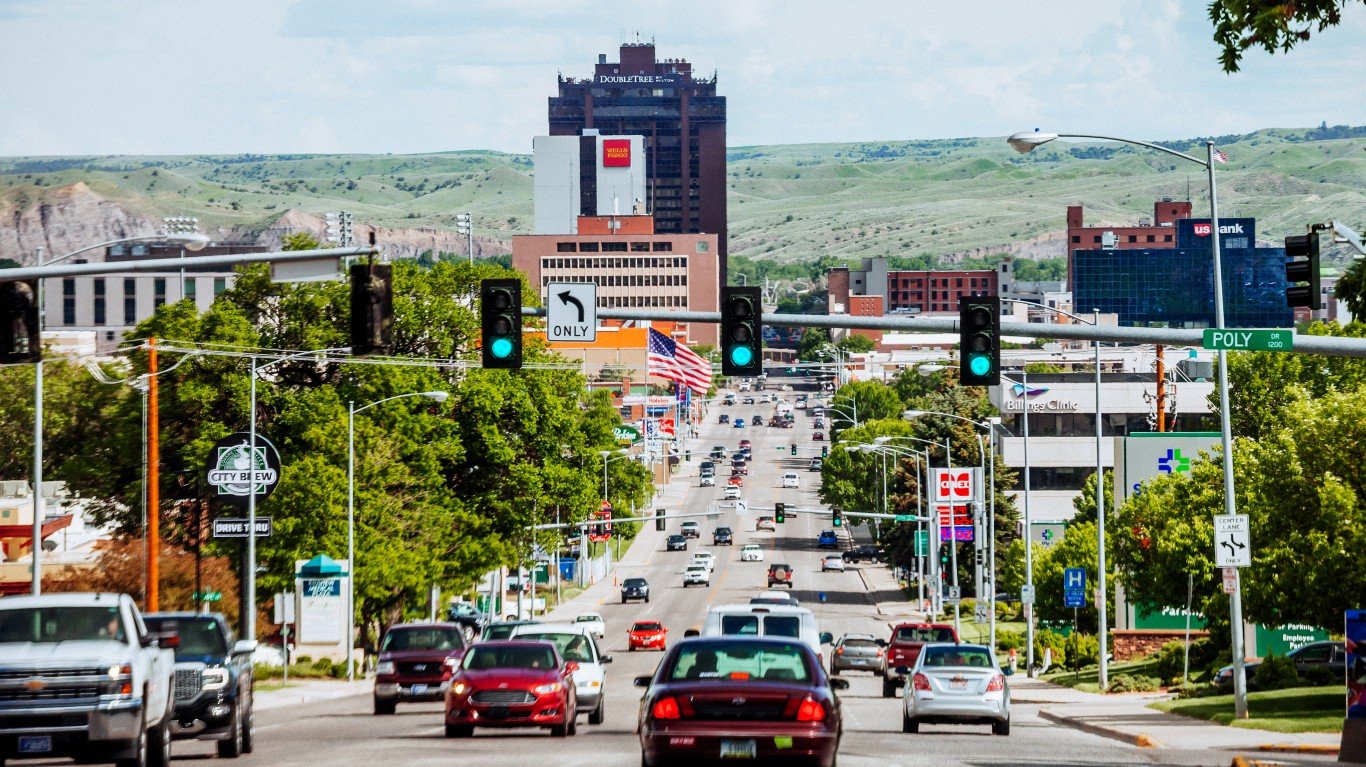
Montana: Billings
> Avg. time lost to traffic delays, 2020: 9 hours per commuter
> Incidents of auto theft, 2021: 611 per 100,000 people (264 per 100,000 in state)
> Fatal crash rate, 2020: 11.2 per 100,000 people (17.2 per 100,000 in state)
> Avg. commute time to work in 2021: 19.9 minutes (19.1 minutes in state)
> Metro areas considered in state: 3
[in-text-ad]
Source: RiverNorthPhotography / iStock Unreleased via Getty Images
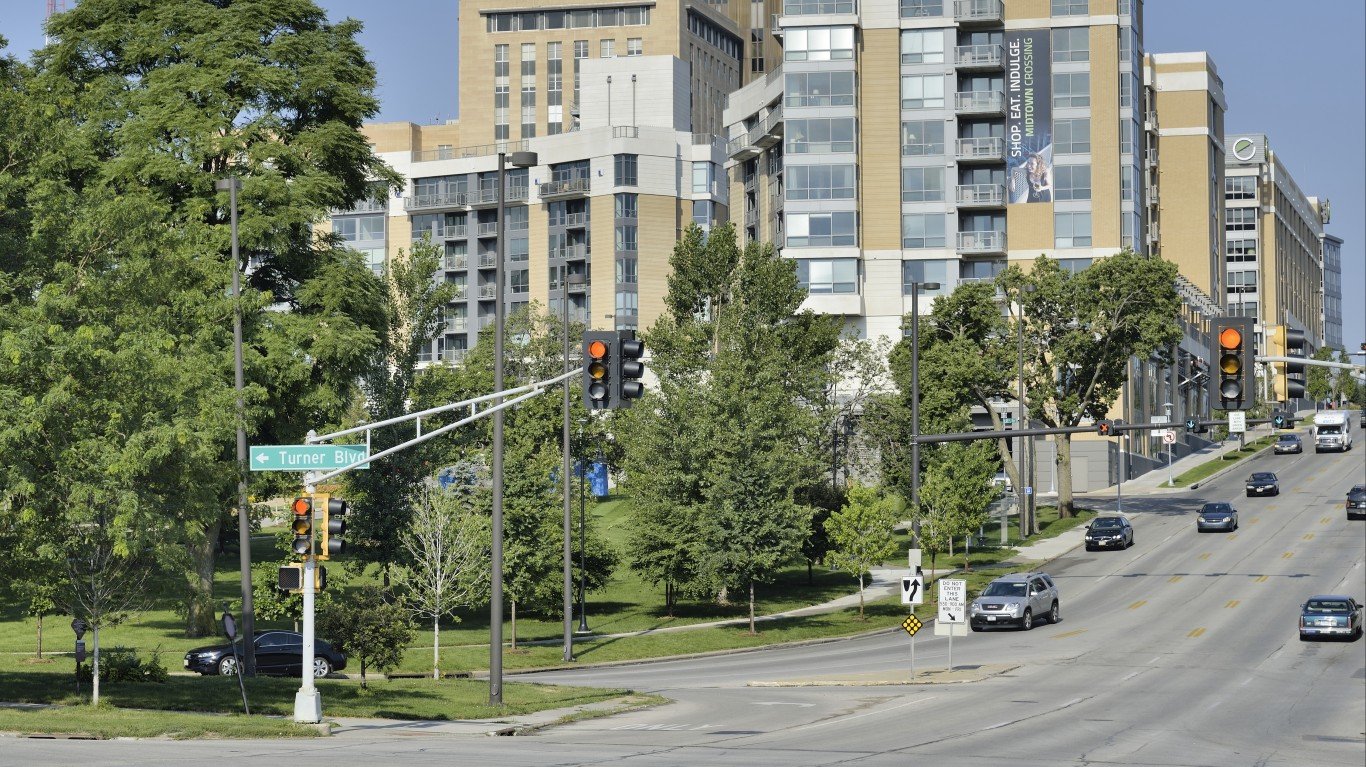
Nebraska: Omaha-Council Bluffs
> Avg. time lost to traffic delays, 2020: 19 hours per commuter
> Incidents of auto theft, 2021: 394 per 100,000 people (237 per 100,000 in state)
> Fatal crash rate, 2020: 8.2 per 100,000 people (11.1 per 100,000 in state)
> Avg. commute time to work in 2021: 20.8 minutes (19.3 minutes in state)
> Metro areas considered in state: 3
Source: franckreporter / iStock via Getty Images
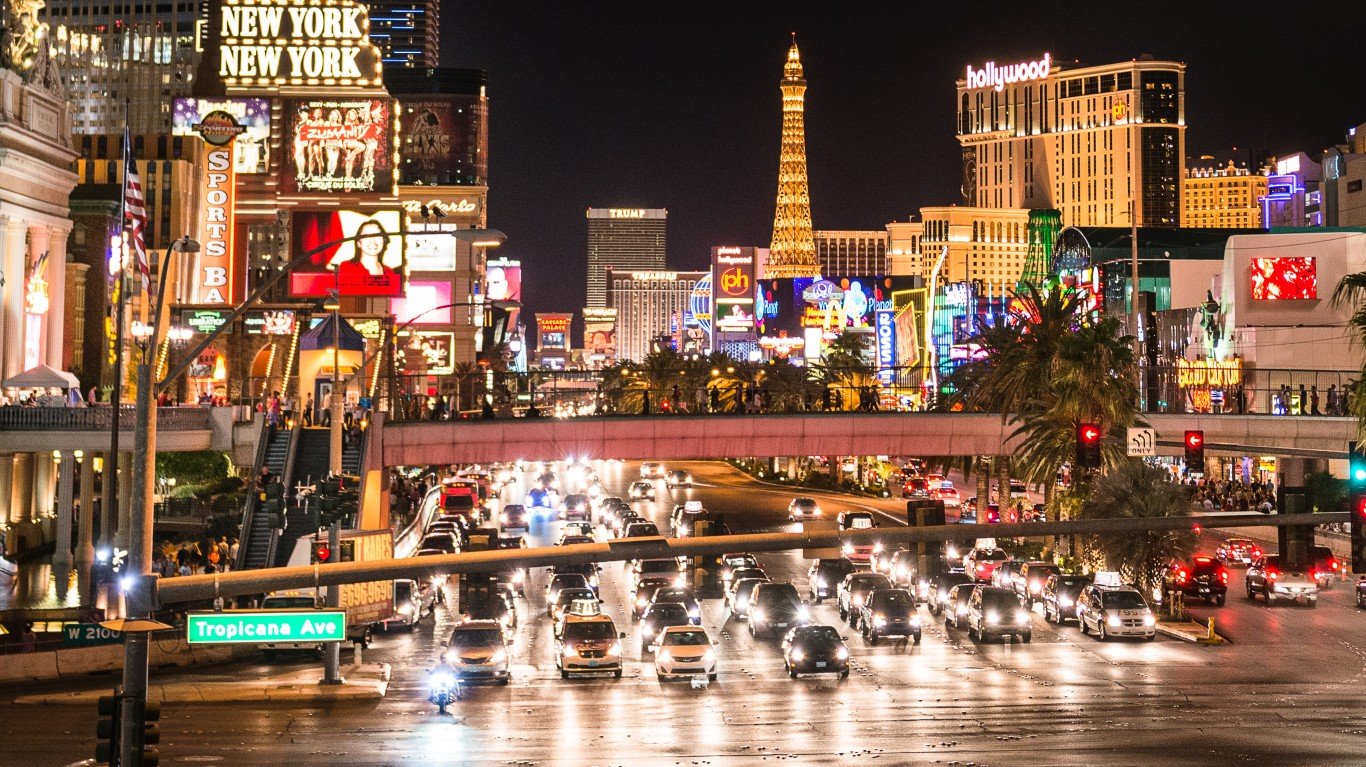
Nevada: Las Vegas-Henderson-Paradise
> Avg. time lost to traffic delays, 2020: 18 hours per commuter
> Incidents of auto theft, 2021: 476 per 100,000 people (427 per 100,000 in state)
> Fatal crash rate, 2020: 7.6 per 100,000 people (9.3 per 100,000 in state)
> Avg. commute time to work in 2021: 24.4 minutes (24.6 minutes in state)
> Metro areas considered in state: 3
Source: DenisTangneyJr / E+ via Getty Images
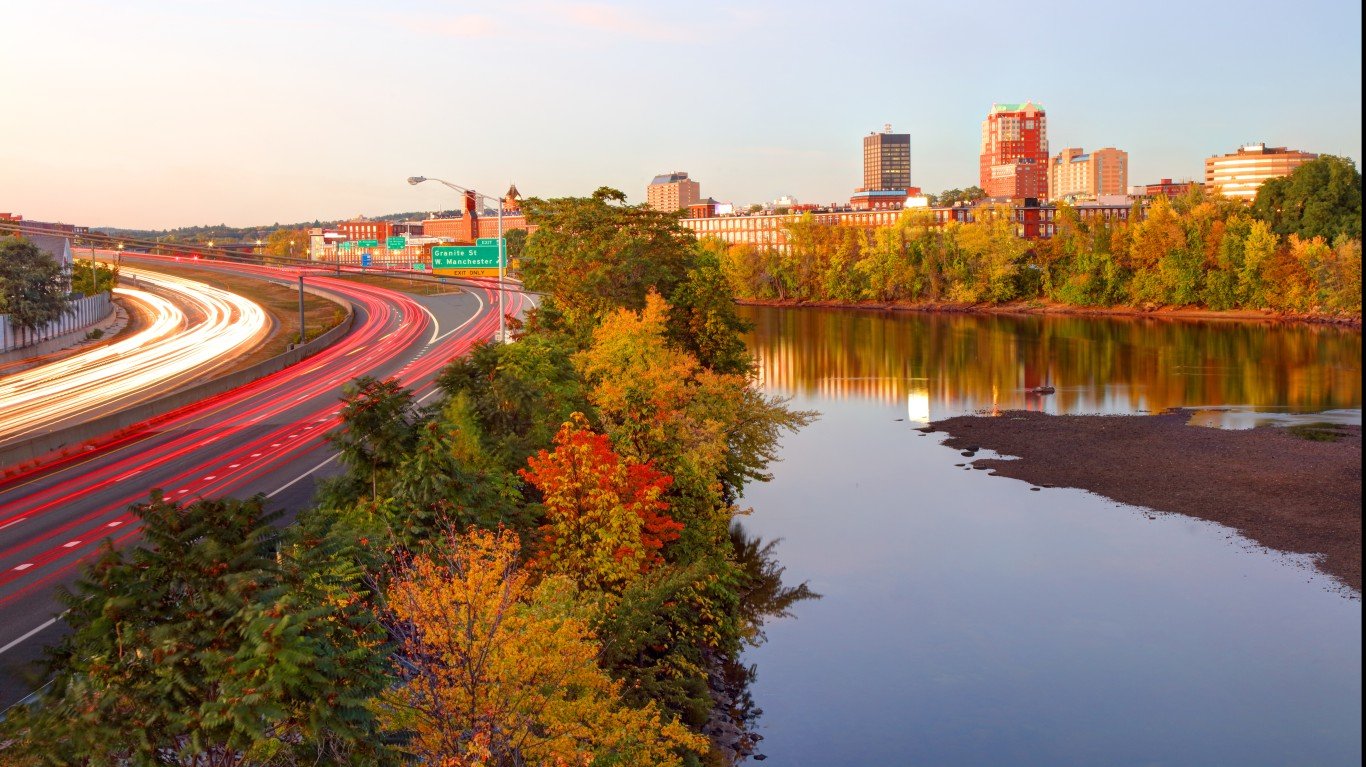
New Hampshire: Manchester-Nashua*
> Avg. time lost to traffic delays, 2020: 13 hours per commuter
> Incidents of auto theft, 2021: 82 per 100,000 people (62 per 100,000 in state)
> Fatal crash rate, 2020: 4.5 per 100,000 people (7.1 per 100,000 in state)
> Avg. commute time to work in 2021: 25.7 minutes (25.7 minutes in state)
> Metro areas considered in state: 1
*Because Manchester-Nashua is the only eligible metro area in New Hampshire, it ranks as the worst city to drive in by default.
[in-text-ad-2]

New Jersey: Atlantic City-Hammonton
> Avg. time lost to traffic delays, 2020: 16 hours per commuter
> Incidents of auto theft, 2021: 168 per 100,000 people (160 per 100,000 in state)
> Fatal crash rate, 2020: 13.8 per 100,000 people (5.9 per 100,000 in state)
> Avg. commute time to work in 2021: 25.7 minutes (28.6 minutes in state)
> Metro areas considered in state: 3
Source: KateLeigh / Getty Images
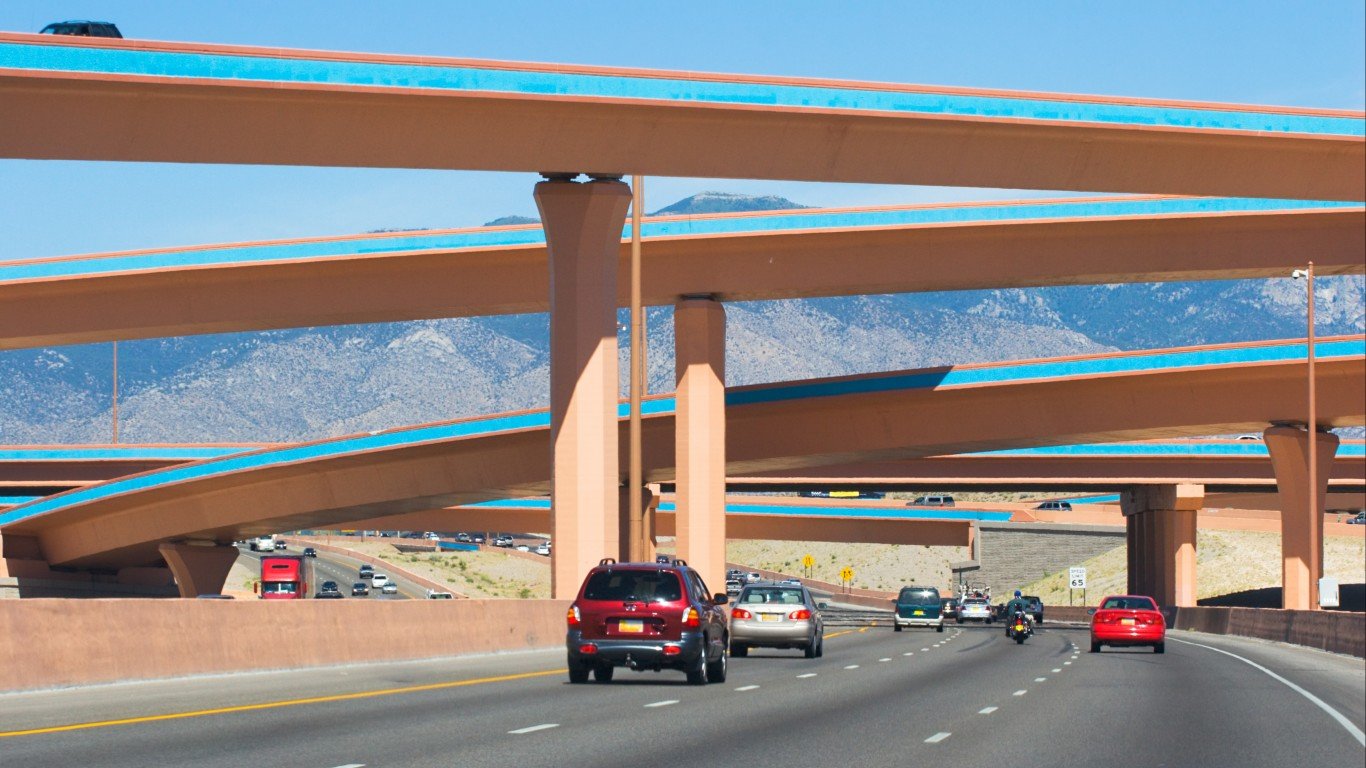
New Mexico: Albuquerque
> Avg. time lost to traffic delays, 2020: 22 hours per commuter
> Incidents of auto theft, 2021: 711 per 100,000 people (476 per 100,000 in state)
> Fatal crash rate, 2020: 14.3 per 100,000 people (17.3 per 100,000 in state)
> Avg. commute time to work in 2021: 24.7 minutes (23.2 minutes in state)
> Metro areas considered in state: 4
[in-text-ad]
Source: batuhanozdel / iStock via Getty Images
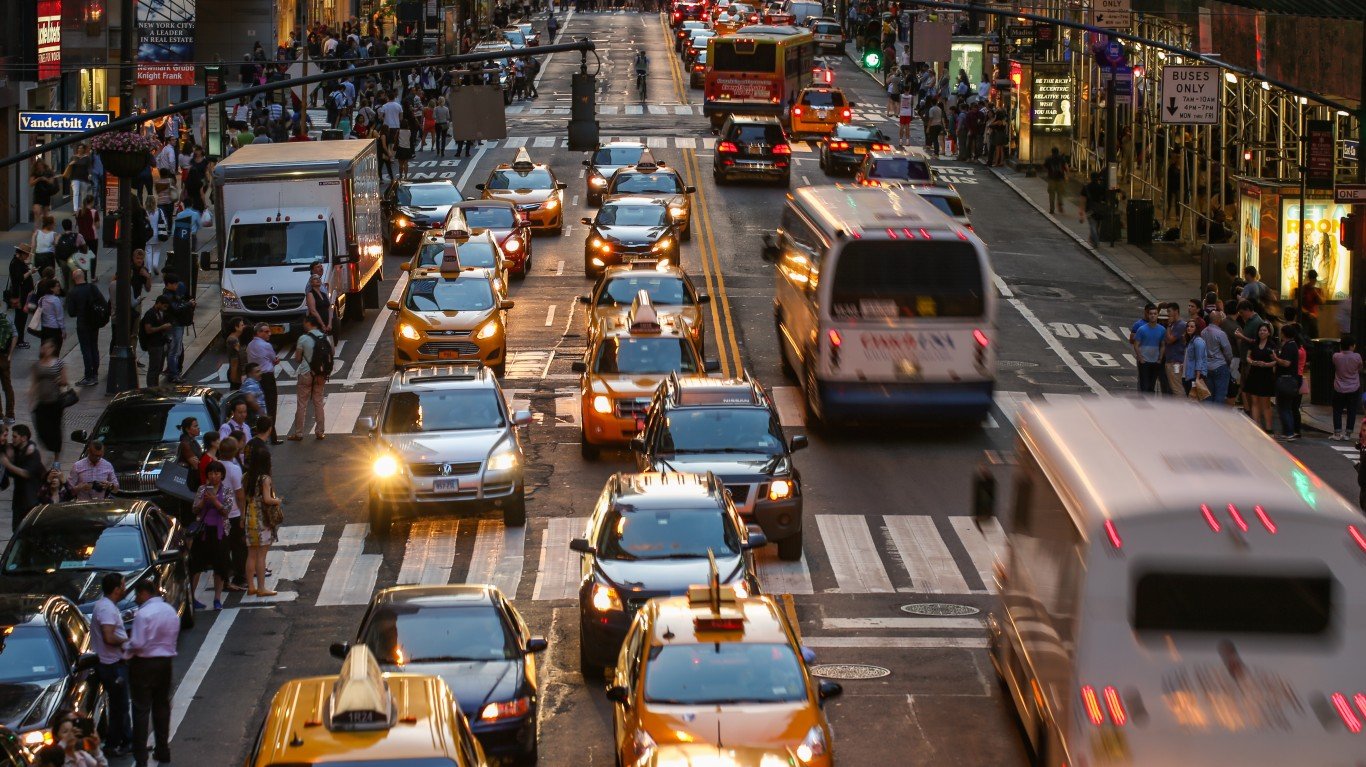
New York: New York-Newark-Jersey City
> Avg. time lost to traffic delays, 2020: 56 hours per commuter
> Incidents of auto theft, 2021: 132 per 100,000 people (116 per 100,000 in state)
> Fatal crash rate, 2020: 4.0 per 100,000 people (4.9 per 100,000 in state)
> Avg. commute time to work in 2021: 34.2 minutes (31.4 minutes in state)
> Metro areas considered in state: 13
Source: J. Michael Jones / iStock Editorial via Getty Images
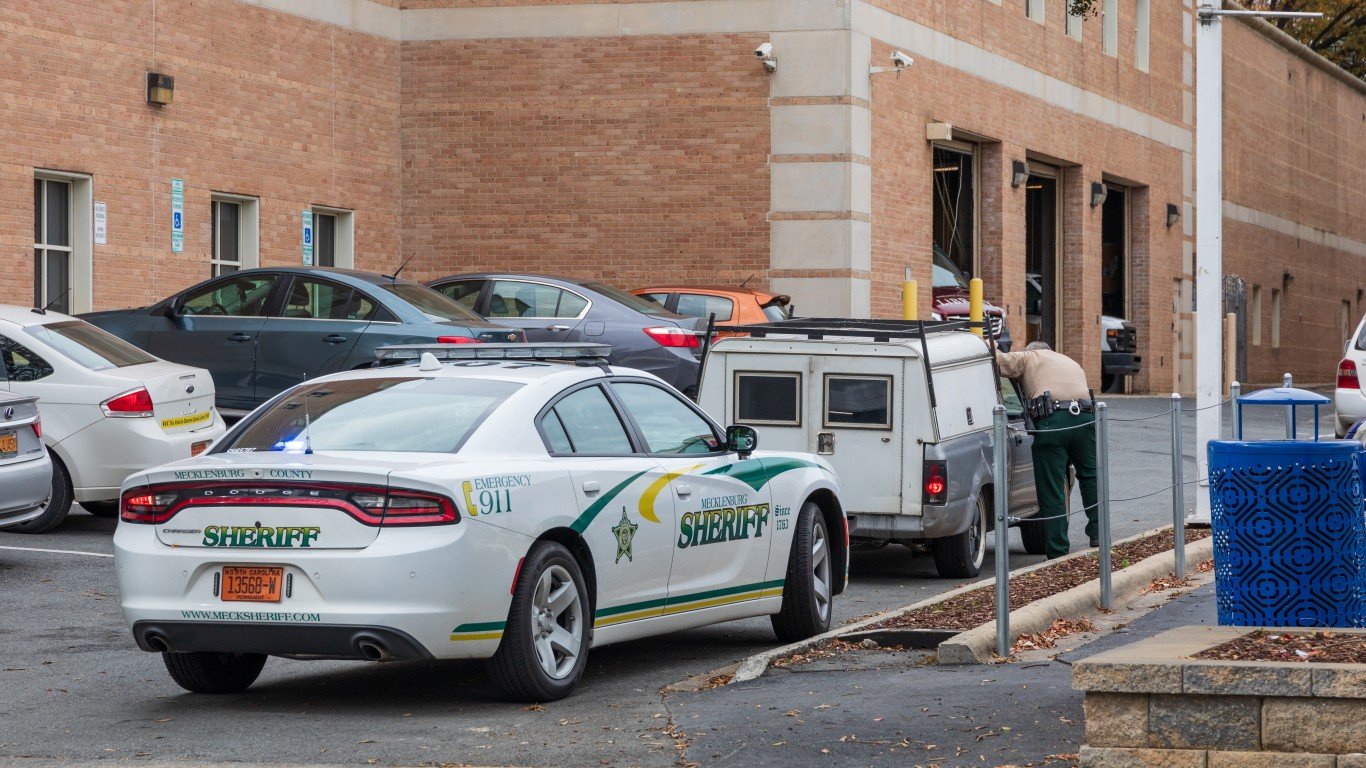
North Carolina: Charlotte-Concord-Gastonia
> Avg. time lost to traffic delays, 2020: 24 hours per commuter
> Incidents of auto theft, 2021: 258 per 100,000 people (213 per 100,000 in state)
> Fatal crash rate, 2020: 10.6 per 100,000 people (13.4 per 100,000 in state)
> Avg. commute time to work in 2021: 25.7 minutes (24.5 minutes in state)
> Metro areas considered in state: 15

Source: Nathan Livedalen / iStock via Getty Images
North Dakota: Bismarck
> Avg. time lost to traffic delays, 2020: 10 hours per commuter
> Incidents of auto theft, 2021: 224 per 100,000 people (224 per 100,000 in state)
> Fatal crash rate, 2020: 11.9 per 100,000 people (12.4 per 100,000 in state)
> Avg. commute time to work in 2021: 16.4 minutes (17.5 minutes in state)
> Metro areas considered in state: 3
[in-text-ad-2]
Source: 140641142@N05 / Flickr
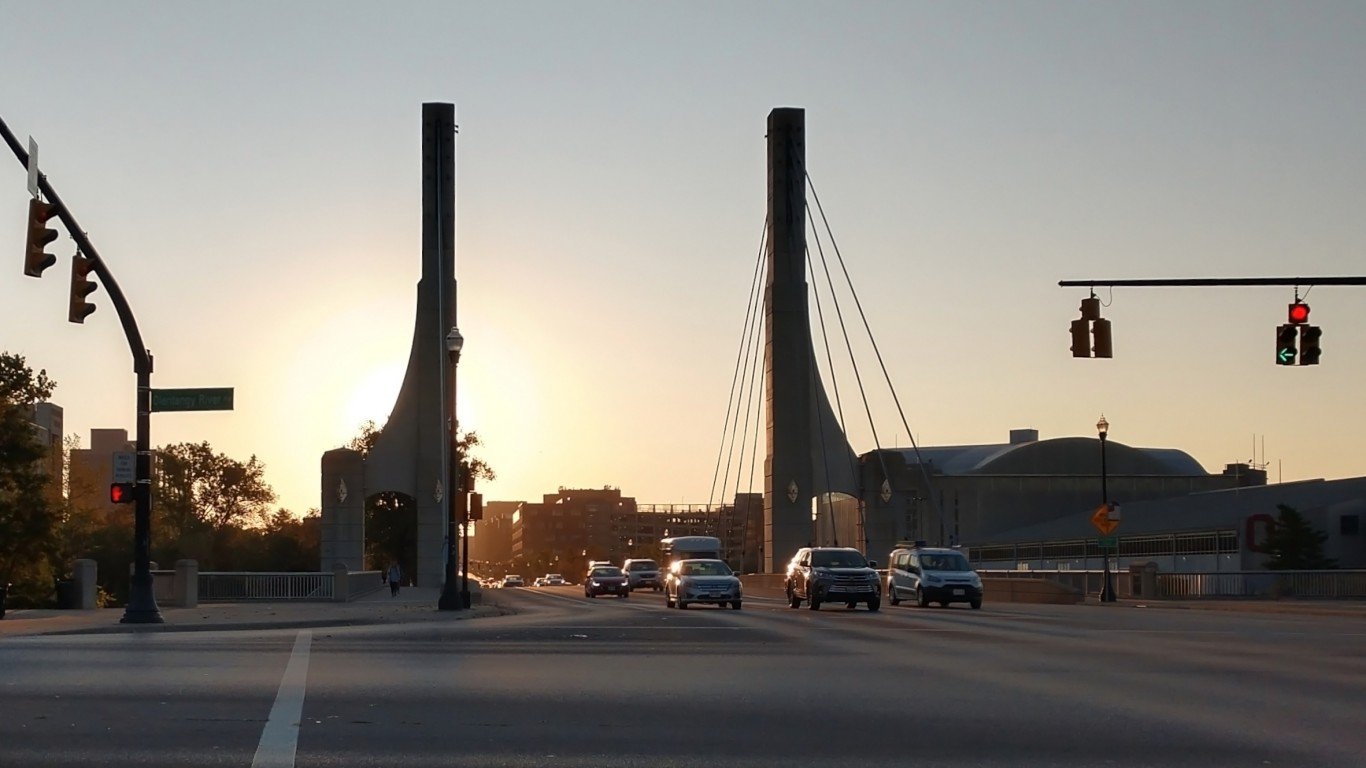
Ohio: Columbus
> Avg. time lost to traffic delays, 2020: 27 hours per commuter
> Incidents of auto theft, 2021: 368 per 100,000 people (236 per 100,000 in state)
> Fatal crash rate, 2020: 9.4 per 100,000 people (9.8 per 100,000 in state)
> Avg. commute time to work in 2021: 23.7 minutes (23.1 minutes in state)
> Metro areas considered in state: 12
Source: peeterv / iStock via Getty Images
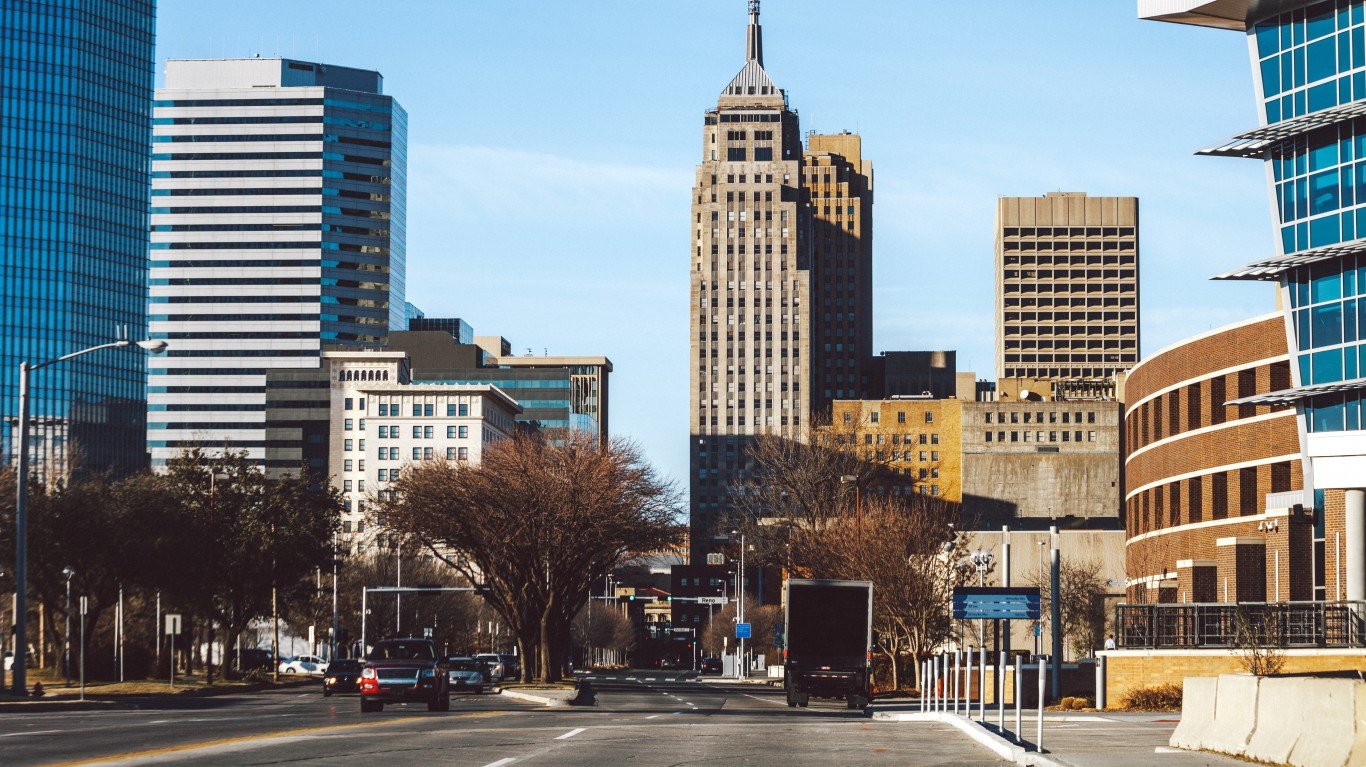
Oklahoma: Oklahoma City
> Avg. time lost to traffic delays, 2020: 35 hours per commuter
> Incidents of auto theft, 2021: 345 per 100,000 people (359 per 100,000 in state)
> Fatal crash rate, 2020: 11.4 per 100,000 people (15.0 per 100,000 in state)
> Avg. commute time to work in 2021: 23.3 minutes (22.0 minutes in state)
> Metro areas considered in state: 3
[in-text-ad]
Source: peeterv / iStock via Getty Images
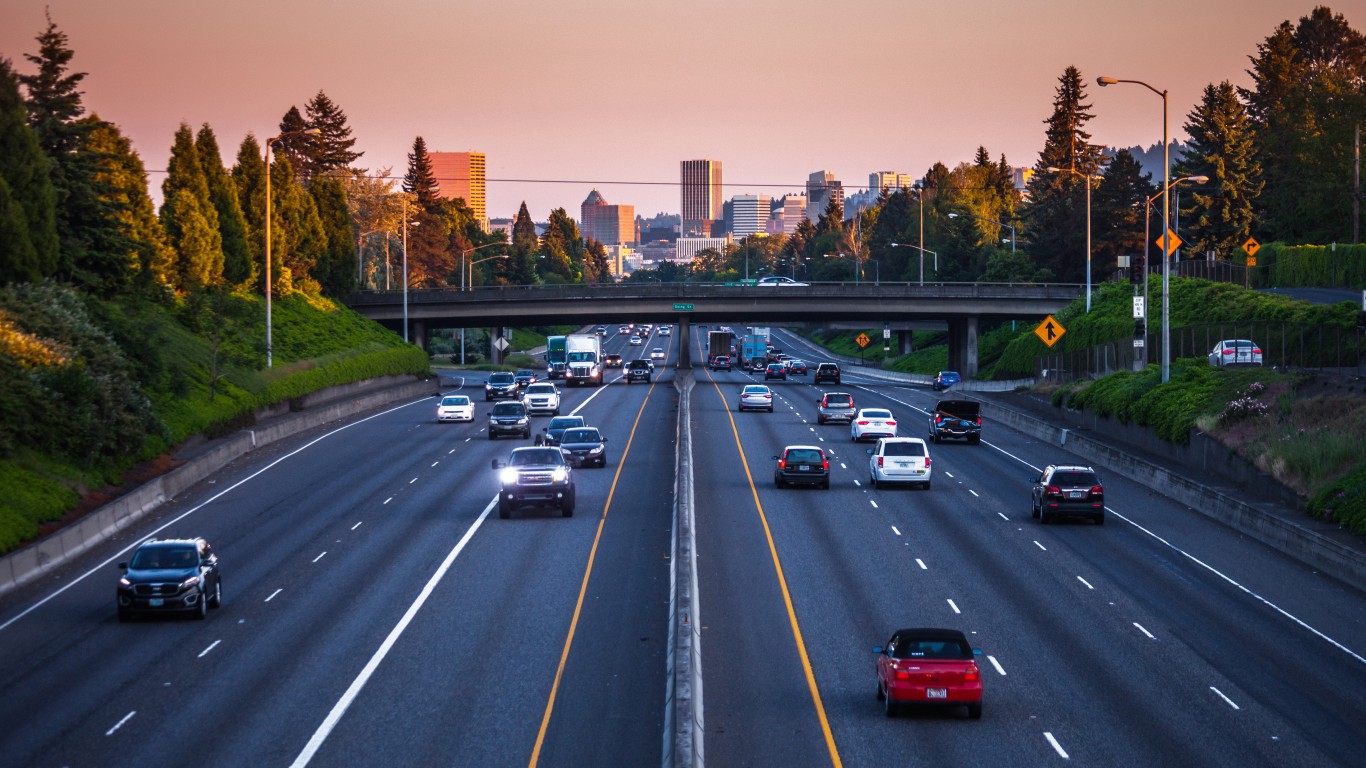
Oregon: Portland-Vancouver-Hillsboro
> Avg. time lost to traffic delays, 2020: 31 hours per commuter
> Incidents of auto theft, 2021: 680 per 100,000 people (471 per 100,000 in state)
> Fatal crash rate, 2020: 7.2 per 100,000 people (10.9 per 100,000 in state)
> Avg. commute time to work in 2021: 24.6 minutes (22.6 minutes in state)
> Metro areas considered in state: 8
Source: peeterv / iStock via Getty Images
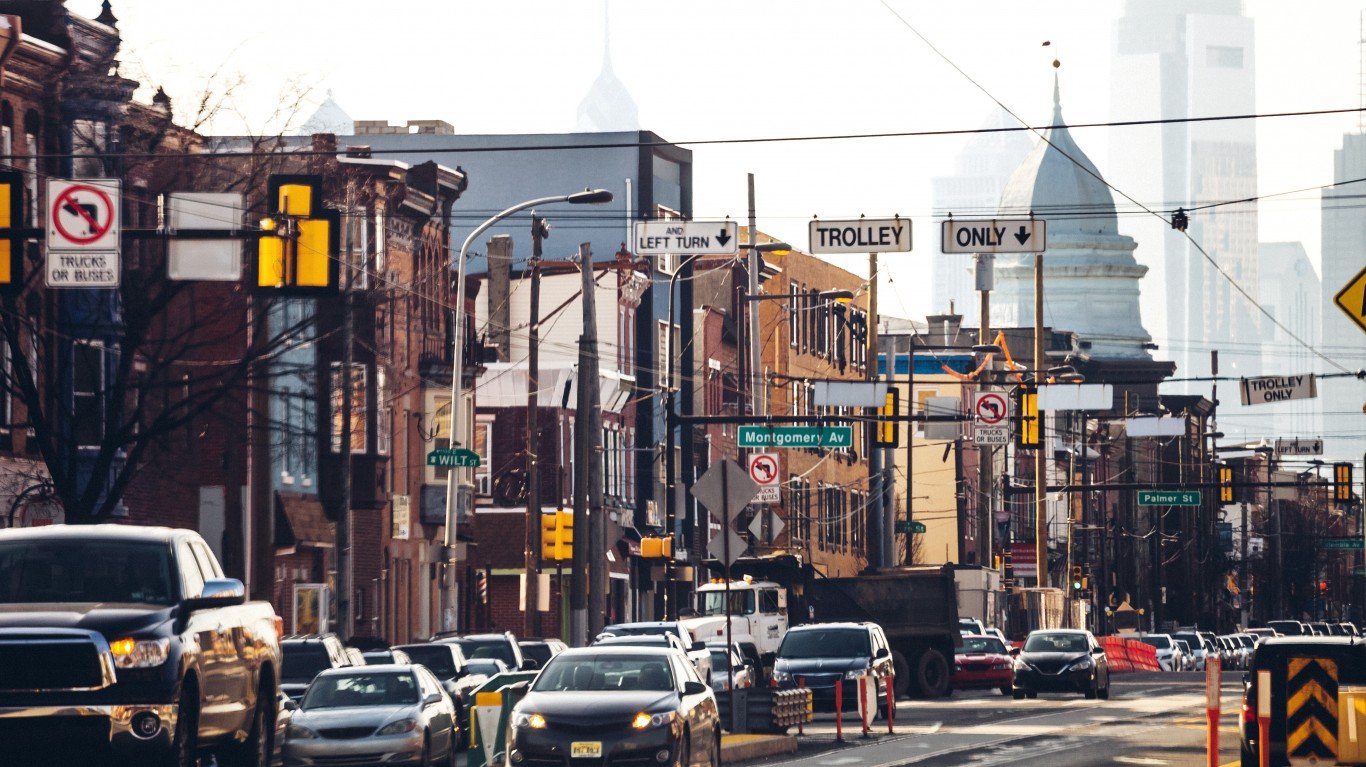
Pennsylvania: Philadelphia-Camden-Wilmington
> Avg. time lost to traffic delays, 2020: 37 hours per commuter
> Incidents of auto theft, 2021: 247 per 100,000 people (139 per 100,000 in state)
> Fatal crash rate, 2020: 7.8 per 100,000 people (8.2 per 100,000 in state)
> Avg. commute time to work in 2021: 27.6 minutes (25.7 minutes in state)
> Metro areas considered in state: 17
Source: StuartDuncanSmith / iStock via Getty Images
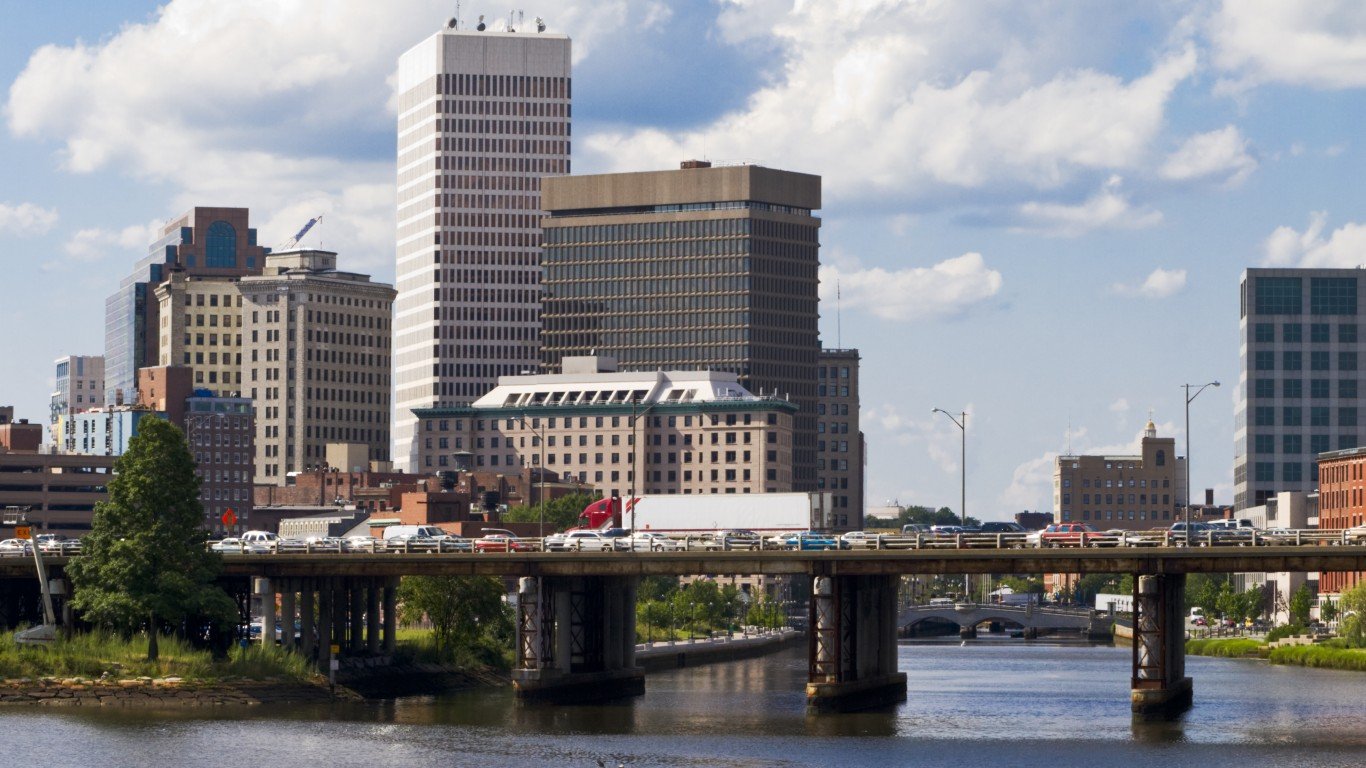
Rhode Island: Providence-Warwick*
> Avg. time lost to traffic delays, 2020: 33 hours per commuter
> Incidents of auto theft, 2021: 135 per 100,000 people (156 per 100,000 in state)
> Fatal crash rate, 2020: 6.6 per 100,000 people (6.0 per 100,000 in state)
> Avg. commute time to work in 2021: 25.6 minutes (24.8 minutes in state)
> Metro areas considered in state: 1
*Because Providence-Warwick is the only eligible metro area in Rhode Island, it ranks as the worst city to drive in by default.
[in-text-ad-2]
Source: ablokhin / iStock Editorial via Getty Images
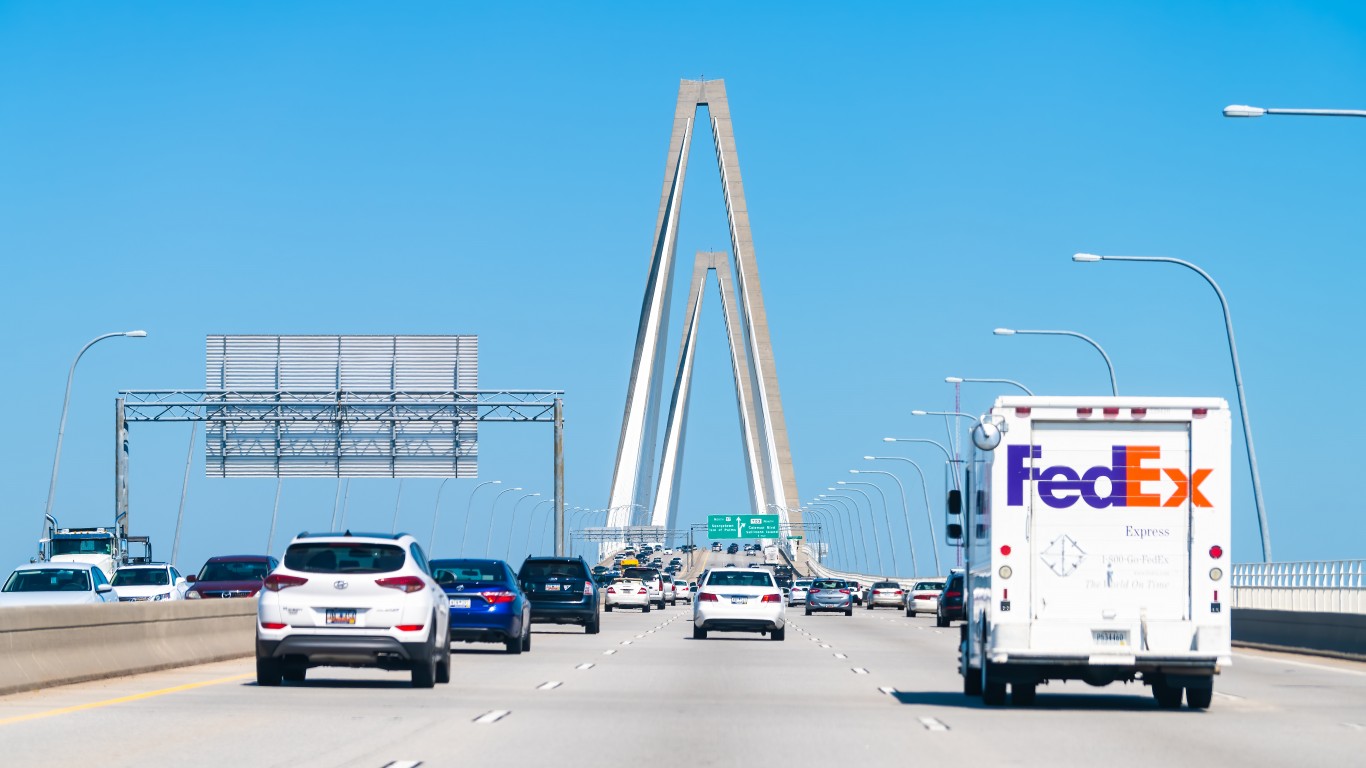
South Carolina: Charleston-North Charleston
> Avg. time lost to traffic delays, 2020: 26 hours per commuter
> Incidents of auto theft, 2021: 320 per 100,000 people (312 per 100,000 in state)
> Fatal crash rate, 2020: 17.0 per 100,000 people (18.5 per 100,000 in state)
> Avg. commute time to work in 2021: 26.5 minutes (25.6 minutes in state)
> Metro areas considered in state: 8
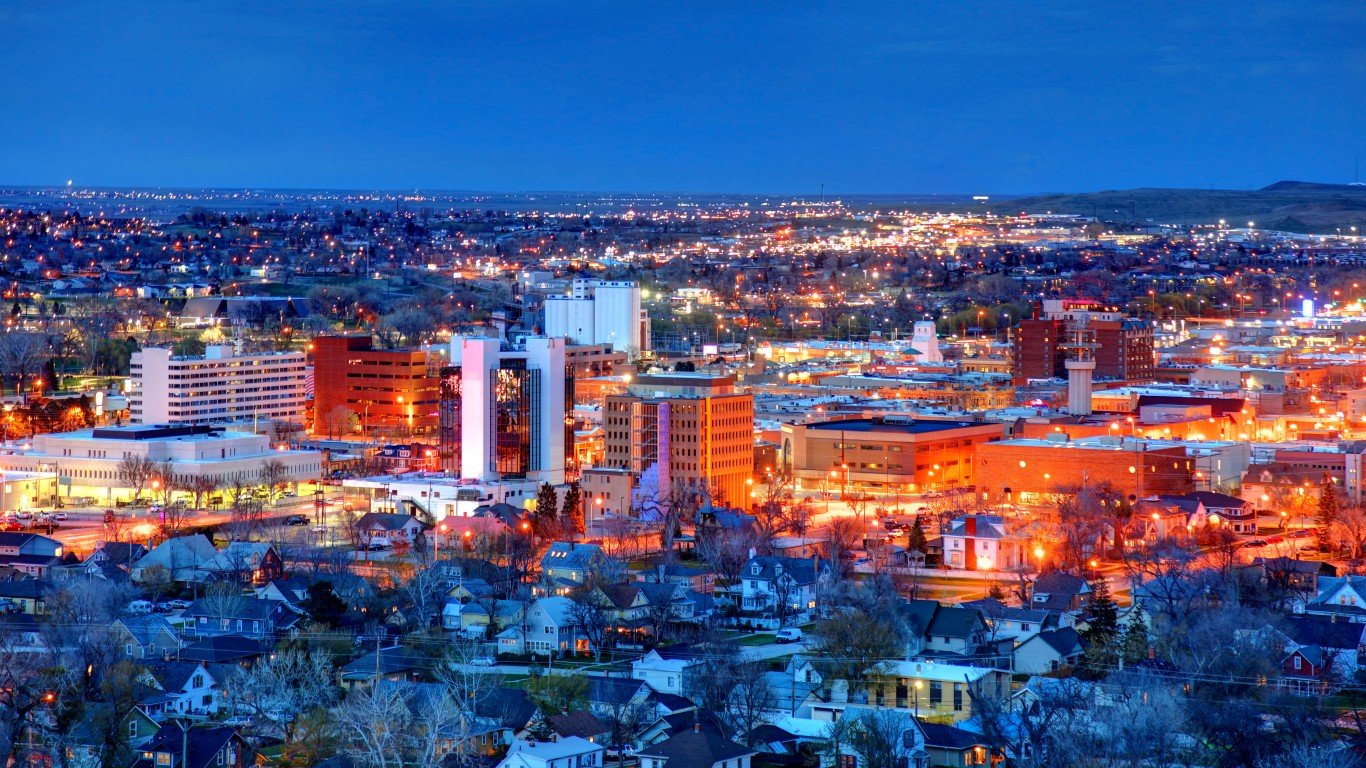
Source: DenisTangneyJr / E+ via Getty Images
South Dakota: Rapid City
> Avg. time lost to traffic delays, 2020: 12 hours per commuter
> Incidents of auto theft, 2021: 405 per 100,000 people (264 per 100,000 in state)
> Fatal crash rate, 2020: 13.5 per 100,000 people (14.7 per 100,000 in state)
> Avg. commute time to work in 2021: 17.7 minutes (17.4 minutes in state)
> Metro areas considered in state: 2
[in-text-ad]
Source: LawrenceSawyer / Getty Images
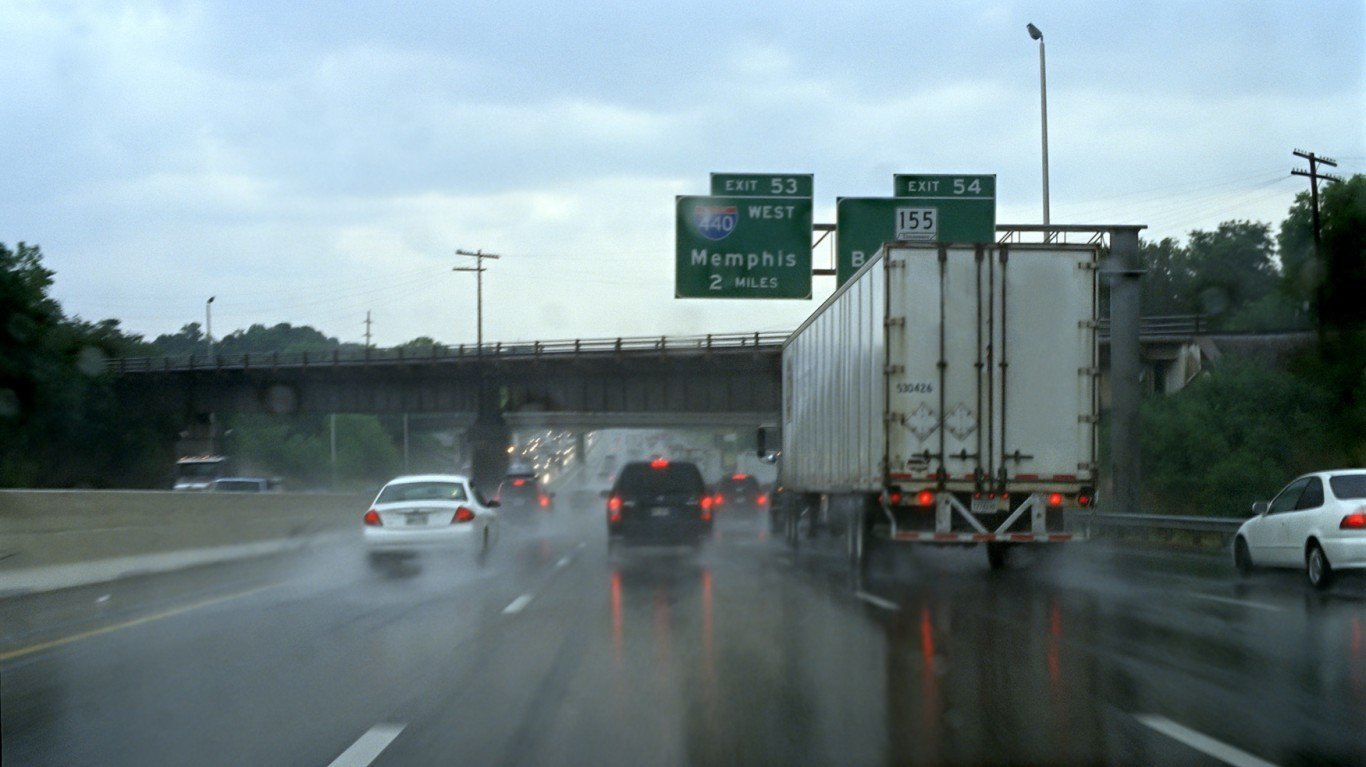
Tennessee: Memphis
> Avg. time lost to traffic delays, 2020: 28 hours per commuter
> Incidents of auto theft, 2021: 512 per 100,000 people (297 per 100,000 in state)
> Fatal crash rate, 2020: 22.9 per 100,000 people (16.0 per 100,000 in state)
> Avg. commute time to work in 2021: 23.8 minutes (25.2 minutes in state)
> Metro areas considered in state: 10
Source: DenisTangneyJr / iStock via Getty Images
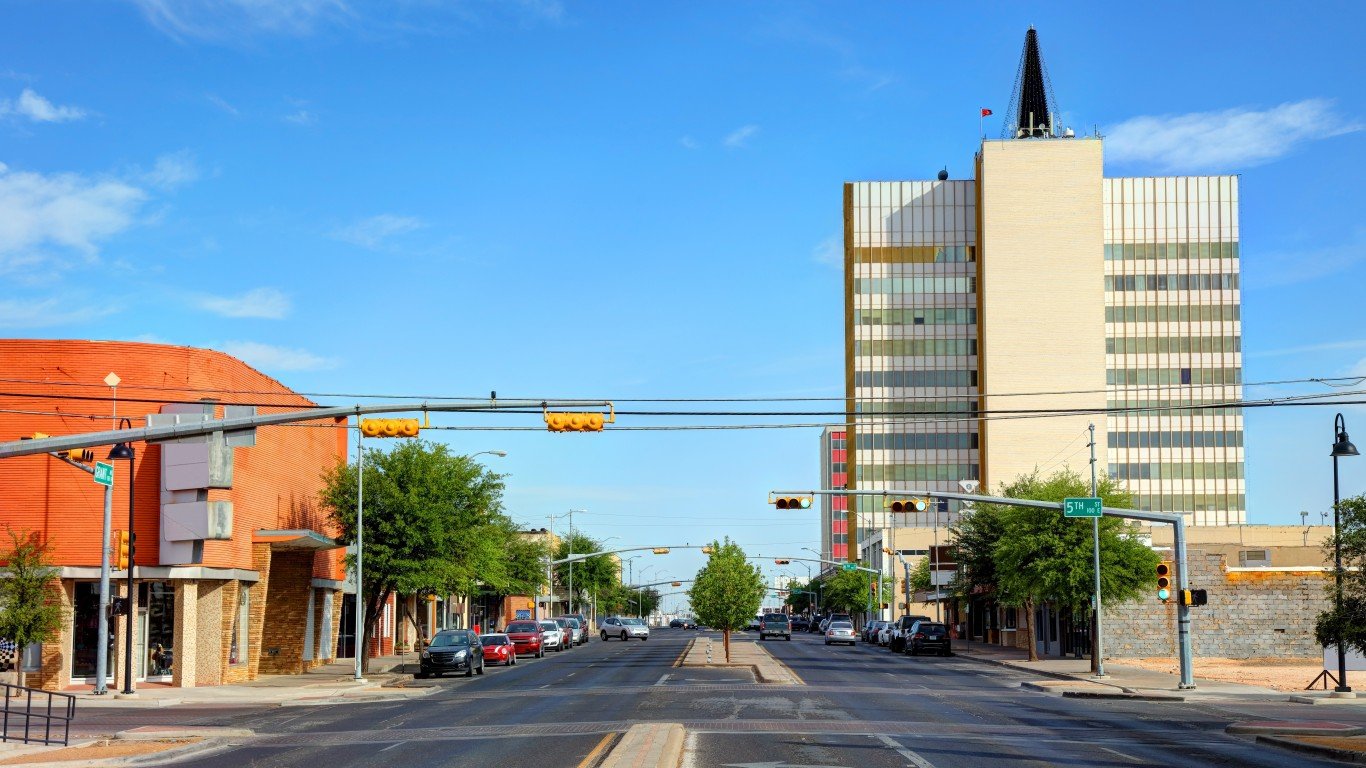
Texas: Odessa
> Avg. time lost to traffic delays, 2020: 30 hours per commuter
> Incidents of auto theft, 2021: 483 per 100,000 people (320 per 100,000 in state)
> Fatal crash rate, 2020: 31.7 per 100,000 people (11.9 per 100,000 in state)
> Avg. commute time to work in 2021: 24.9 minutes (25.9 minutes in state)
> Metro areas considered in state: 25
Source: grandriver / iStock via Getty Images
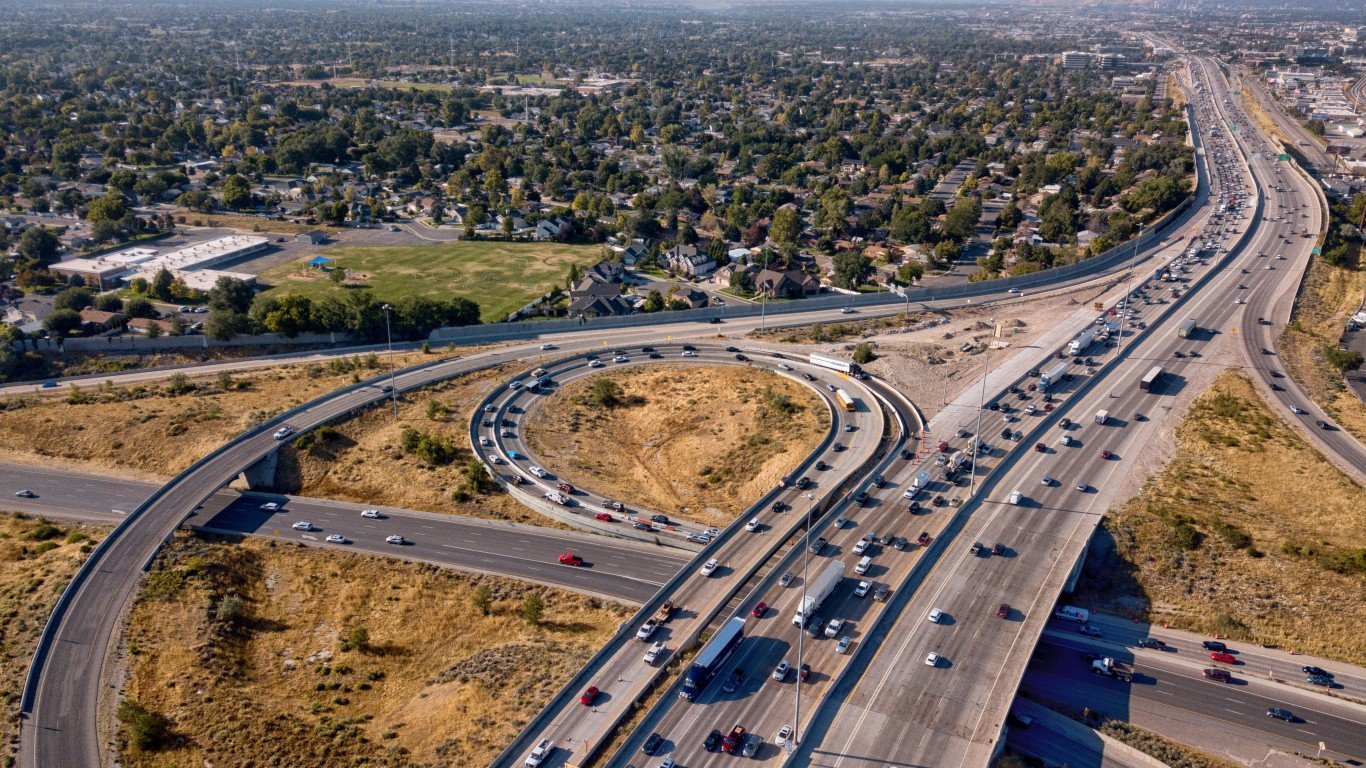
Utah: Salt Lake City
> Avg. time lost to traffic delays, 2020: 26 hours per commuter
> Incidents of auto theft, 2021: 469 per 100,000 people (256 per 100,000 in state)
> Fatal crash rate, 2020: 6.2 per 100,000 people (7.7 per 100,000 in state)
> Avg. commute time to work in 2021: 21.7 minutes (21.4 minutes in state)
> Metro areas considered in state: 5
[in-text-ad-2]
Source: halbergman / iStock via Getty Images
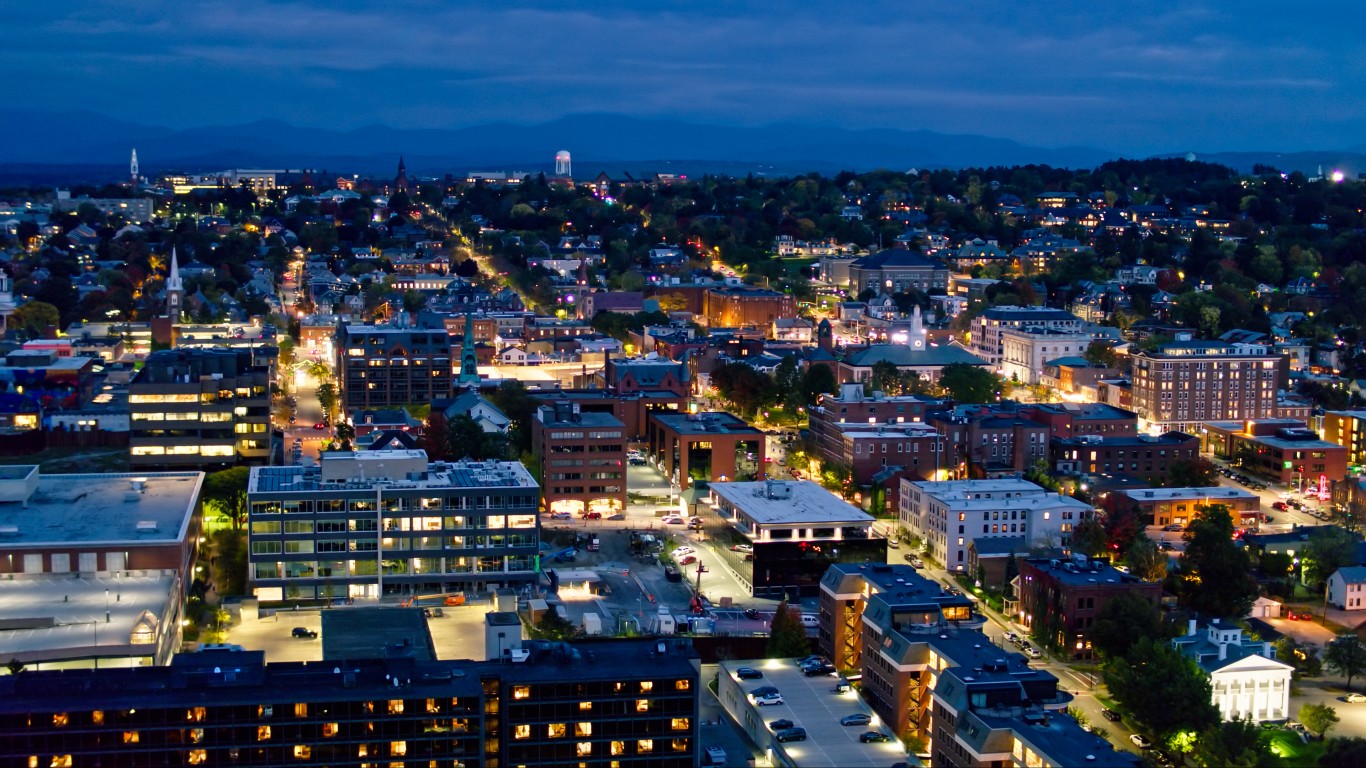
Vermont: Burlington-South Burlington*
> Avg. time lost to traffic delays, 2020: 19 hours per commuter
> Incidents of auto theft, 2021: 131 per 100,000 people (96 per 100,000 in state)
> Fatal crash rate, 2020: 6.6 per 100,000 people (9.0 per 100,000 in state)
> Avg. commute time to work in 2021: 23.1 minutes (23.0 minutes in state)
> Metro areas considered in state: 1
*Because Burlington-South Burlington is the only eligible metro area in Vermont, it ranks as the worst city to drive in by default.
Source: NicolasMcComber / iStock via Getty Images
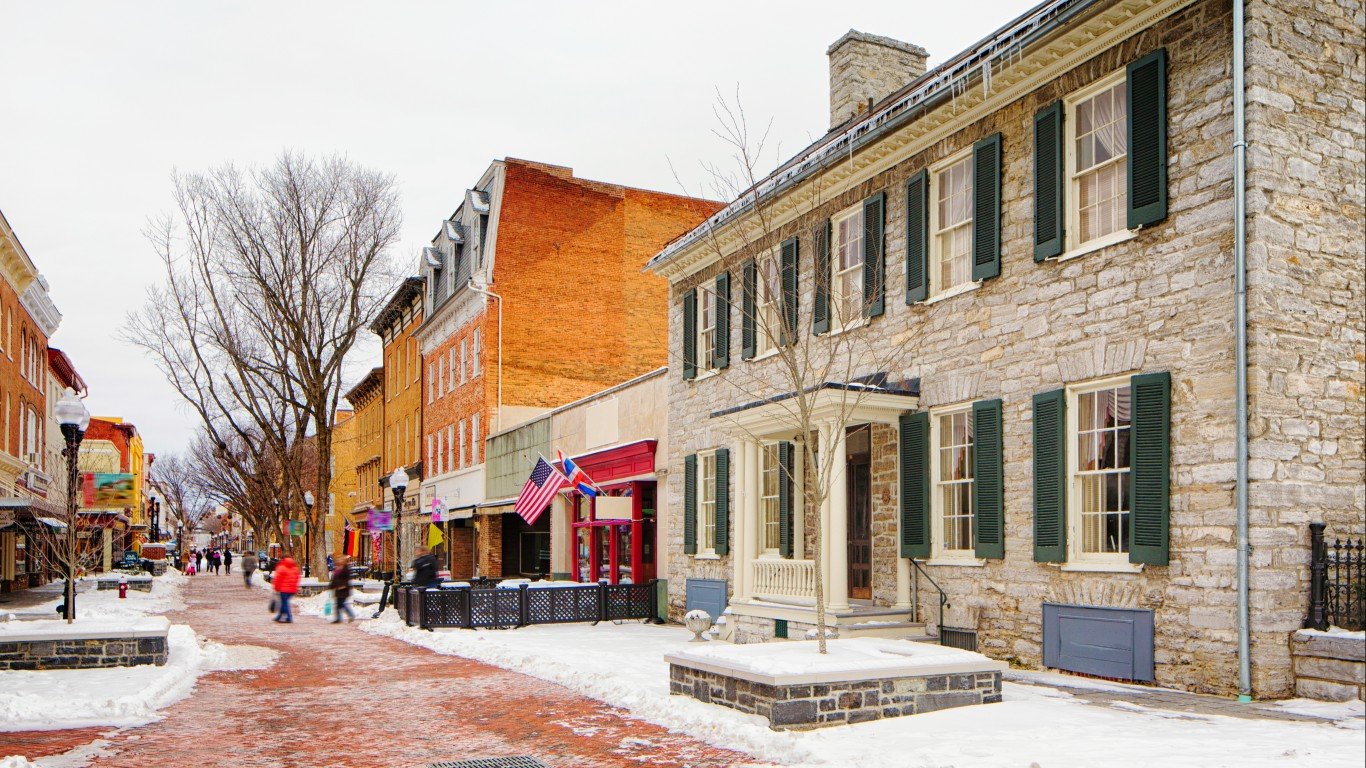
Virginia: Winchester
> Avg. time lost to traffic delays, 2020: 22 hours per commuter
> Incidents of auto theft, 2021: 75 per 100,000 people (143 per 100,000 in state)
> Fatal crash rate, 2020: 16.8 per 100,000 people (9.2 per 100,000 in state)
> Avg. commute time to work in 2021: 28.9 minutes (26.4 minutes in state)
> Metro areas considered in state: 9
[in-text-ad]
Source: peeterv / iStock via Getty Images
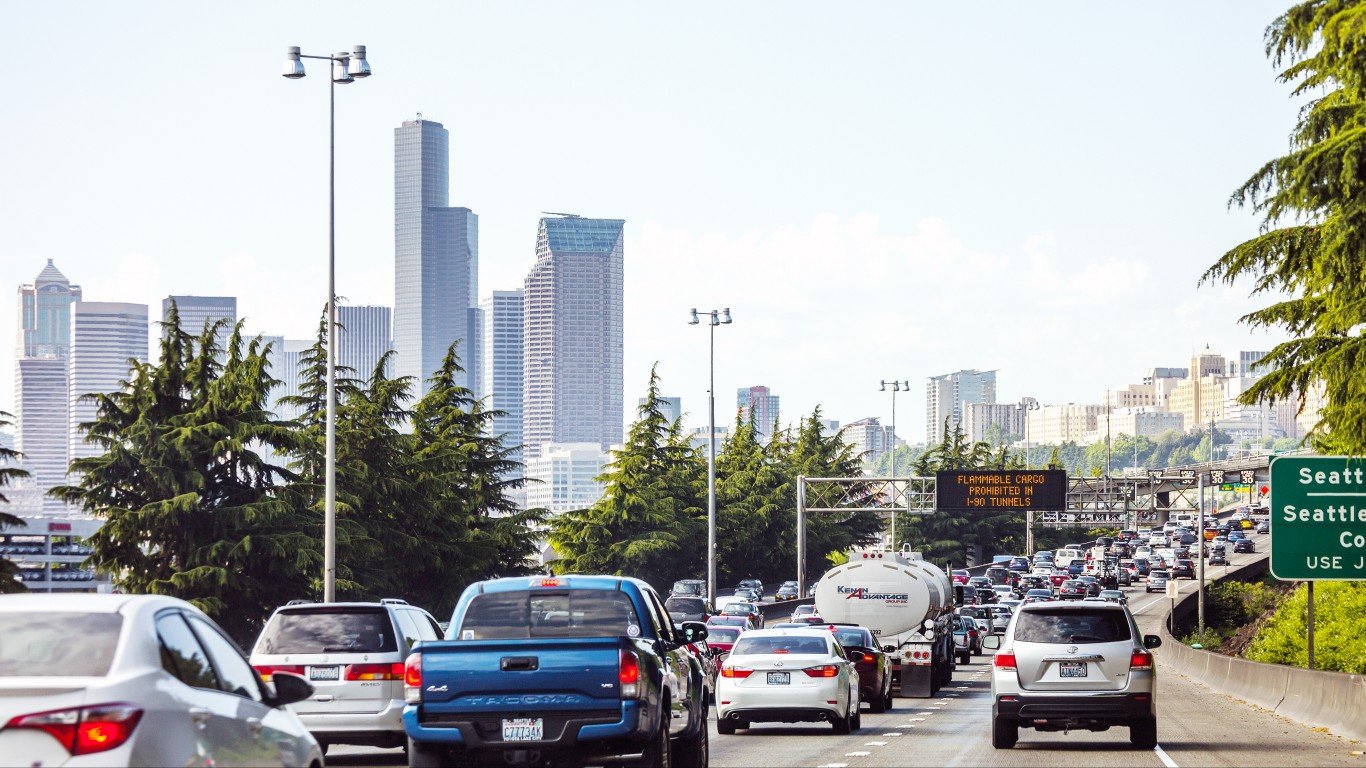
Washington: Seattle-Tacoma-Bellevue
> Avg. time lost to traffic delays, 2020: 31 hours per commuter
> Incidents of auto theft, 2021: 582 per 100,000 people (462 per 100,000 in state)
> Fatal crash rate, 2020: 5.3 per 100,000 people (6.8 per 100,000 in state)
> Avg. commute time to work in 2021: 28.5 minutes (26.0 minutes in state)
> Metro areas considered in state: 11
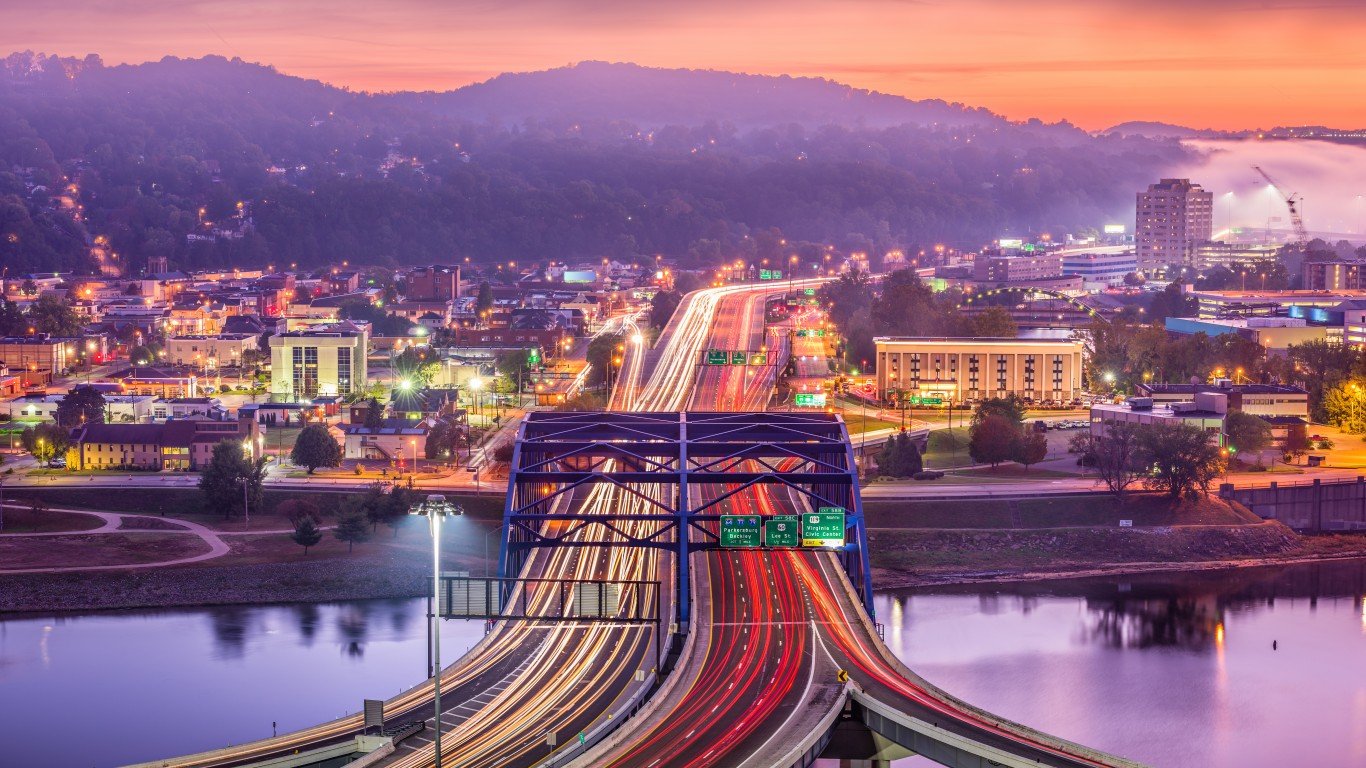
Source: Sean Pavone / iStock via Getty Images
West Virginia: Charleston
> Avg. time lost to traffic delays, 2020: 12 hours per commuter
> Incidents of auto theft, 2021: 234 per 100,000 people (129 per 100,000 in state)
> Fatal crash rate, 2020: 11.5 per 100,000 people (14.0 per 100,000 in state)
> Avg. commute time to work in 2021: 24.8 minutes (25.7 minutes in state)
> Metro areas considered in state: 7
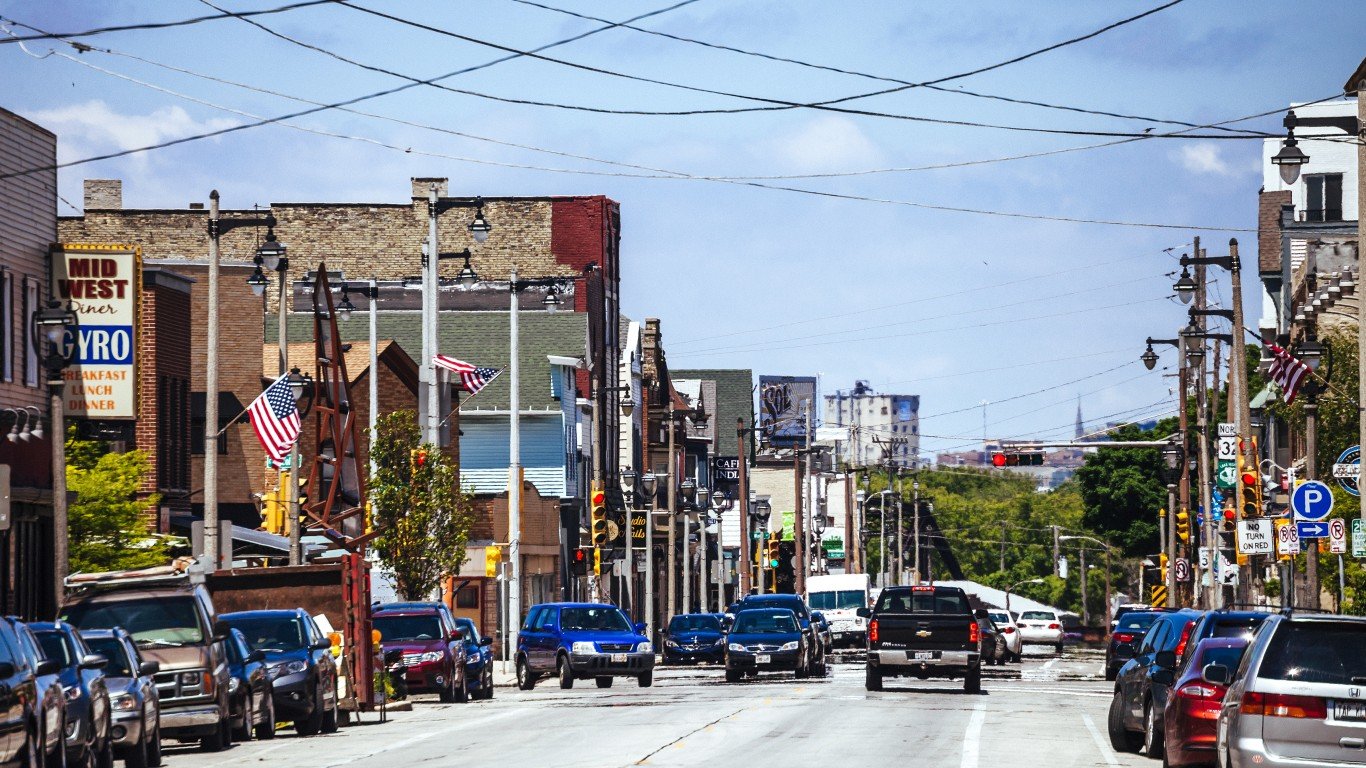
Source: peeterv / iStock via Getty Images
Wisconsin: Milwaukee-Waukesha
> Avg. time lost to traffic delays, 2020: 29 hours per commuter
> Incidents of auto theft, 2021: 598 per 100,000 people (237 per 100,000 in state)
> Fatal crash rate, 2020: 7.3 per 100,000 people (9.5 per 100,000 in state)
> Avg. commute time to work in 2021: 22.0 minutes (21.9 minutes in state)
> Metro areas considered in state: 12
[in-text-ad-2]
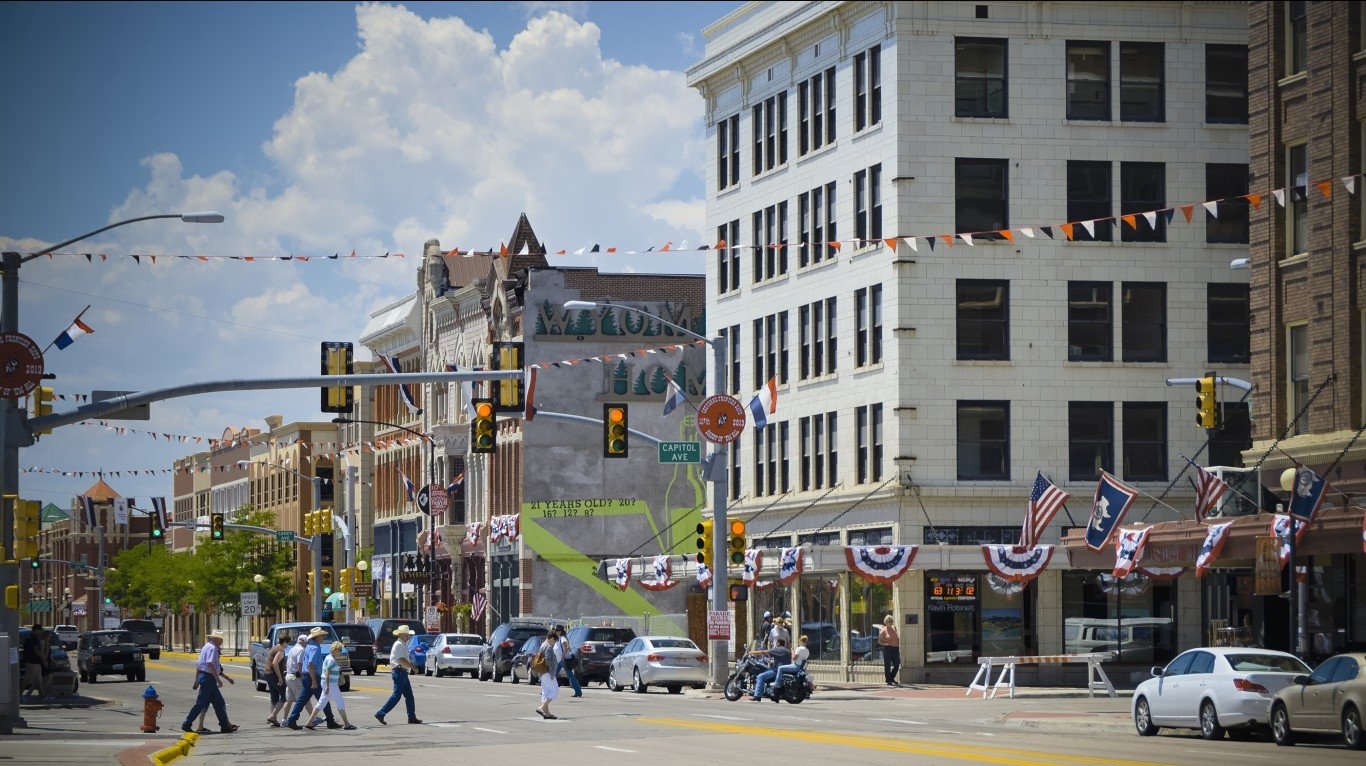
Source: RiverNorthPhotography / iStock Unreleased via Getty Images
Wyoming: Cheyenne
> Avg. time lost to traffic delays, 2020: 6 hours per commuter
> Incidents of auto theft, 2021: 407 per 100,000 people (162 per 100,000 in state)
> Fatal crash rate, 2020: 11.9 per 100,000 people (19.7 per 100,000 in state)
> Avg. commute time to work in 2021: 19.1 minutes (18.3 minutes in state)
> Metro areas considered in state: 2
Methodology
To determine the worst cities to drive in each state, 24/7 Wall St. created an index assessing the safety, traffic congestion, and convenience of driving in 378 metropolitan statistical areas.
Within each state, metro areas were ranked on four measures: deadly car accidents per 100,000 people in 2020, reported car thefts per 100,000 people in 2021, average hours lost to traffic congestion per commuter in 2020, and average commute time in 2021 among those not working from home.
It is important to note that four states – Delaware, New Hampshire, Rhode Island, and Vermont – have only one metropolitan area. As a result, the metro area listed in these states ranks as the worst by default only.
Data on the number of fatal car crashes in 2020 is from the National Highway Traffic Safety Administration’s Fatality and Injury Reporting System Tool. We adjusted the total number of fatal accidents per 100,000 people at both the state and metro area level using population data from the U.S. Census Bureau’s 2021 American Community Survey.
The number of reported car thefts per 100,000 people in 2021 is from the National Insurance Crime Bureau’s 2021 Hot Spots Vehicle Theft Report.
The number of hours lost to traffic congestion in 2020 per commuter is from the Texas A&M Transportation Institute’s 2021 Urban Mobility Report. The urban areas covered in the report may not be coterminous with the U.S. Census Bureau’s metropolitan area definitions, but there is always sufficient overlap.
Finally, data on average commute time for area residents 16 or over who do not work at home is from the U.S. Census Bureau’s 2021 ACS.
Sponsored: Attention Savvy Investors: Speak to 3 Financial Experts – FREE
Ever wanted an extra set of eyes on an investment you’re considering? Now you can speak with up to 3 financial experts in your area for FREE. By simply
clicking here you can begin to match with financial professionals who can help guide you through the financial decisions you’re making. And the best part? The first conversation with them is free.
Click here to match with up to 3 financial pros who would be excited to help you make financial decisions.
Thank you for reading! Have some feedback for us?
Contact the 24/7 Wall St. editorial team.
Editors' Picks