According to the Census Bureau, 27.6 million Americans worked primarily from home in 2021, up from just 9 million in 2019. Spending an entire day in one’s home can make it difficult for some workers to separate themselves from their job, one clear benefit is the elimination of a commute.
The average commuter in the United States spends about 27 minutes getting to work. For the typical, full-time worker, this adds up to about four hours and 30 minutes each week, and over 230 hours annually.
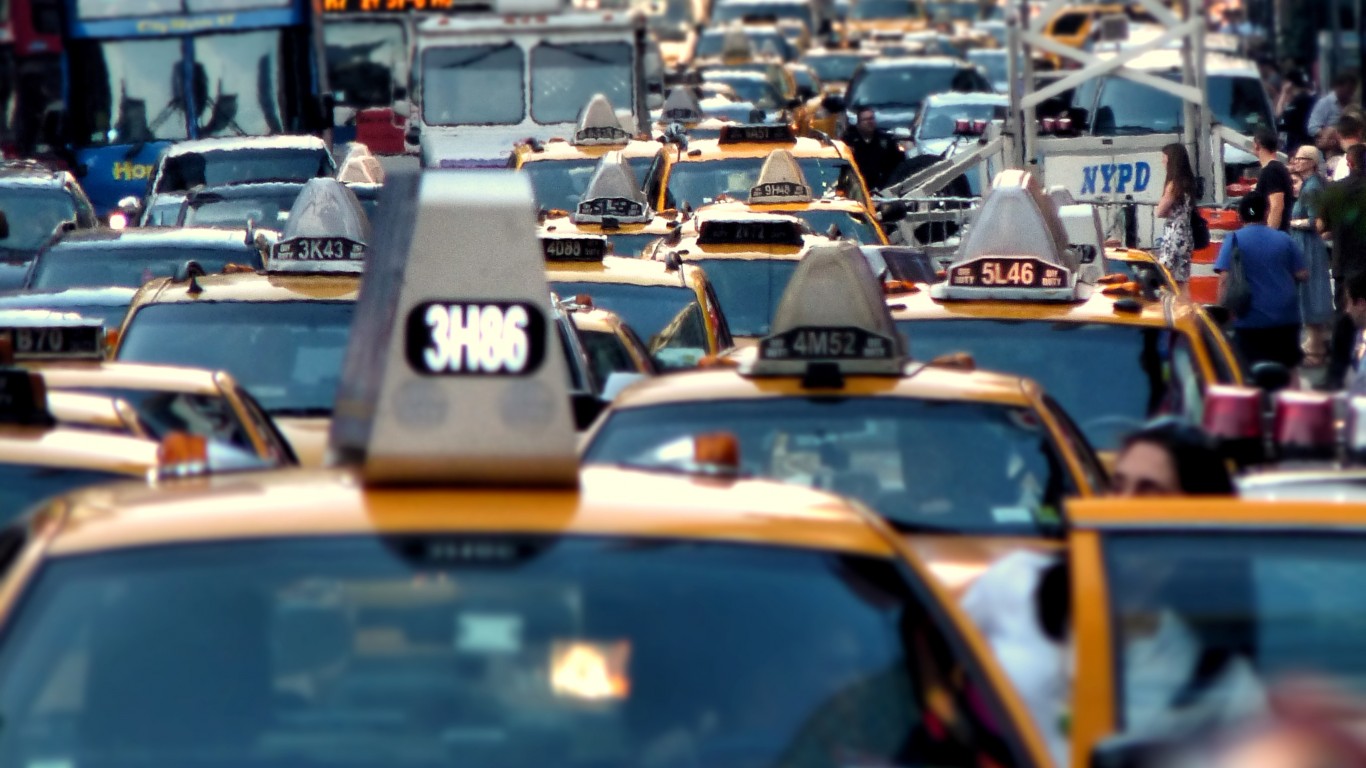
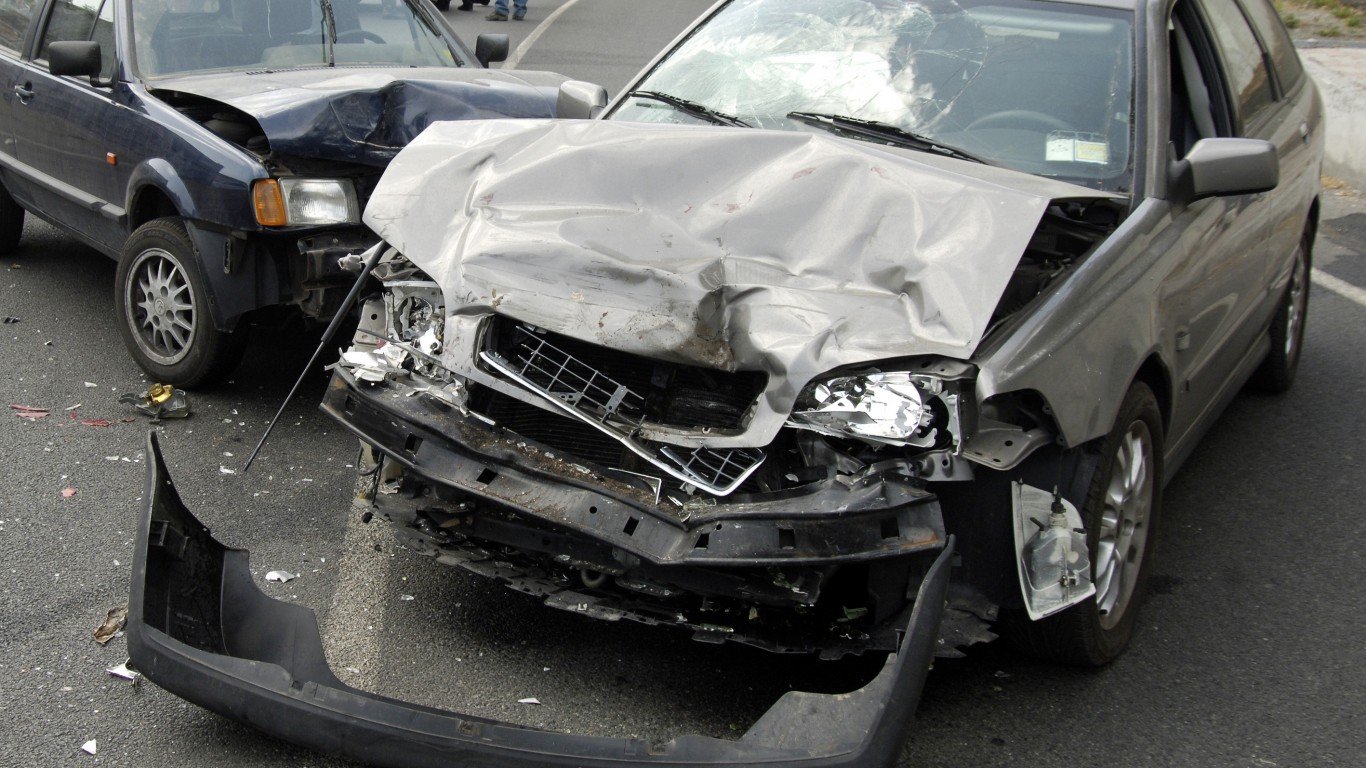
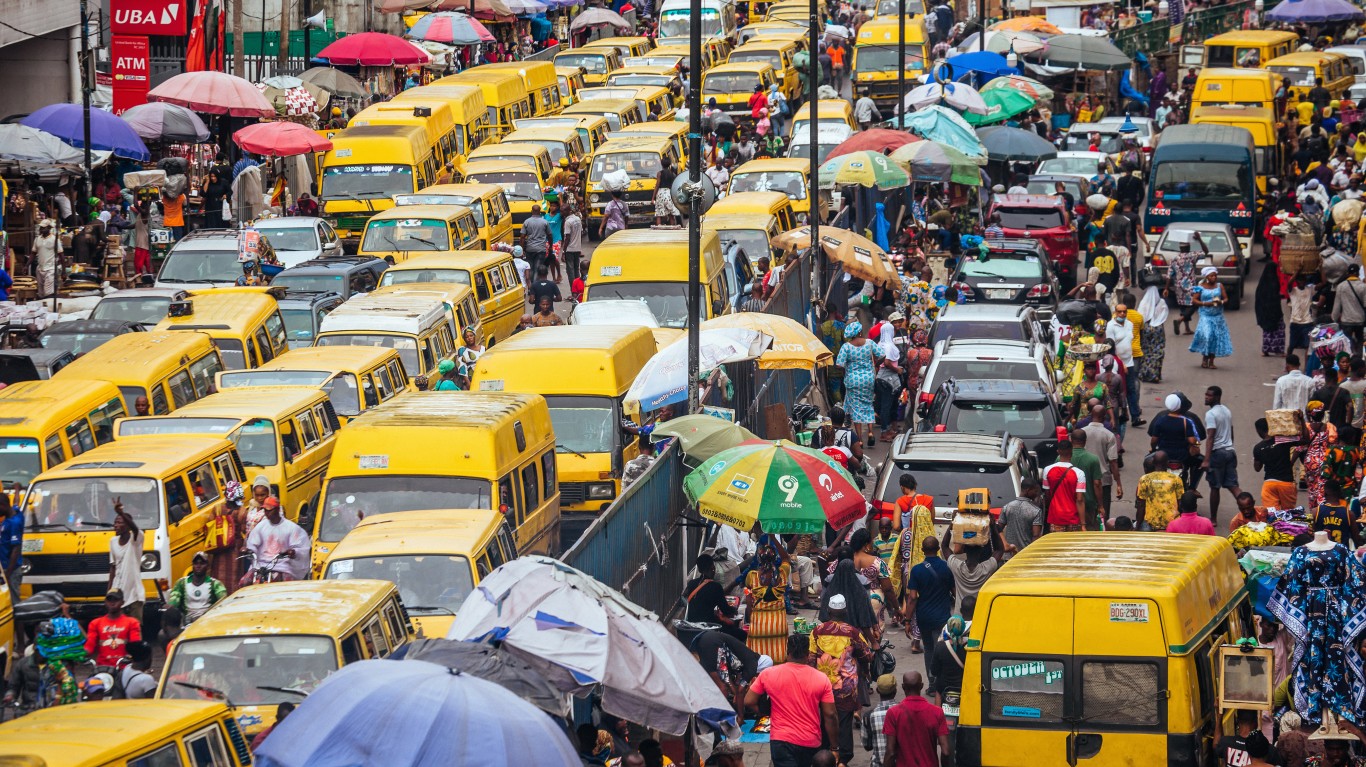
For some – particularly those who live and work in densely-populated urban areas – much of that time is spent sitting in traffic. Traffic delays are not only frustrating and time consuming, but they also lead to increased fuel consumption and travel expenses. And in nearly every state, there is at least one city where traffic congestion costs drivers hours each year. (Here is a look at the most fuel efficient SUVs on the market.)
Using traffic and analytics company INRIX’s traffic data and analytics company, 24/7 Wall St. identified the city in every state with the worst traffic. Cities are ranked on the average number of hours commuters lost due to traffic congestion in 2022. Due to a lack of available data, Alaska, South Dakota, Vermont, and Wyoming are not included in this analysis. Washington, D.C., is one of six states or districts that is home to only one city with available data. In these places, which are noted, the city listed ranks as having the worst traffic by default.
Among the cities on this list, the average annual time lost to traffic congestion ranges from only a few hours to well over 100 hours. Perhaps not surprisingly, the city with the worst traffic in many states is also the most populous and one that is already notorious for bad traffic. These places include Boston, Chicago, and New York.
However, there are also some surprises. While Los Angeles is the largest city in California, and one noted for its traffic, there is another city in the state where traffic is even worse.
In nearly every city on this list, the average number of hours commuters spend sitting in traffic increased in 2022 compared to the previous year. As pandemic restrictions eased, more and more workers returned to the office, increasing the volume of cars on the road, particularly during rush hour. Last year, traffic worsened by anywhere from 3% to 380% compared to 2021 in 44 of the 47 cities on this list. (Here is a look at the most congested cities in the world.)
Click here to see the city in every state with the worst traffic.
Click here to see our detailed methodology.
Source: toddmedia / iStock via Getty Images
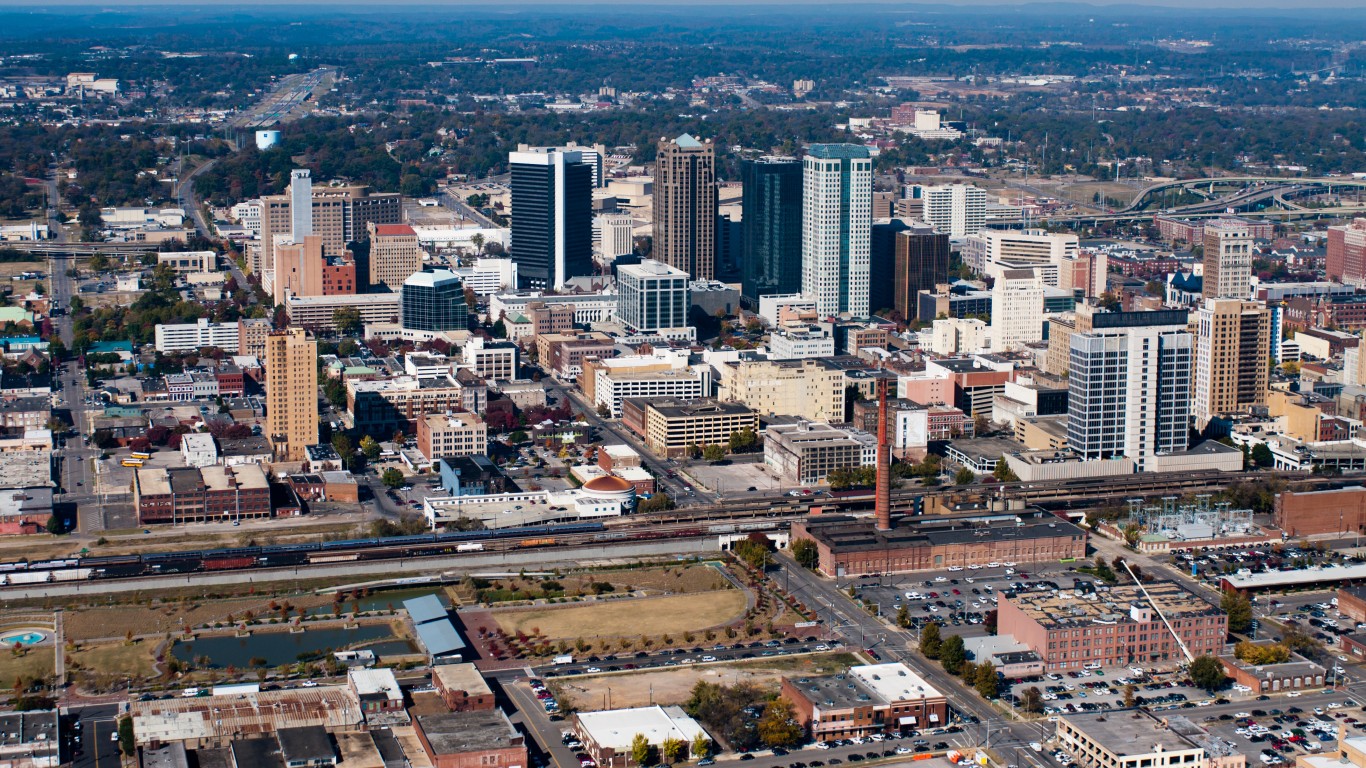
Alabama: Birmingham
> Avg. time lost to traffic delays in 2022: 24 hours per commuter
> Overall national ranking: tied – 46th worst of 280 U.S. cities considered
> Change in traffic delays from 2021: +33%
> Avg. commute time in city: 22 minutes (State avg.: 25 minutes)
> Commuters who drive or carpool to work: 76,153; 92.8% of commuters
> Cities considered in state: 7
[in-text-ad]
Source: photoquest7 / iStock via Getty Images
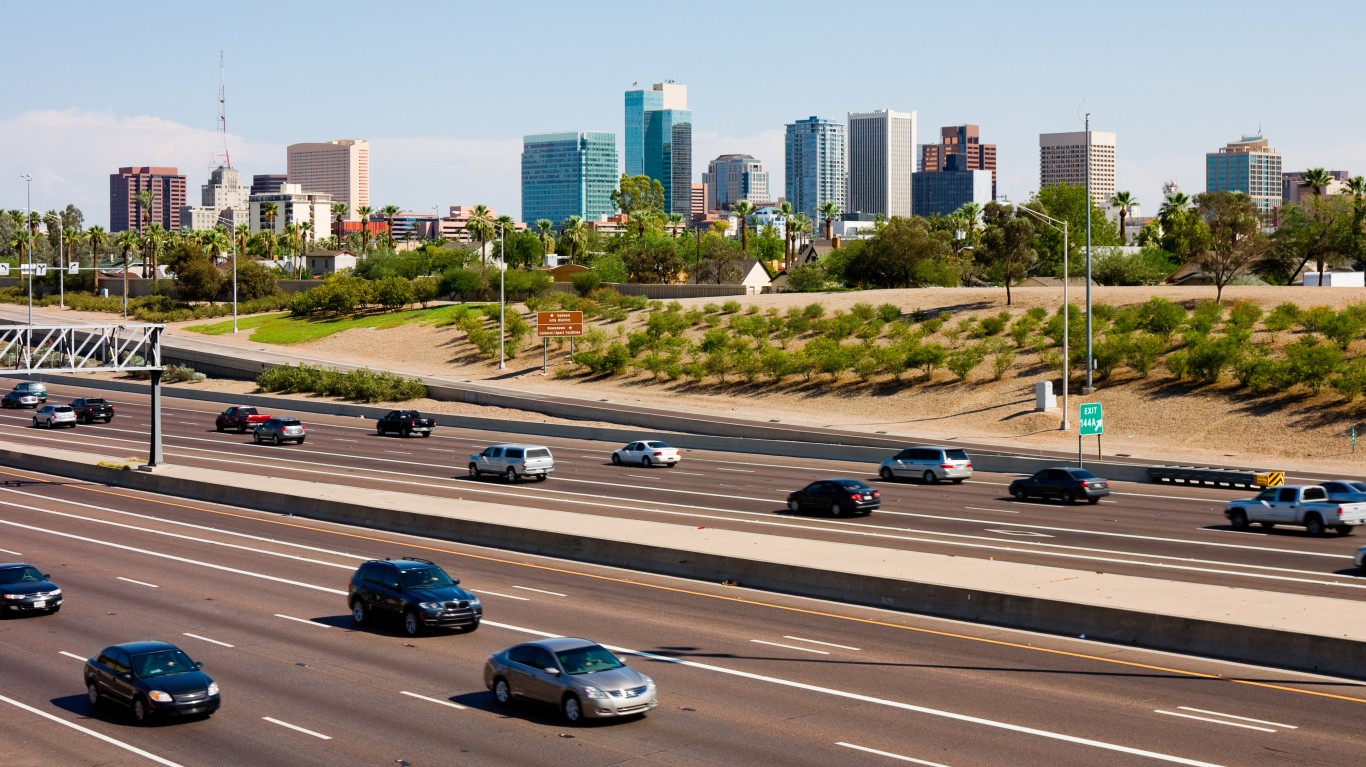
Arizona: Phoenix
> Avg. time lost to traffic delays in 2022: 26 hours per commuter
> Overall national ranking: tied – 39th worst of 280 U.S. cities considered
> Change in traffic delays from 2021: +26%
> Avg. commute time in city: 26 minutes (State avg.: 26 minutes)
> Commuters who drive or carpool to work: 644,366; 93.0% of commuters
> Cities considered in state: 3
Source: dlewis33 / iStock via Getty Images
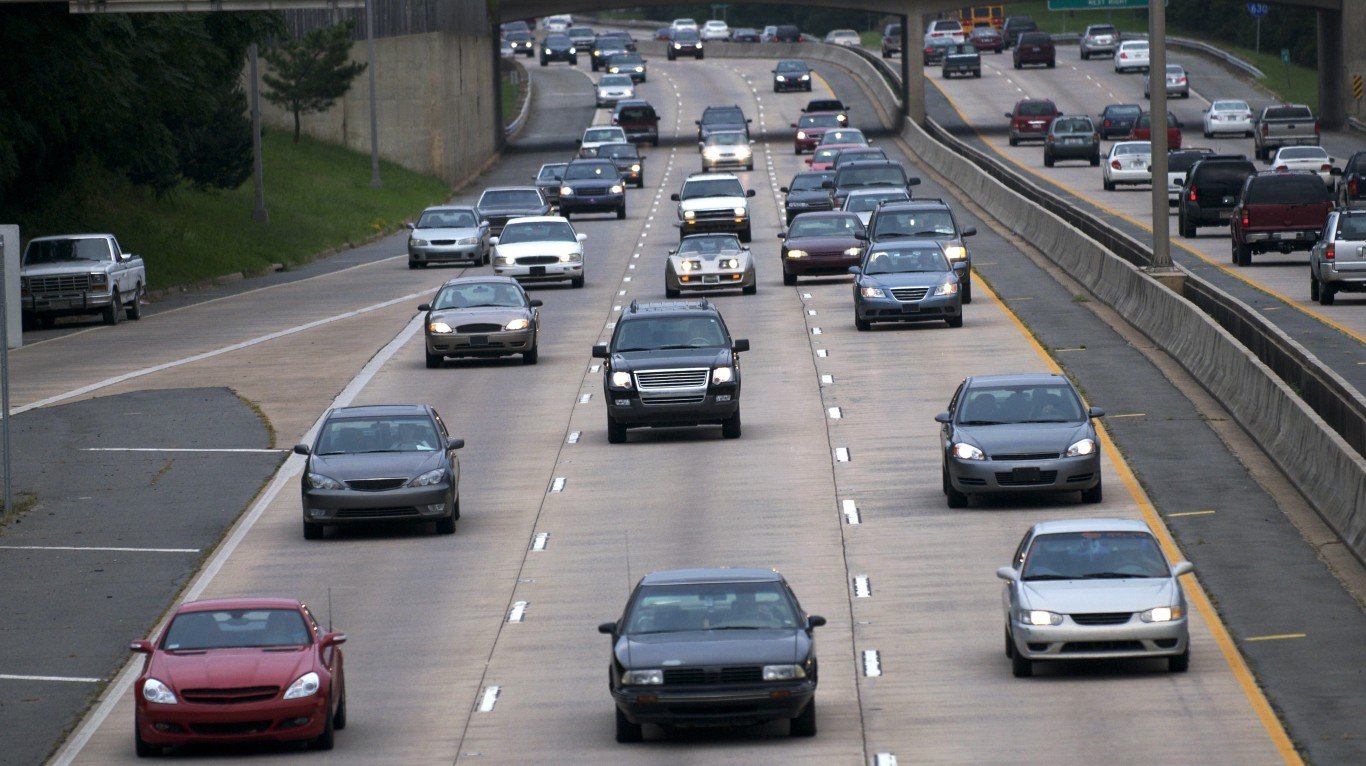
Arkansas: Little Rock
> Avg. time lost to traffic delays in 2022: 4 hours per commuter
> Overall national ranking: tied – 242nd worst of 280 U.S. cities considered
> Change in traffic delays from 2021: +20%
> Avg. commute time in city: 18 minutes (State avg.: 22 minutes)
> Commuters who drive or carpool to work: 86,748; 95.6% of commuters
> Cities considered in state: 2
Source: Sundry Photography / iStock Editorial via Getty Images
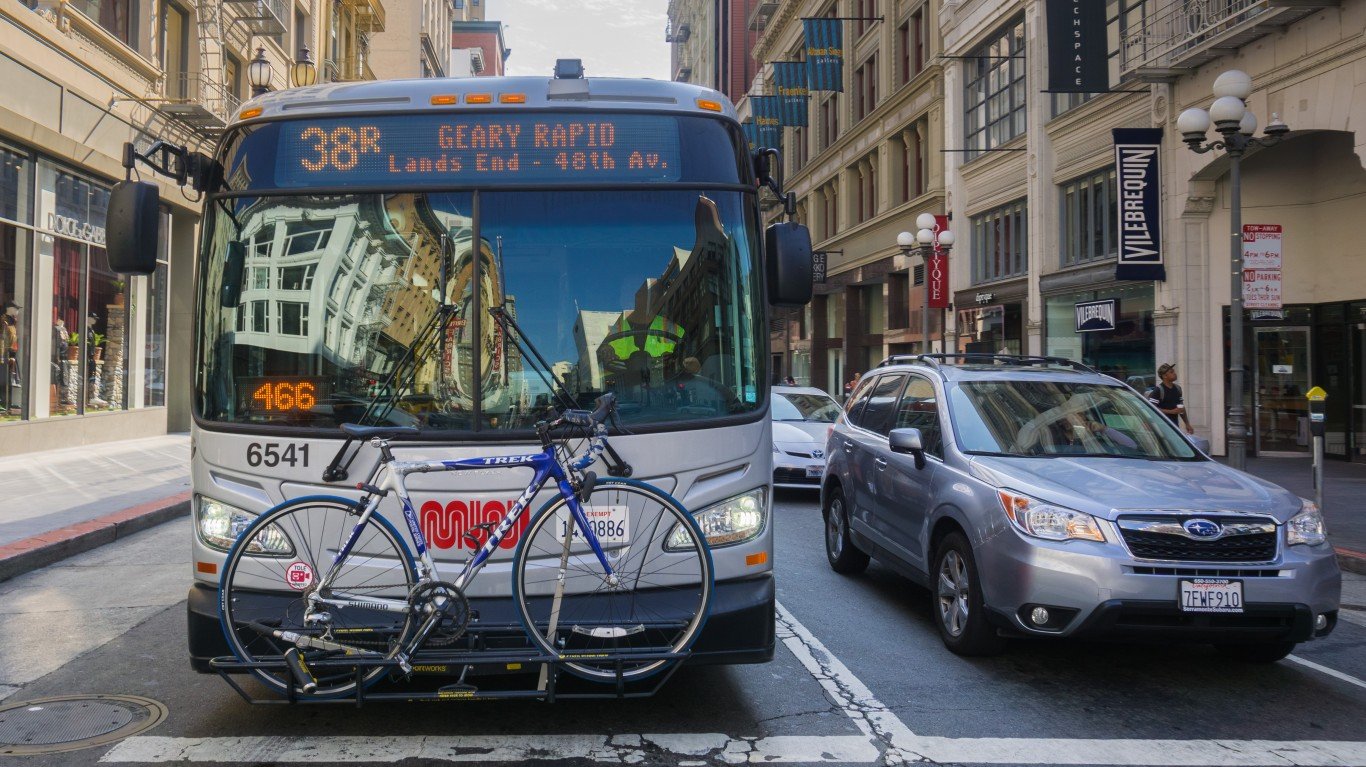
California: San Francisco
> Avg. time lost to traffic delays in 2022: 97 hours per commuter
> Overall national ranking: 6th worst of 280 U.S. cities considered
> Change in traffic delays from 2021: +52%
> Avg. commute time in city: 33 minutes (State avg.: 30 minutes)
> Commuters who drive or carpool to work: 179,667; 43.8% of commuters
> Cities considered in state: 30
[in-text-ad-2]
Source: RudyBalasko / iStock via Getty Images
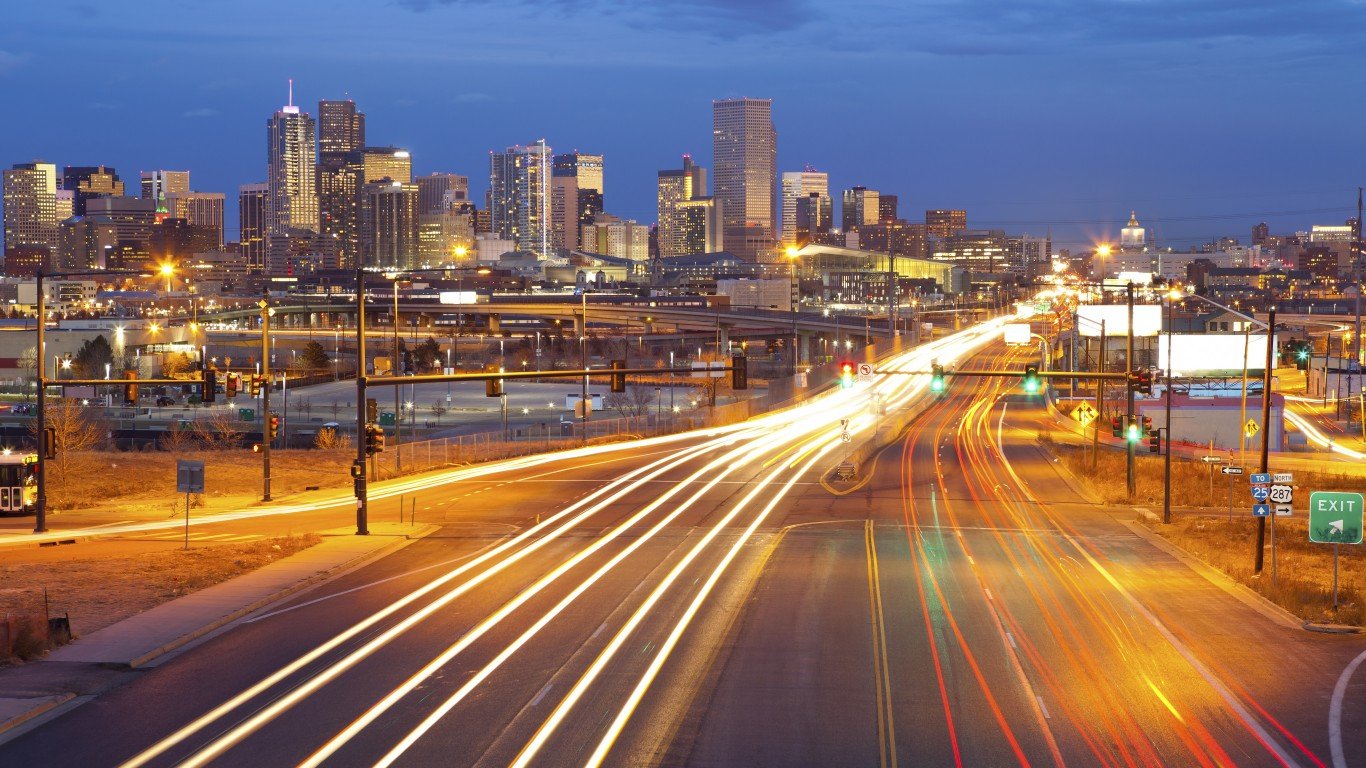
Colorado: Denver
> Avg. time lost to traffic delays in 2022: 54 hours per commuter
> Overall national ranking: tied – 16th worst of 280 U.S. cities considered
> Change in traffic delays from 2021: +35%
> Avg. commute time in city: 26 minutes (State avg.: 26 minutes)
> Commuters who drive or carpool to work: 280,340; 84.0% of commuters
> Cities considered in state: 5
Source: carminesalvatore / iStock Editorial via Getty Images
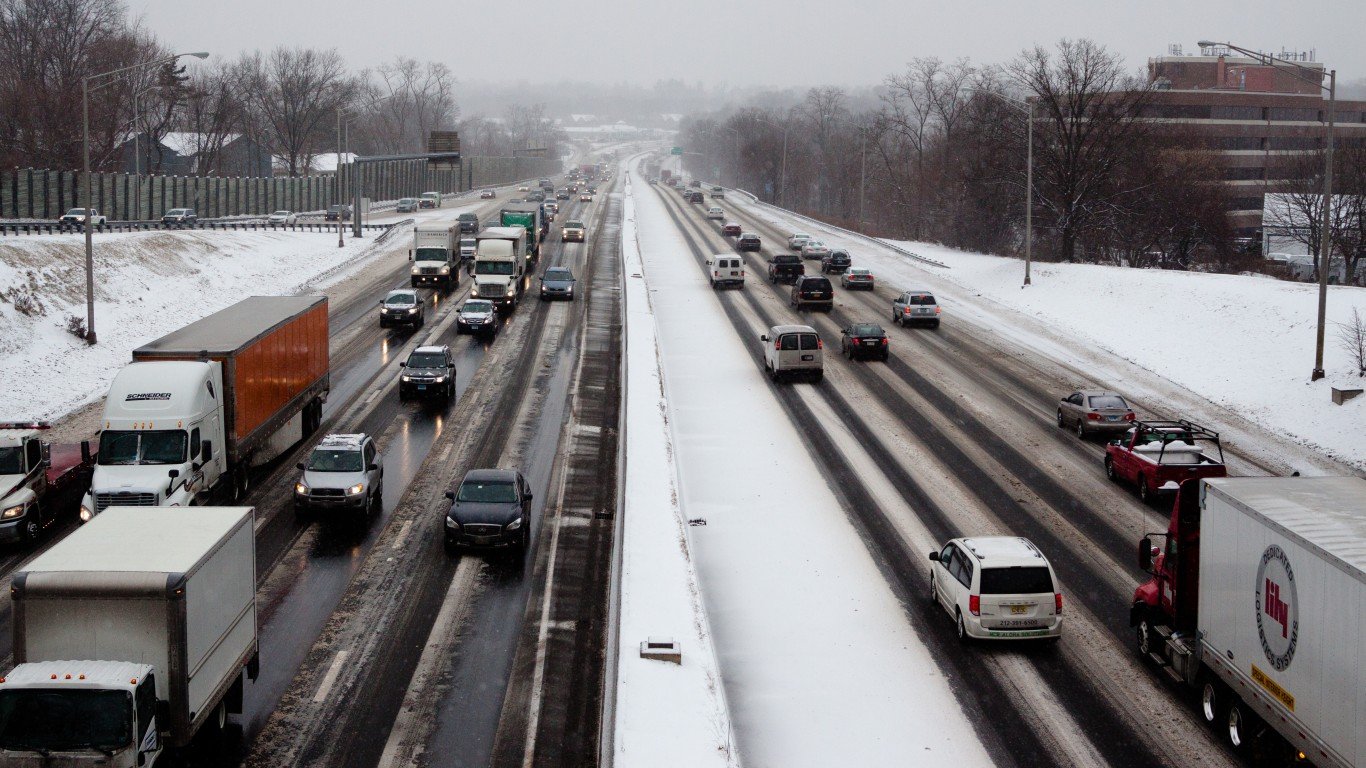
Connecticut: Stamford
> Avg. time lost to traffic delays in 2022: 73 hours per commuter
> Overall national ranking: 12th worst of 280 U.S. cities considered
> Change in traffic delays from 2021: +59%
> Avg. commute time in city: 28 minutes (State avg.: 27 minutes)
> Commuters who drive or carpool to work: 52,207; 80.0% of commuters
> Cities considered in state: 9
[in-text-ad]
Source: ChrisBoswell / iStock via Getty Images
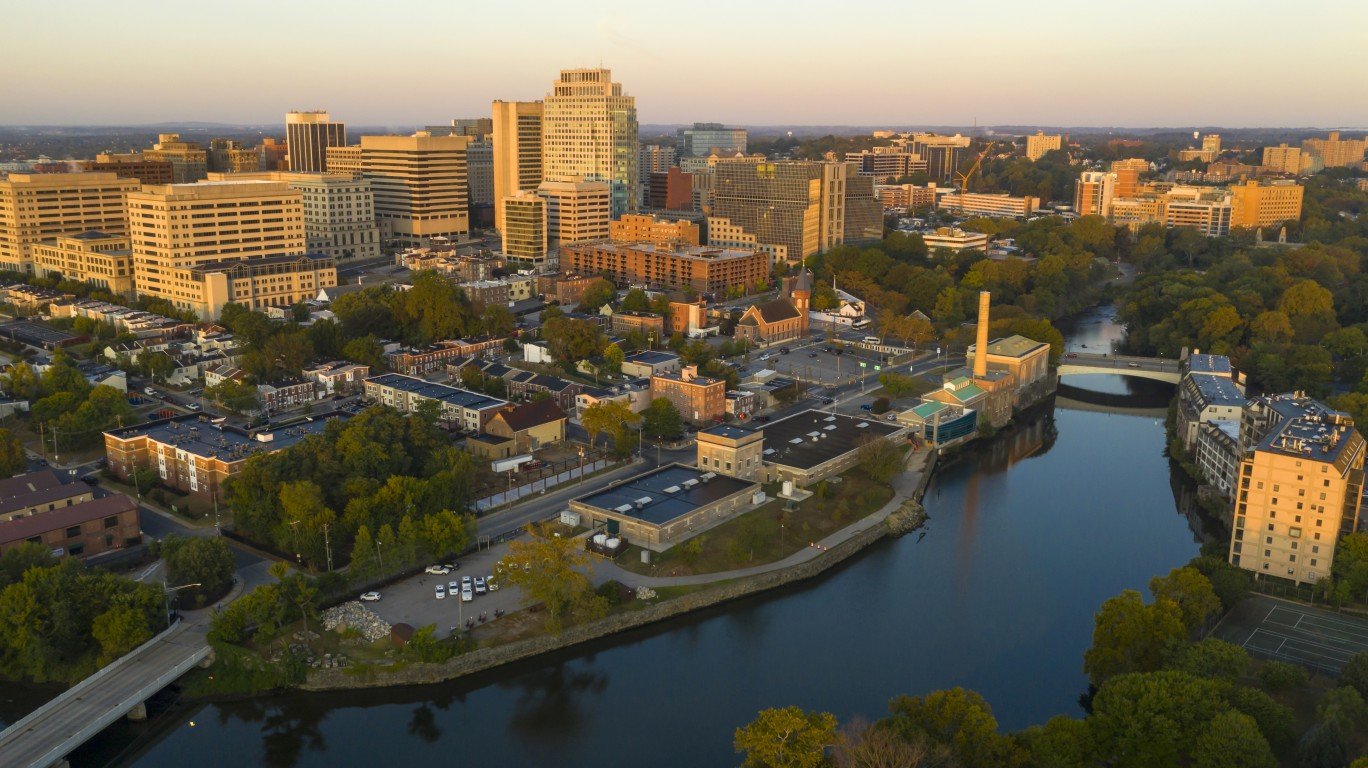
Delaware: Wilmington
> Avg. time lost to traffic delays in 2022: 19 hours per commuter
> Overall national ranking: tied – 79th worst of 280 U.S. cities considered
> Change in traffic delays from 2021: +13%
> Avg. commute time in city: 23 minutes (State avg.: 26 minutes)
> Commuters who drive or carpool to work: 23,321; 79.4% of commuters
> Cities considered in state: 3
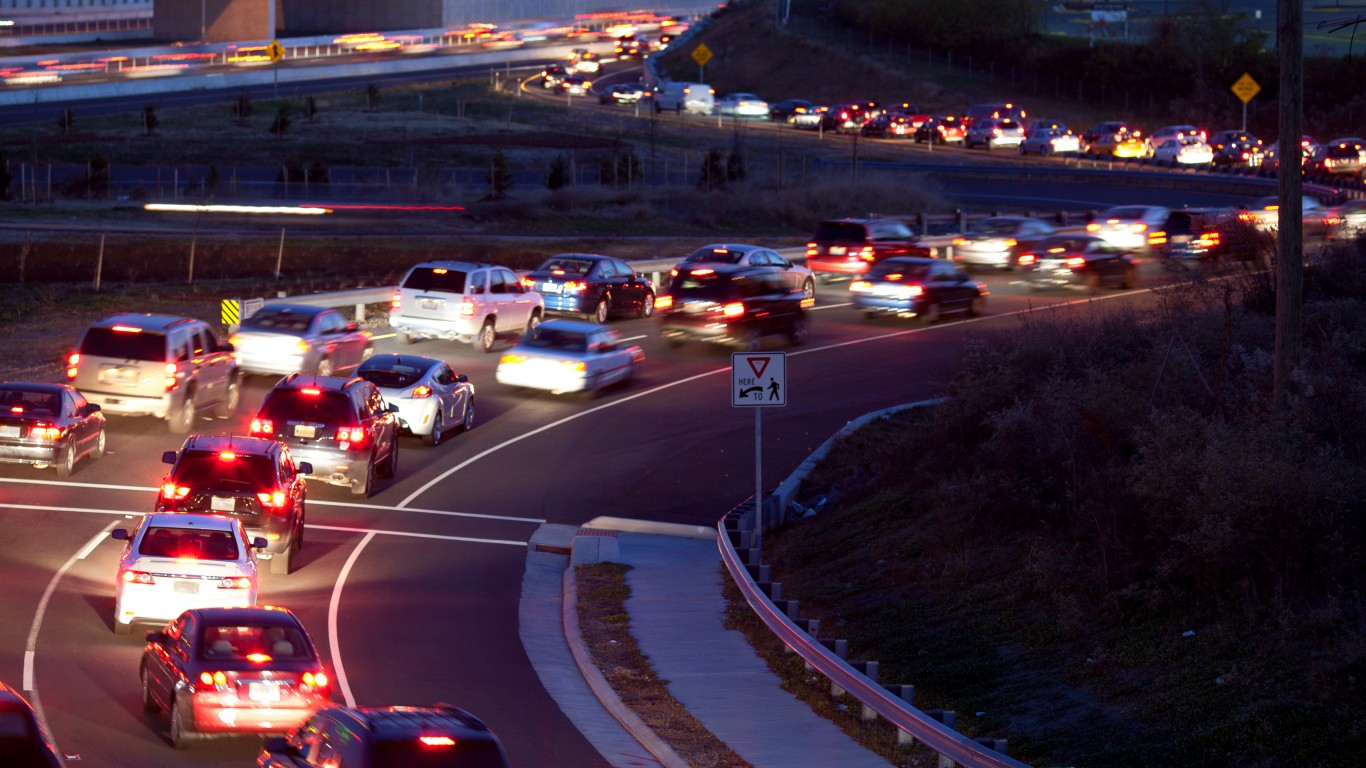
Source: burwellphotography / E+ via Getty Images
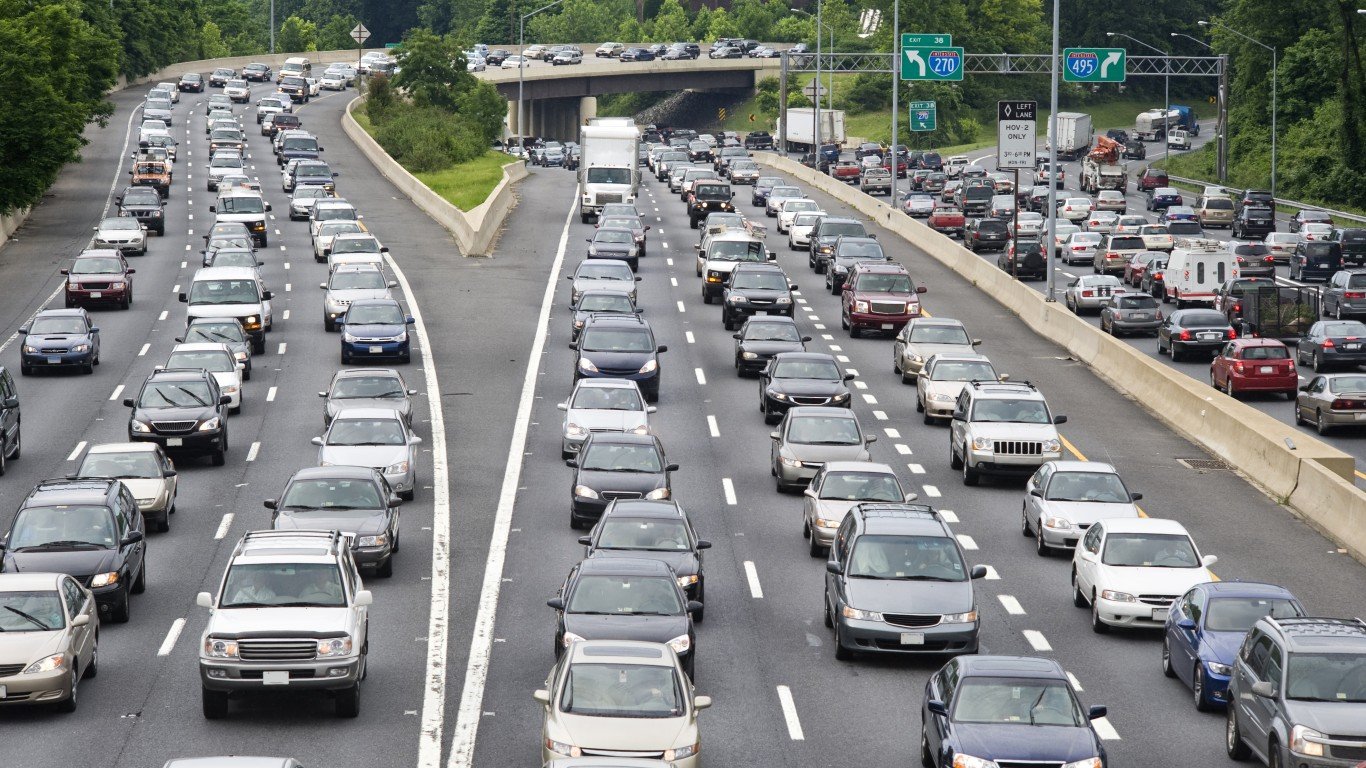
District of Columbia: Washington
> Avg. time lost to traffic delays in 2022: 83 hours per commuter
> Overall national ranking: 8th worst of 280 U.S. cities considered
> Change in traffic delays from 2021: +88%
> Avg. commute time in city: 30 minutes
> Commuters who drive or carpool to work: 131,329; 44.2% of commuters
> Cities considered in region: 1
Because Washington is the only city in the District of Columbia, it ranks as having the worst traffic by default.
Source: CHUYN / iStock via Getty Images
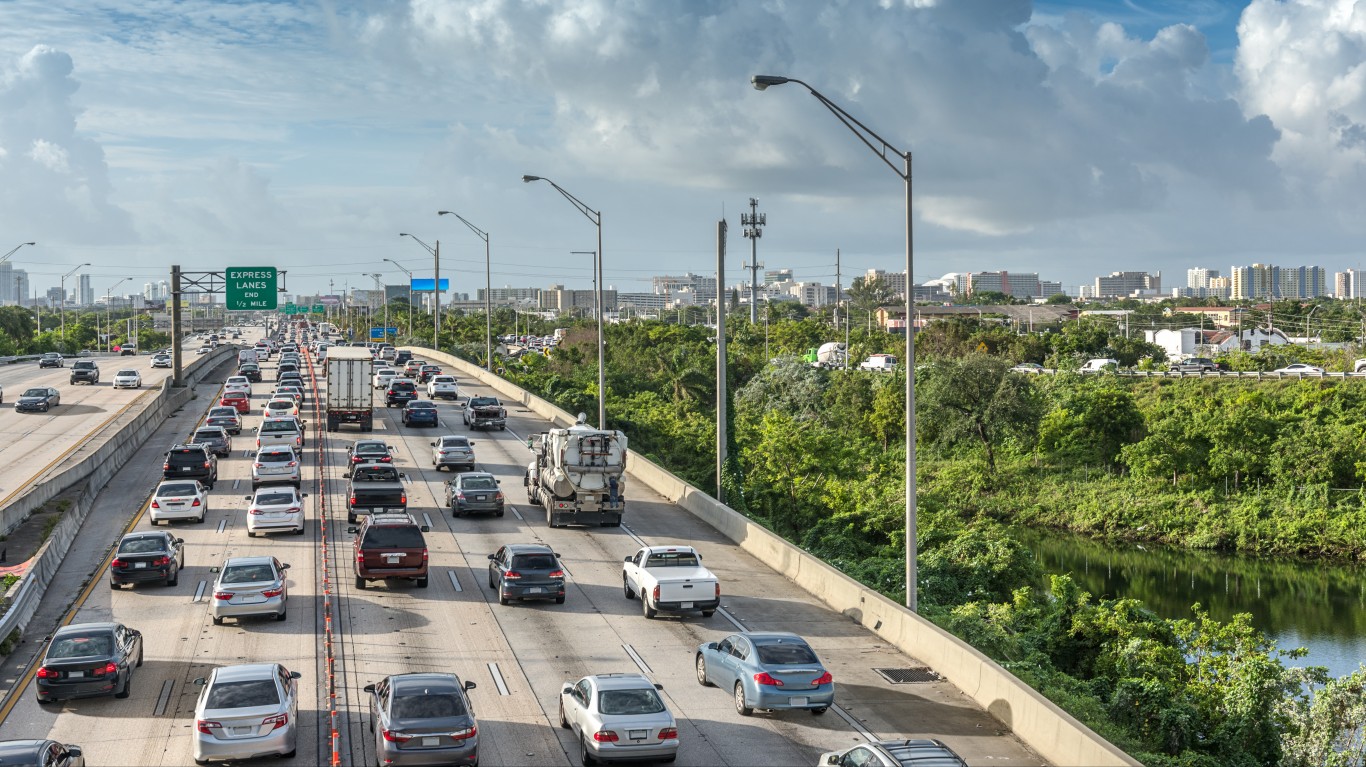
Florida: Miami
> Avg. time lost to traffic delays in 2022: 105 hours per commuter
> Overall national ranking: 5th worst of 280 U.S. cities considered
> Change in traffic delays from 2021: +59%
> Avg. commute time in city: 28 minutes (State avg.: 28 minutes)
> Commuters who drive or carpool to work: 165,042; 81.8% of commuters
> Cities considered in state: 22
[in-text-ad-2]
Source: stevecoleimages / iStock via Getty Images
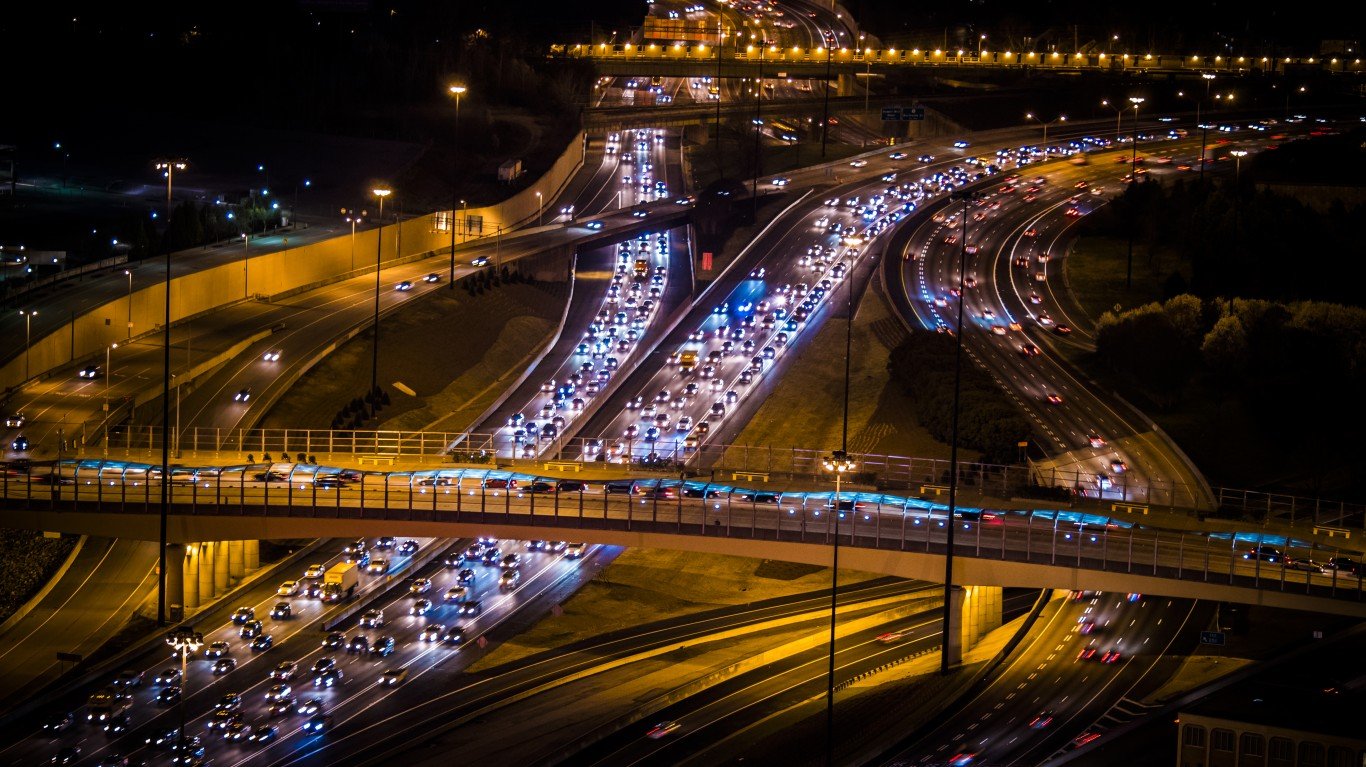
Georgia: Atlanta
> Avg. time lost to traffic delays in 2022: 74 hours per commuter
> Overall national ranking: tied – 10th worst of 280 U.S. cities considered
> Change in traffic delays from 2021: +40%
> Avg. commute time in city: 28 minutes (State avg.: 29 minutes)
> Commuters who drive or carpool to work: 163,636; 79.4% of commuters
> Cities considered in state: 8
Source: steinphoto / iStock via Getty Images
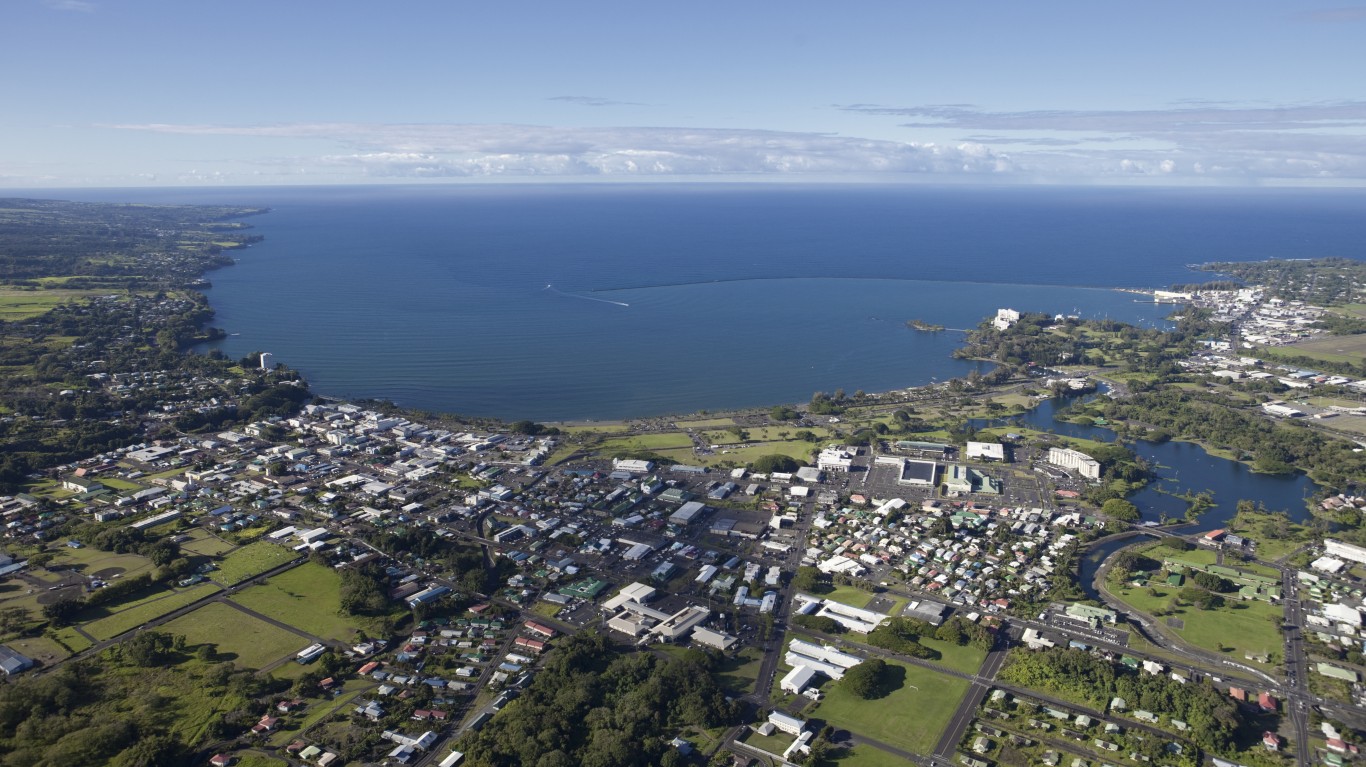
Hawaii: Hilo
> Avg. time lost to traffic delays in 2022: 29 hours per commuter
> Overall national ranking: tied – 33rd worst of 280 U.S. cities considered
> Change in traffic delays from 2021: +380%
> Avg. commute time in city: 19 minutes (State avg.: 27 minutes)
> Commuters who drive or carpool to work: 17,622; 94.6% of commuters
> Cities considered in state: 3
[in-text-ad]
Source: peeterv / iStock via Getty Images
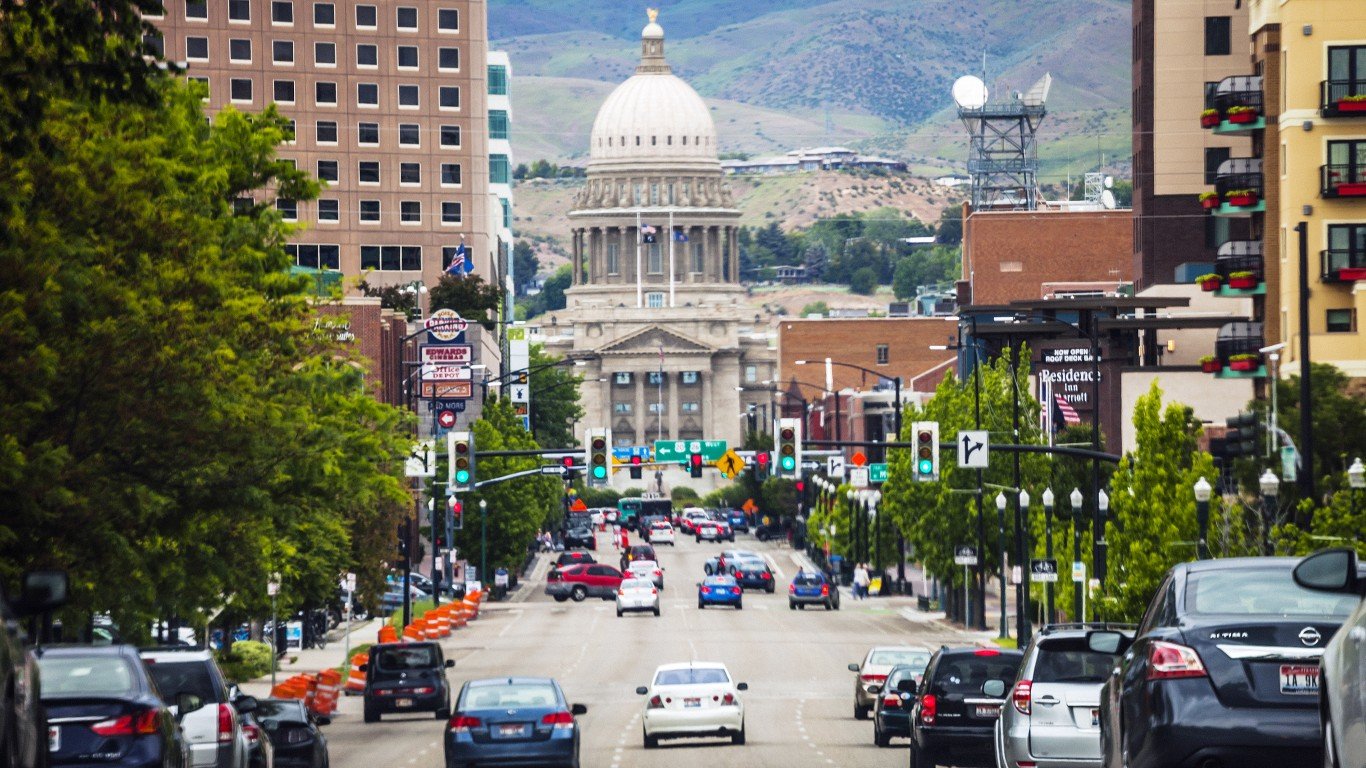
Idaho: Boise
> Avg. time lost to traffic delays in 2022: 7 hours per commuter
> Overall national ranking: tied – 205th worst of 280 U.S. cities considered
> Change in traffic delays from 2021: +3%
> Avg. commute time in city: 19 minutes (State avg.: 21 minutes)
> Commuters who drive or carpool to work: 100,272; 91.4% of commuters
> Cities considered in state: 1
Because Boise is the only city with available data in Idaho, it ranks as having the worst traffic by default.
 24/7 Wall St.
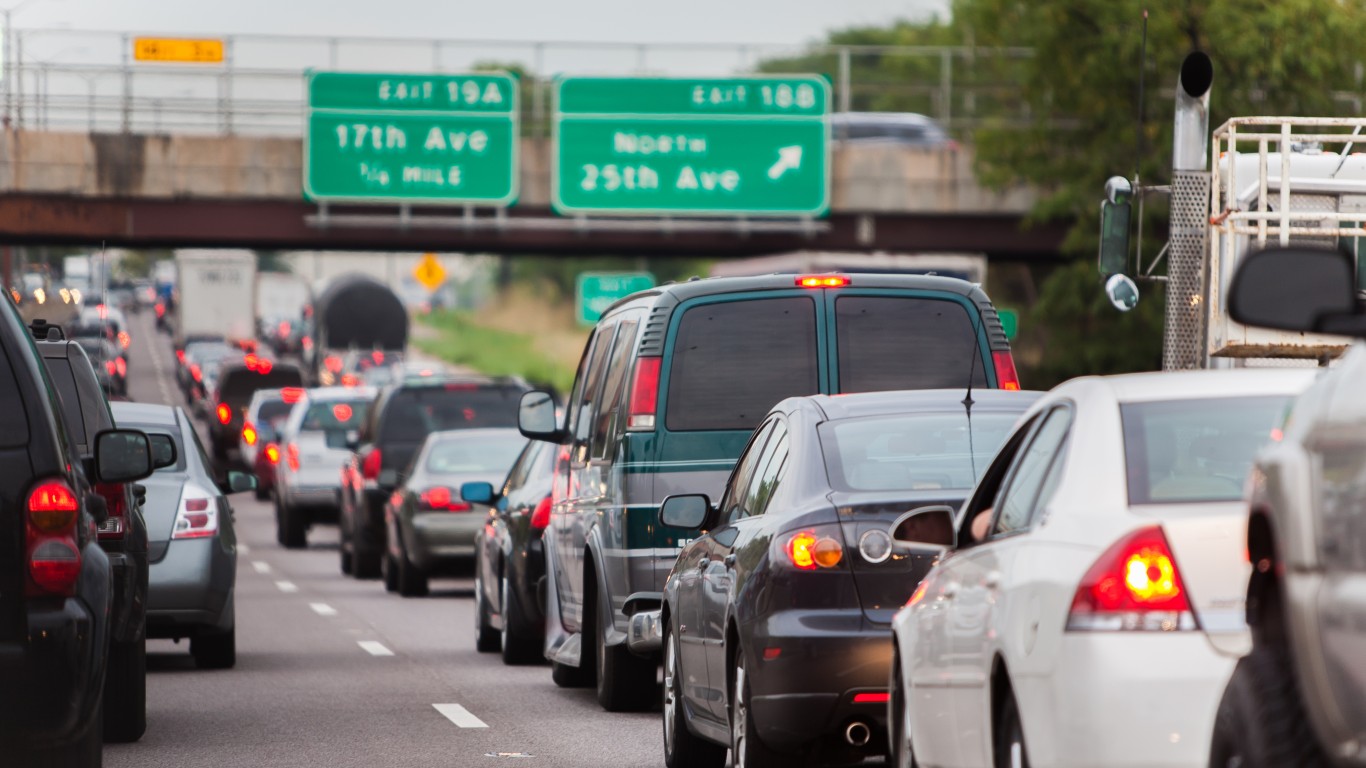
Source: Allkindza / E+ via Getty Images
Illinois: Chicago
> Avg. time lost to traffic delays in 2022: 155 hours per commuter
> Overall national ranking: the worst of 280 U.S. cities considered
> Change in traffic delays from 2021: +49%
> Avg. commute time in city: 34 minutes (State avg.: 29 minutes)
> Commuters who drive or carpool to work: 743,250; 62.7% of commuters
> Cities considered in state: 7
Source: RudyBalasko / Getty Images
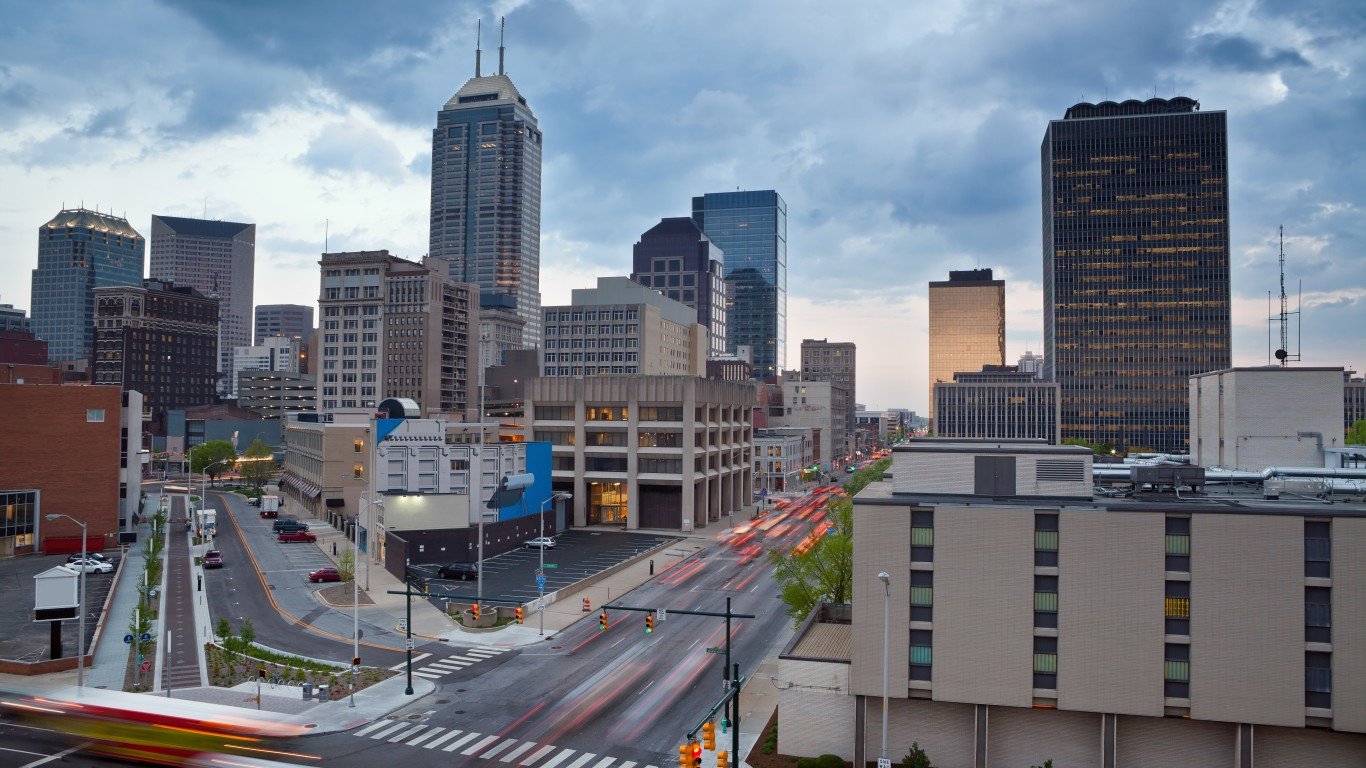
Indiana: Indianapolis
> Avg. time lost to traffic delays in 2022: 24 hours per commuter
> Overall national ranking: tied – 46th worst of 280 U.S. cities considered
> Change in traffic delays from 2021: +71%
> Avg. commute time in city: 24 minutes (State avg.: 24 minutes)
> Commuters who drive or carpool to work: 368,371; 94.8% of commuters
> Cities considered in state: 7
[in-text-ad-2]
Source: JoeChristensen / iStock Unreleased via Getty Images
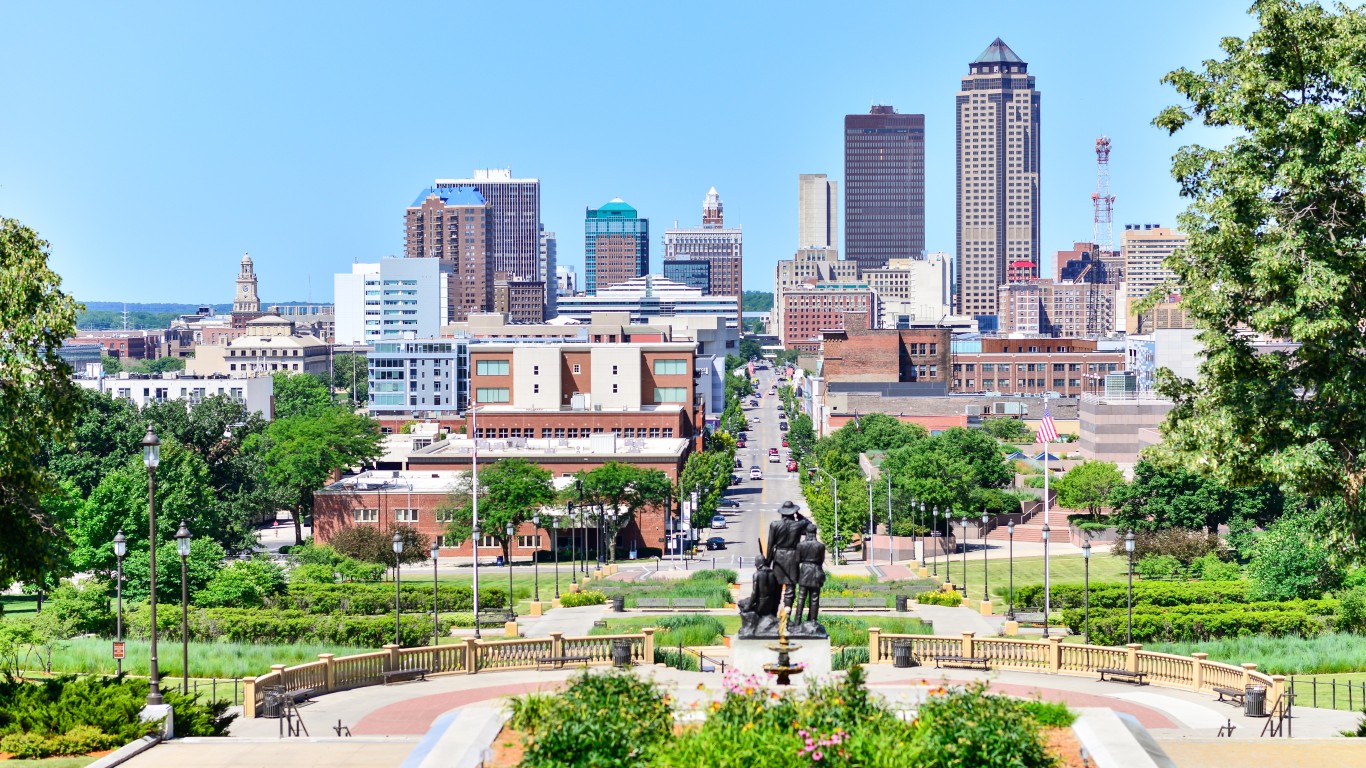
Iowa: Des Moines
> Avg. time lost to traffic delays in 2022: 7 hours per commuter
> Overall national ranking: tied – 205th worst of 280 U.S. cities considered
> Change in traffic delays from 2021: +3%
> Avg. commute time in city: 19 minutes (State avg.: 20 minutes)
> Commuters who drive or carpool to work: 93,450; 93.7% of commuters
> Cities considered in state: 1
Because Des Moines is the only city with available data in Iowa, it ranks as having the worst traffic by default.
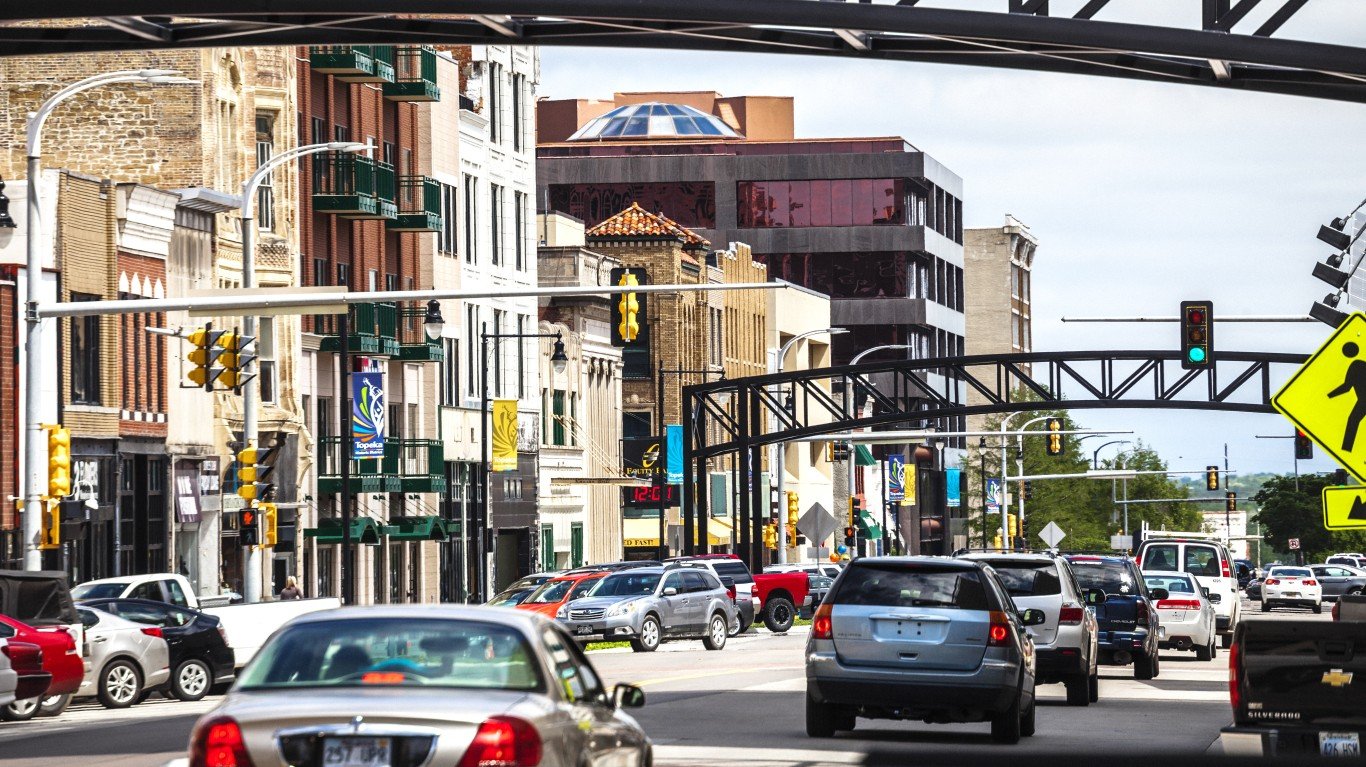
Source: peeterv / iStock via Getty Images
Kansas: Topeka
> Avg. time lost to traffic delays in 2022: 0 hours per commuter
> Overall national ranking: tied – 274th worst of 280 U.S. cities considered
> Change in traffic delays from 2021: +0%
> Avg. commute time in city: 17 minutes (State avg.: 20 minutes)
> Commuters who drive or carpool to work: 52,509; 95.8% of commuters
> Cities considered in state: 2
[in-text-ad]
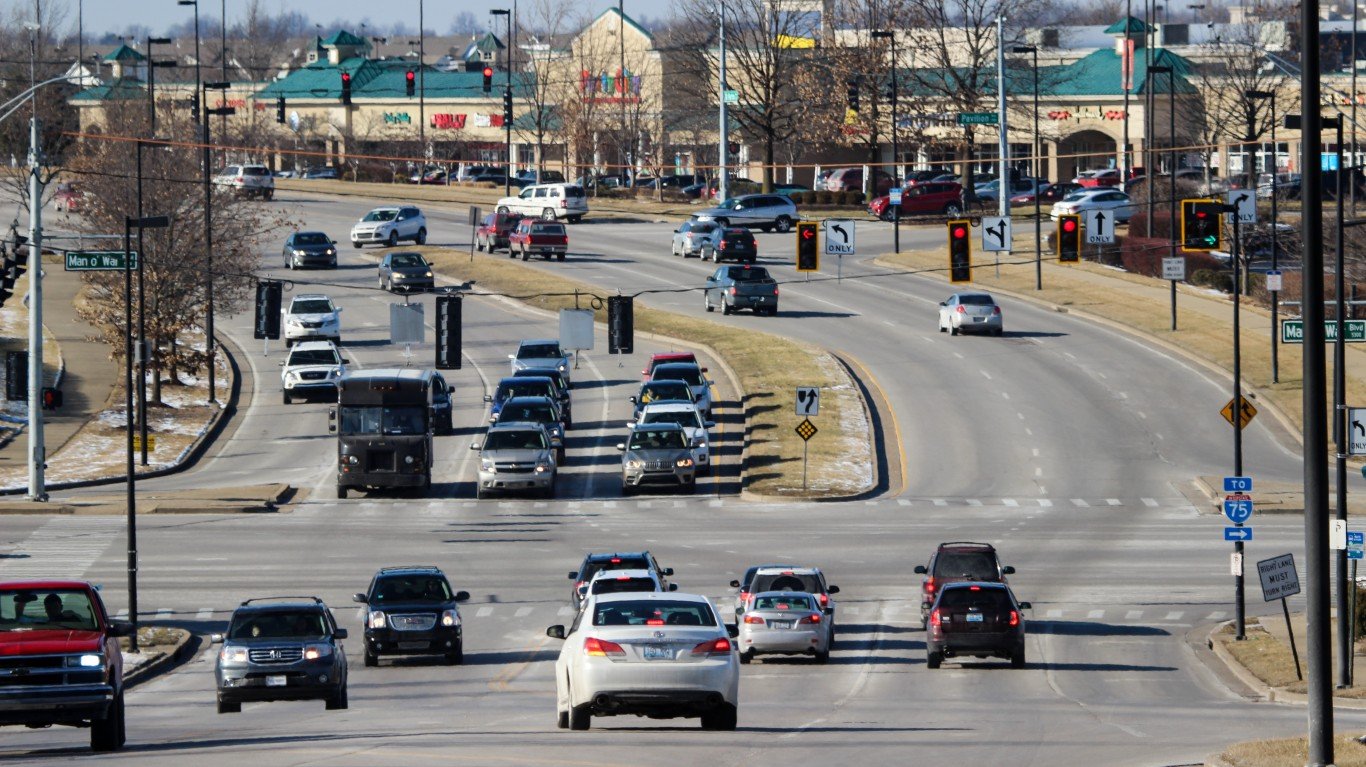
Source: JerryGrugin / iStock Editorial via Getty Images
Kentucky: Lexington
> Avg. time lost to traffic delays in 2022: 22 hours per commuter
> Overall national ranking: tied – 63rd worst of 280 U.S. cities considered
> Change in traffic delays from 2021: +27%
> Avg. commute time in city: 21 minutes (State avg.: 24 minutes)
> Commuters who drive or carpool to work: 140,129; 92.6% of commuters
> Cities considered in state: 2
 24/7 Wall St.
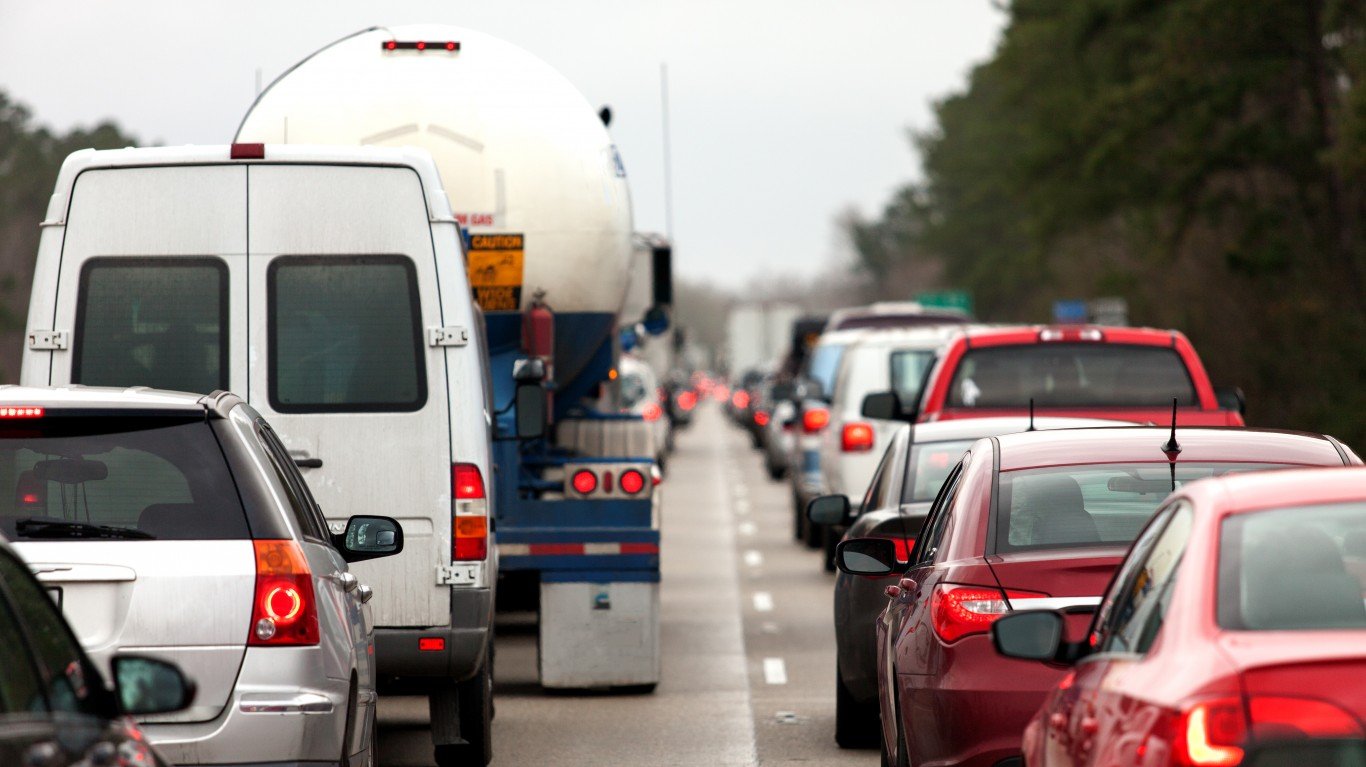
Source: huseyintuncer / iStock via Getty Images
Louisiana: New Orleans
> Avg. time lost to traffic delays in 2022: 77 hours per commuter
> Overall national ranking: 9th worst of 280 U.S. cities considered
> Change in traffic delays from 2021: +22%
> Avg. commute time in city: 23 minutes (State avg.: 26 minutes)
> Commuters who drive or carpool to work: 128,457; 82.7% of commuters
> Cities considered in state: 3
Source: DenisTangneyJr / iStock via Getty Images
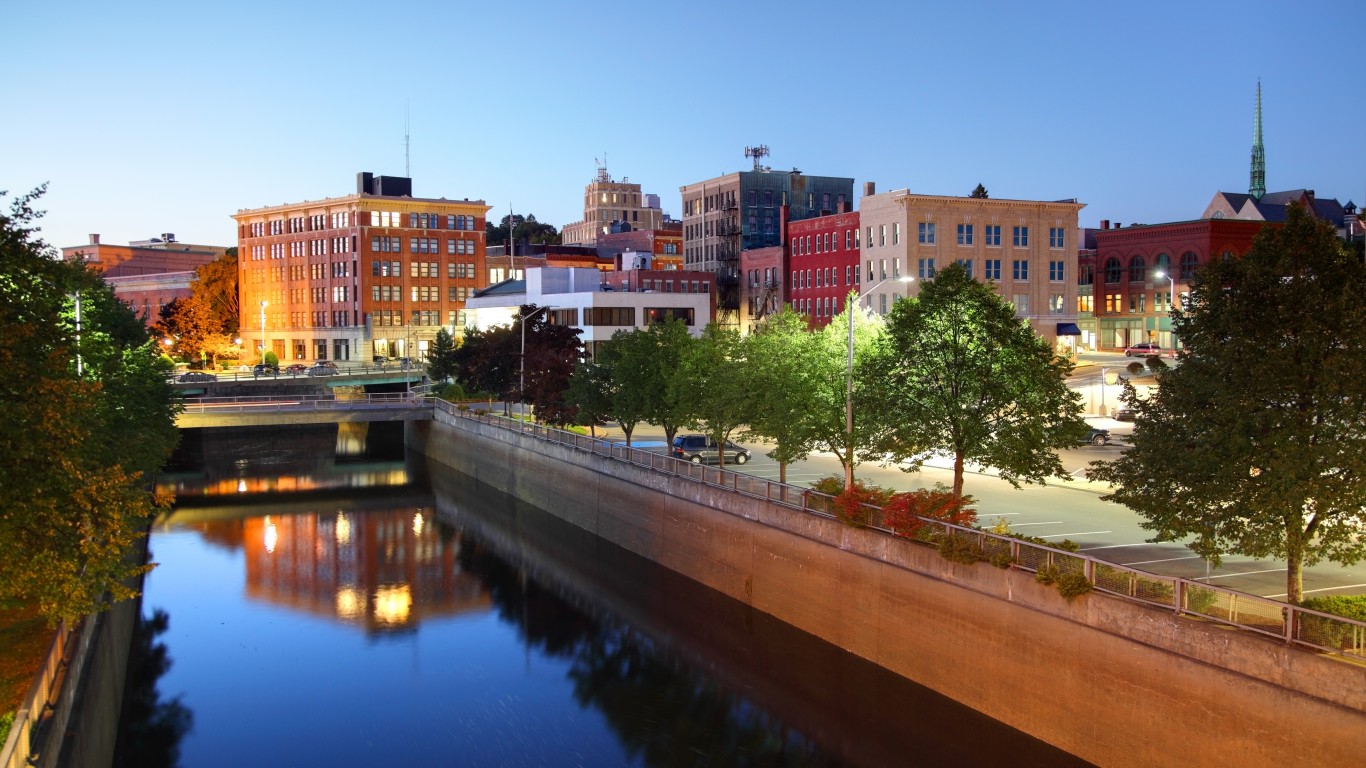
Maine: Bangor
> Avg. time lost to traffic delays in 2022: 8 hours per commuter
> Overall national ranking: tied – 182nd worst of 280 U.S. cities considered
> Change in traffic delays from 2021: +5%
> Avg. commute time in city: 17 minutes (State avg.: 24 minutes)
> Commuters who drive or carpool to work: 12,365; 89.2% of commuters
> Cities considered in state: 2
[in-text-ad-2]
Source: raksyBH / iStock Editorial via Getty Images
Maryland: Baltimore
> Avg. time lost to traffic delays in 2022: 55 hours per commuter
> Overall national ranking: 15th worst of 280 U.S. cities considered
> Change in traffic delays from 2021: +49%
> Avg. commute time in city: 31 minutes (State avg.: 32 minutes)
> Commuters who drive or carpool to work: 179,149; 73.9% of commuters
> Cities considered in state: 6
Source: DenisTangneyJr / E+ via Getty Images
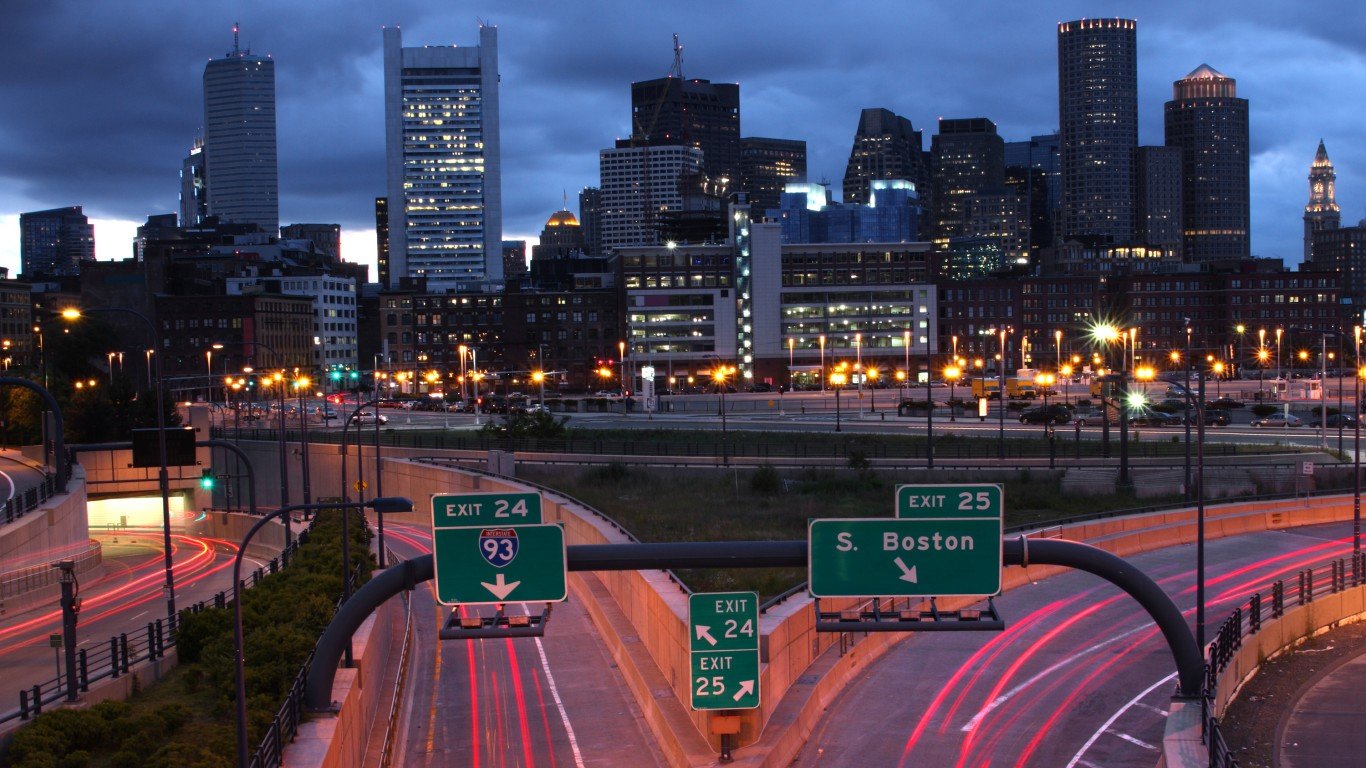
Massachusetts: Boston
> Avg. time lost to traffic delays in 2022: 134 hours per commuter
> Overall national ranking: 2nd worst of 280 U.S. cities considered
> Change in traffic delays from 2021: +72%
> Avg. commute time in city: 31 minutes (State avg.: 30 minutes)
> Commuters who drive or carpool to work: 151,856; 47.3% of commuters
> Cities considered in state: 9
[in-text-ad]
Source: ChrisBoswell / iStock via Getty Images
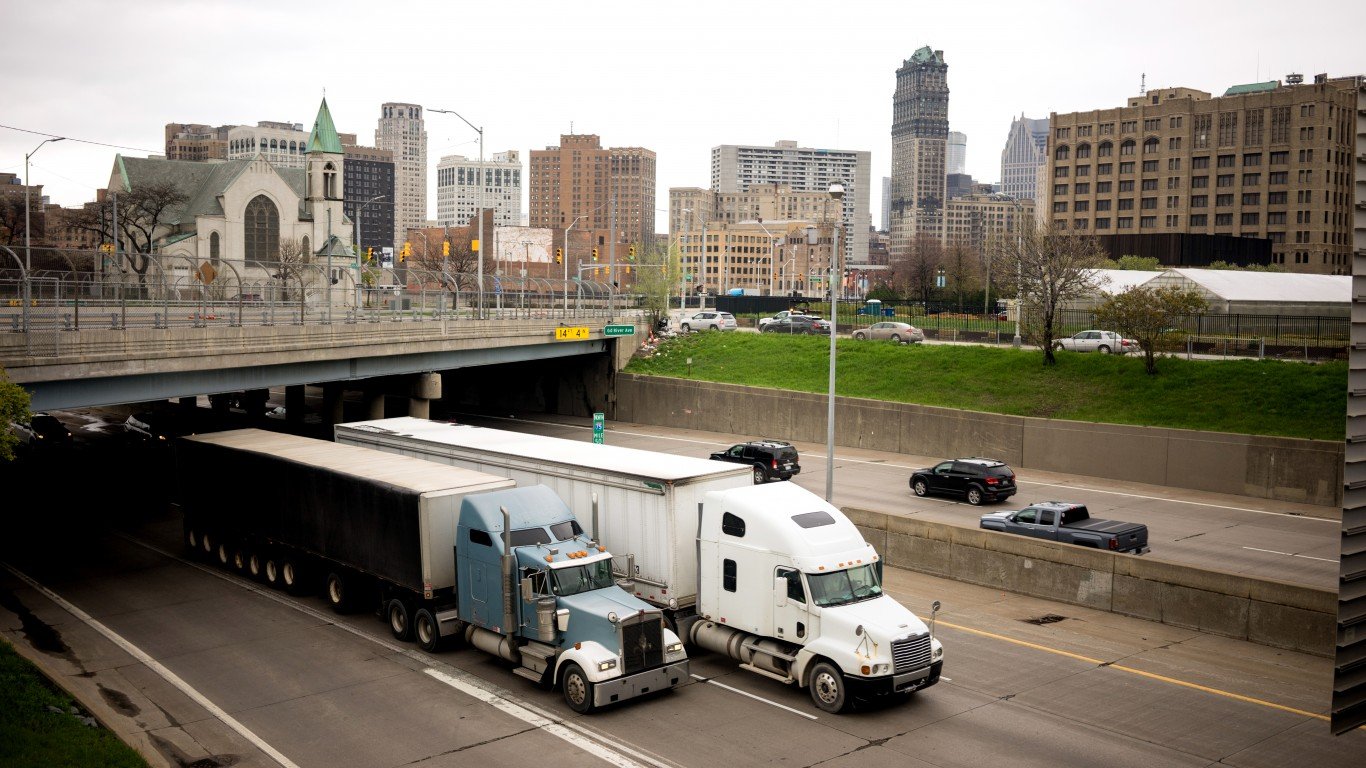
Michigan: Detroit
> Avg. time lost to traffic delays in 2022: 23 hours per commuter
> Overall national ranking: tied – 53rd worst of 280 U.S. cities considered
> Change in traffic delays from 2021: +75%
> Avg. commute time in city: 26 minutes (State avg.: 25 minutes)
> Commuters who drive or carpool to work: 178,700; 85.9% of commuters
> Cities considered in state: 7
 24/7 Wall St.
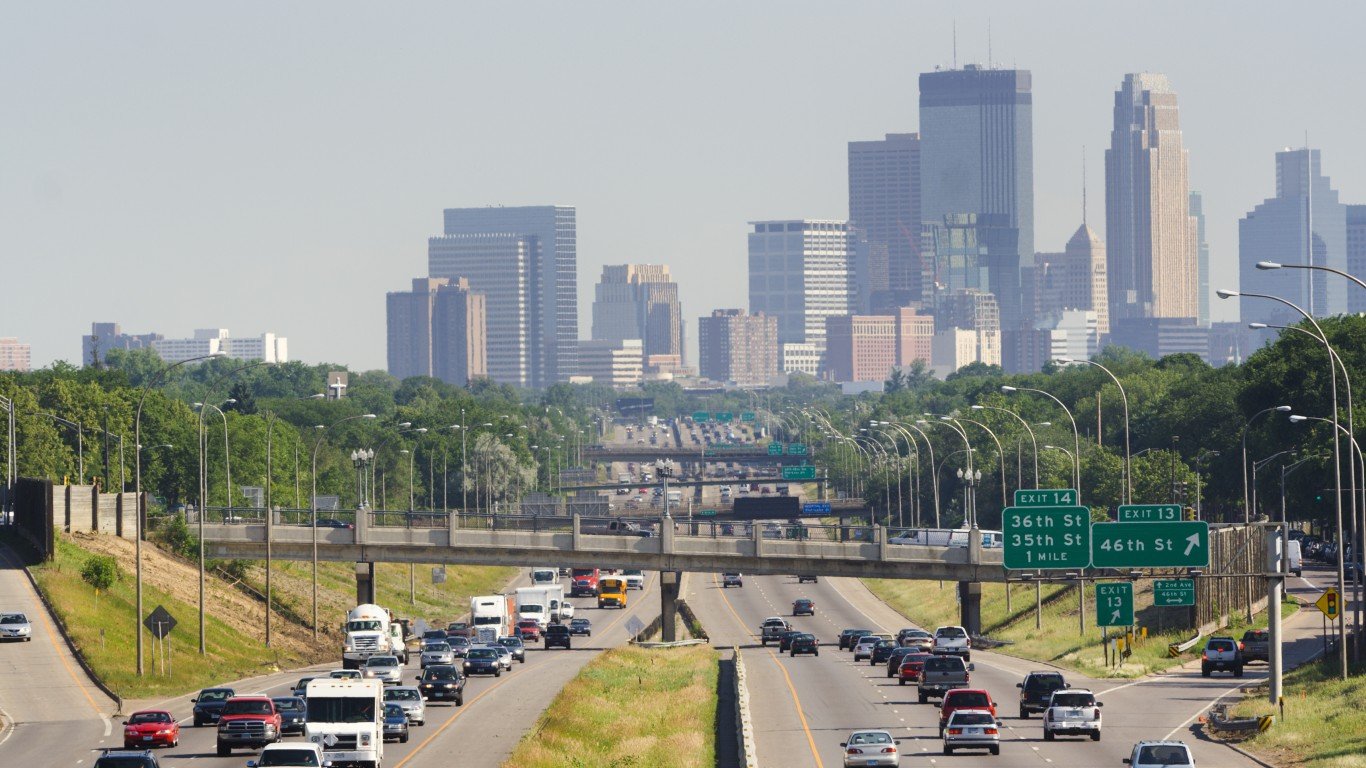
Source: YinYang / E+ via Getty Images
Minnesota: Minneapolis
> Avg. time lost to traffic delays in 2022: 26 hours per commuter
> Overall national ranking: tied – 39th worst of 280 U.S. cities considered
> Change in traffic delays from 2021: +47%
> Avg. commute time in city: 23 minutes (State avg.: 24 minutes)
> Commuters who drive or carpool to work: 149,817; 74.4% of commuters
> Cities considered in state: 1
Because Minneapolis is the only city with available data in Minnesota, it ranks as having the worst traffic by default.

Mississippi: Jackson
> Avg. time lost to traffic delays in 2022: 4 hours per commuter
> Overall national ranking: tied – 242nd worst of 280 U.S. cities considered
> Change in traffic delays from 2021: -10%
> Avg. commute time in city: 21 minutes (State avg.: 25 minutes)
> Commuters who drive or carpool to work: 61,304; 97.1% of commuters
> Cities considered in state: 2
[in-text-ad-2]
Source: peeterv / iStock via Getty Images
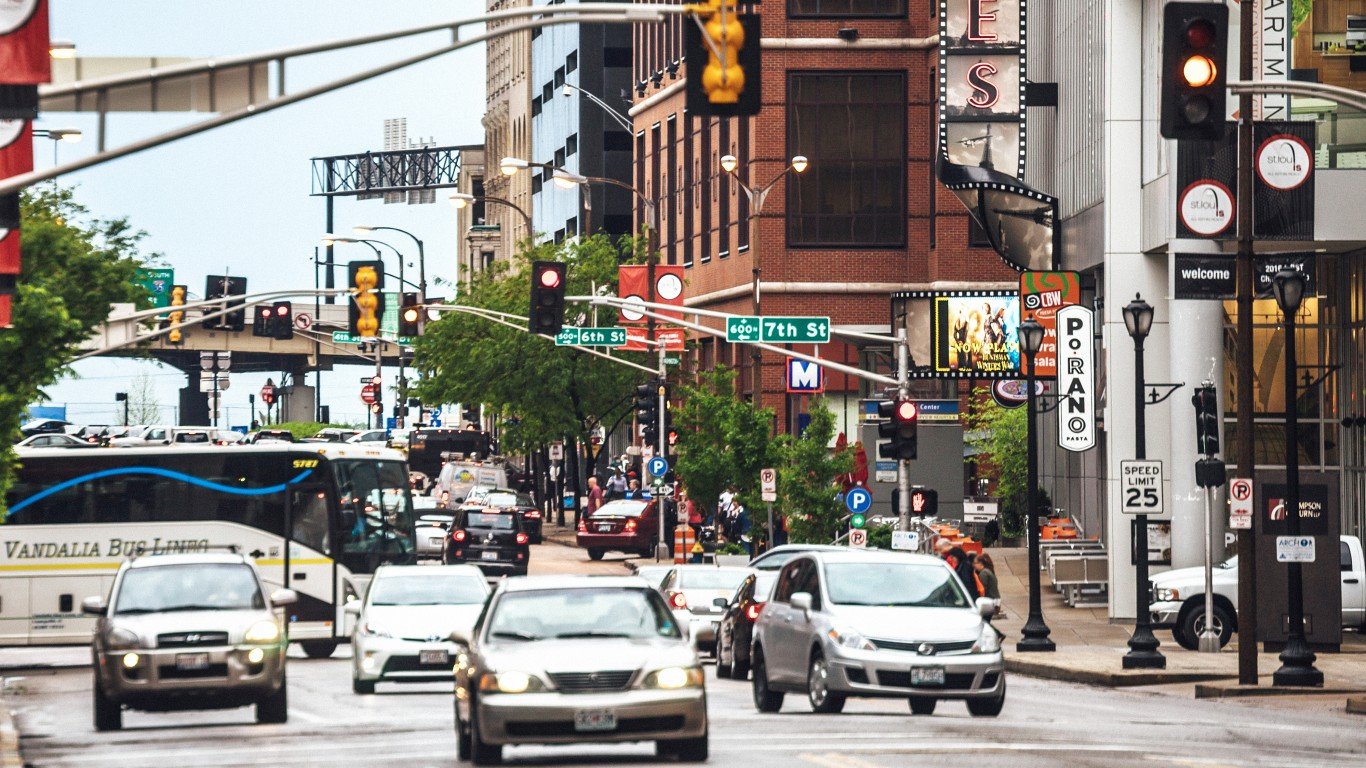
Missouri: St. Louis
> Avg. time lost to traffic delays in 2022: 17 hours per commuter
> Overall national ranking: tied – 91st worst of 280 U.S. cities considered
> Change in traffic delays from 2021: +68%
> Avg. commute time in city: 23 minutes (State avg.: 24 minutes)
> Commuters who drive or carpool to work: 117,199; 85.5% of commuters
> Cities considered in state: 2
Source: Jon Bilous / iStock via Getty Images
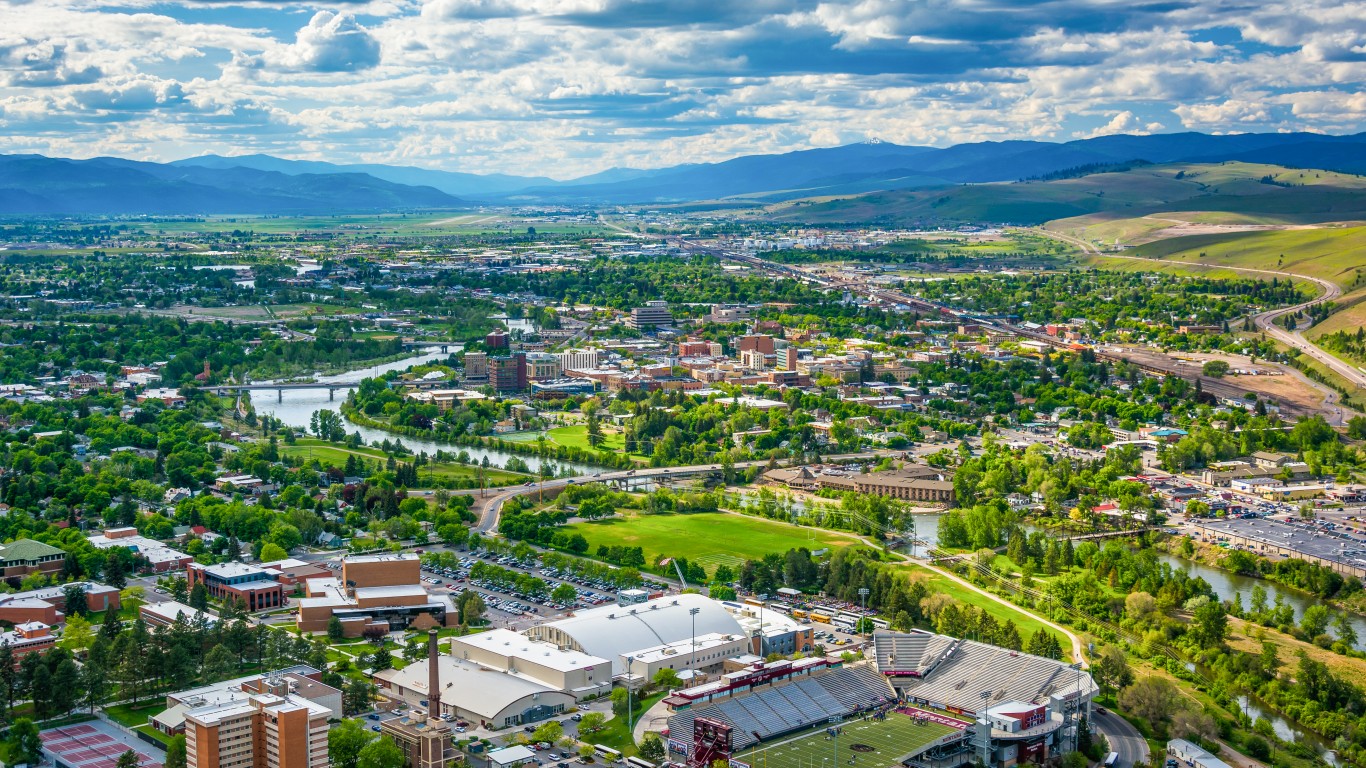
Montana: Missoula
> Avg. time lost to traffic delays in 2022: 22 hours per commuter
> Overall national ranking: tied – 63rd worst of 280 U.S. cities considered
> Change in traffic delays from 2021: +20%
> Avg. commute time in city: 16 minutes (State avg.: 19 minutes)
> Commuters who drive or carpool to work: 32,765; 85.8% of commuters
> Cities considered in state: 4
[in-text-ad]
Source: RiverNorthPhotography / iStock Unreleased via Getty Images
Nebraska: Omaha
> Avg. time lost to traffic delays in 2022: 14 hours per commuter
> Overall national ranking: tied – 110th worst of 280 U.S. cities considered
> Change in traffic delays from 2021: +11%
> Avg. commute time in city: 19 minutes (State avg.: 19 minutes)
> Commuters who drive or carpool to work: 215,928; 94.9% of commuters
> Cities considered in state: 2
 24/7 Wall St.
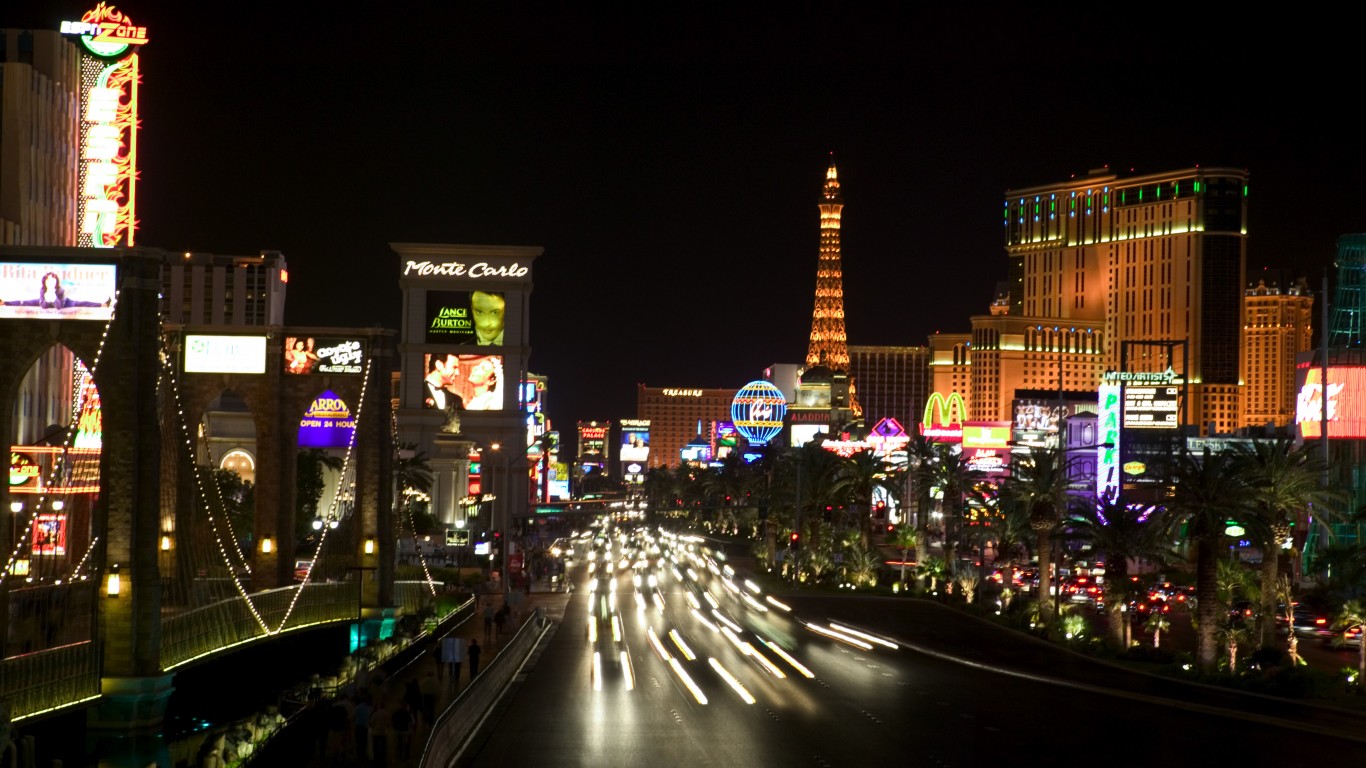
Source: Thinkstock / Stockbyte via Getty Images
Nevada: Las Vegas
> Avg. time lost to traffic delays in 2022: 41 hours per commuter
> Overall national ranking: tied – 22nd worst of 280 U.S. cities considered
> Change in traffic delays from 2021: +46%
> Avg. commute time in city: 26 minutes (State avg.: 25 minutes)
> Commuters who drive or carpool to work: 243,916; 92.2% of commuters
> Cities considered in state: 3
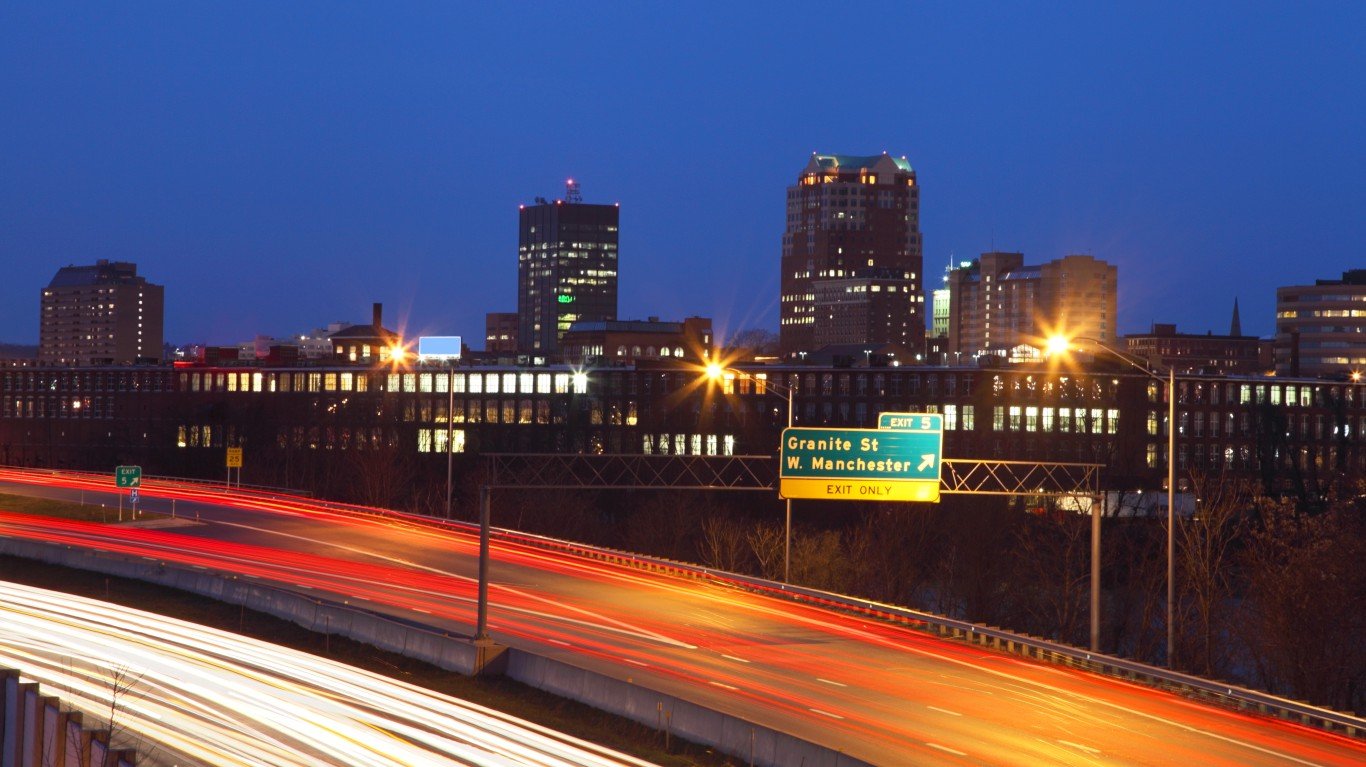
Source: DenisTangneyJr / iStock via Getty Images
New Hampshire: Manchester
> Avg. time lost to traffic delays in 2022: 13 hours per commuter
> Overall national ranking: tied – 127th worst of 280 U.S. cities considered
> Change in traffic delays from 2021: +20%
> Avg. commute time in city: 24 minutes (State avg.: 27 minutes)
> Commuters who drive or carpool to work: 55,412; 95.1% of commuters
> Cities considered in state: 4
[in-text-ad-2]
 in Ocean Township, Monmouth County, New Jersey by Famartin")
New Jersey: Ocean Township
> Avg. time lost to traffic delays in 2022: 17 hours per commuter
> Overall national ranking: tied – 91st worst of 280 U.S. cities considered
> Change in traffic delays from 2021: +87%
> Avg. commute time in Monmouth County: 34 minutes (State avg.: 31 minutes)
> Commuters who drive or carpool to work in Monmouth County: 251,861; 88.6% of commuters
> Cities considered in state: 7
Source: KateLeigh / iStock via Getty Images
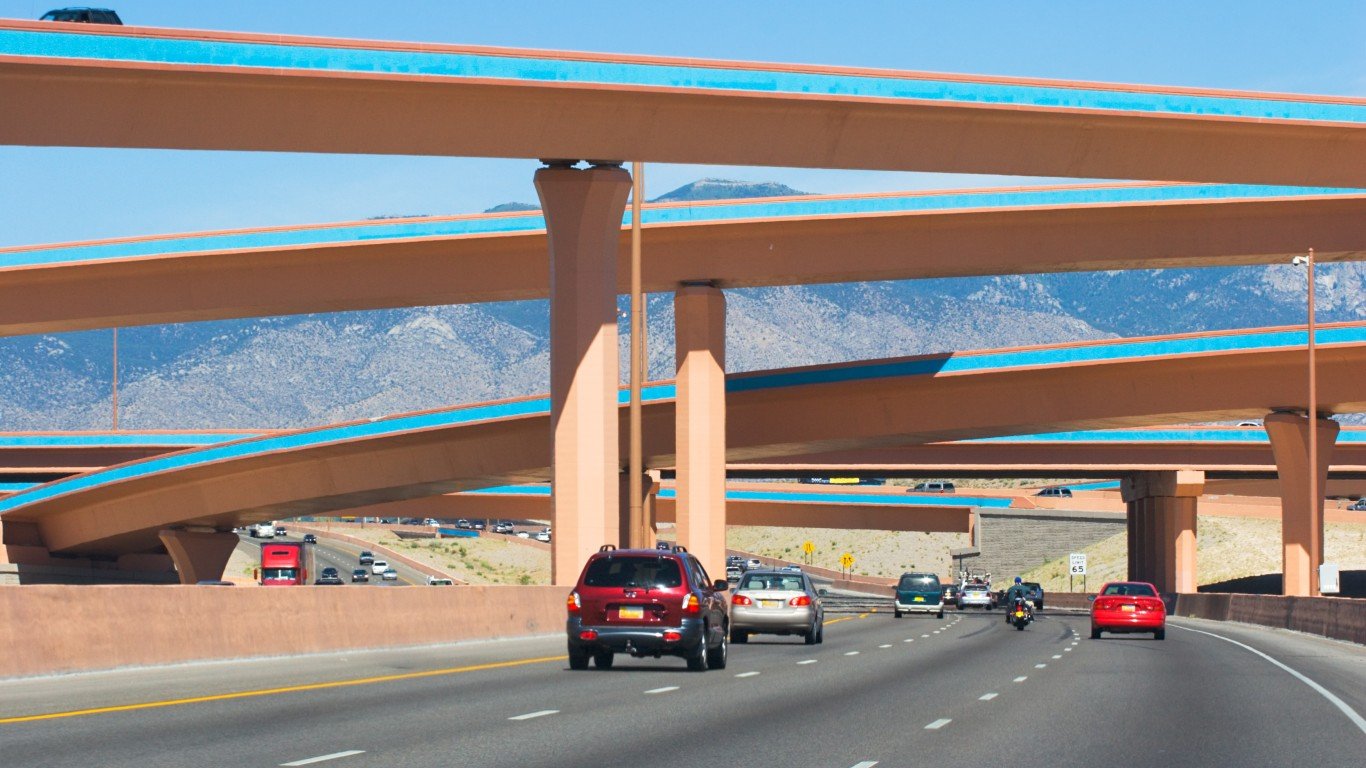
New Mexico: Albuquerque
> Avg. time lost to traffic delays in 2022: 20 hours per commuter
> Overall national ranking: tied – 71st worst of 280 U.S. cities considered
> Change in traffic delays from 2021: +155%
> Avg. commute time in city: 22 minutes (State avg.: 23 minutes)
> Commuters who drive or carpool to work: 232,016; 94.3% of commuters
> Cities considered in state: 4
[in-text-ad]
Source: Eloi_Omella / iStock via Getty Images
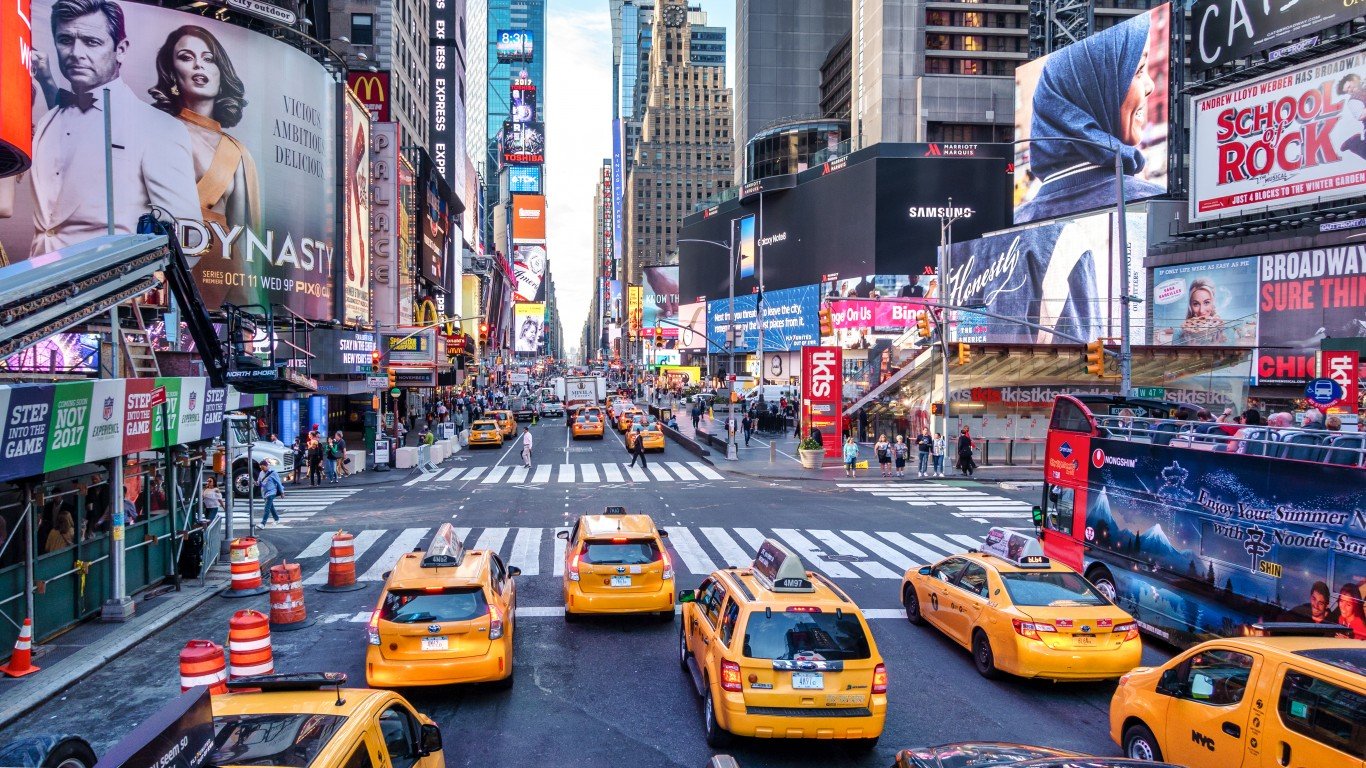
New York: New York City
> Avg. time lost to traffic delays in 2022: 117 hours per commuter
> Overall national ranking: 3rd worst of 280 U.S. cities considered
> Change in traffic delays from 2021: +15%
> Avg. commute time in city: 41 minutes (State avg.: 33 minutes)
> Commuters who drive or carpool to work: 1,082,647; 30.0% of commuters
> Cities considered in state: 9
Source: digidreamgrafix / iStock via Getty Images
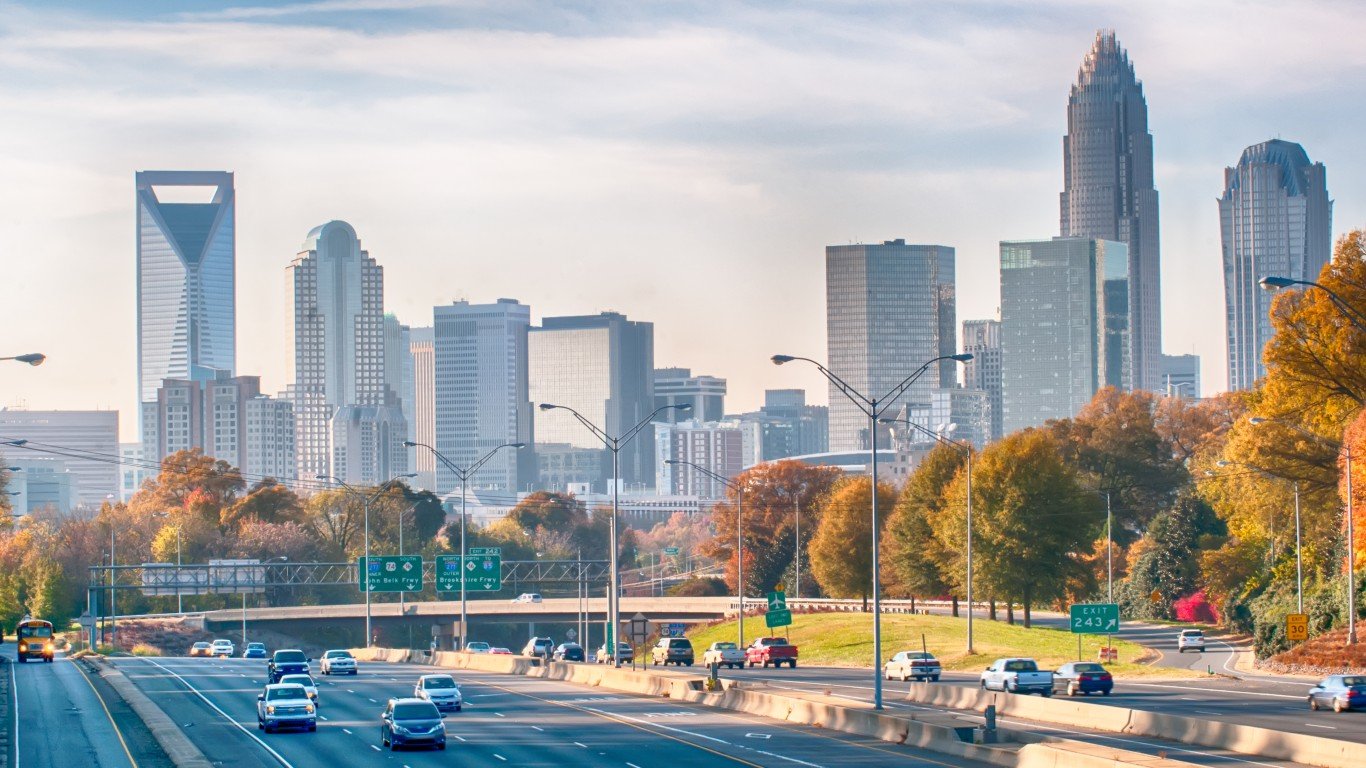
North Carolina: Charlotte
> Avg. time lost to traffic delays in 2022: 25 hours per commuter
> Overall national ranking: tied – 43rd worst of 280 U.S. cities considered
> Change in traffic delays from 2021: +48%
> Avg. commute time in city: 25 minutes (State avg.: 25 minutes)
> Commuters who drive or carpool to work: 354,197; 92.8% of commuters
> Cities considered in state: 9
Source: Tiago_Fernandez / iStock Editorial via Getty Images
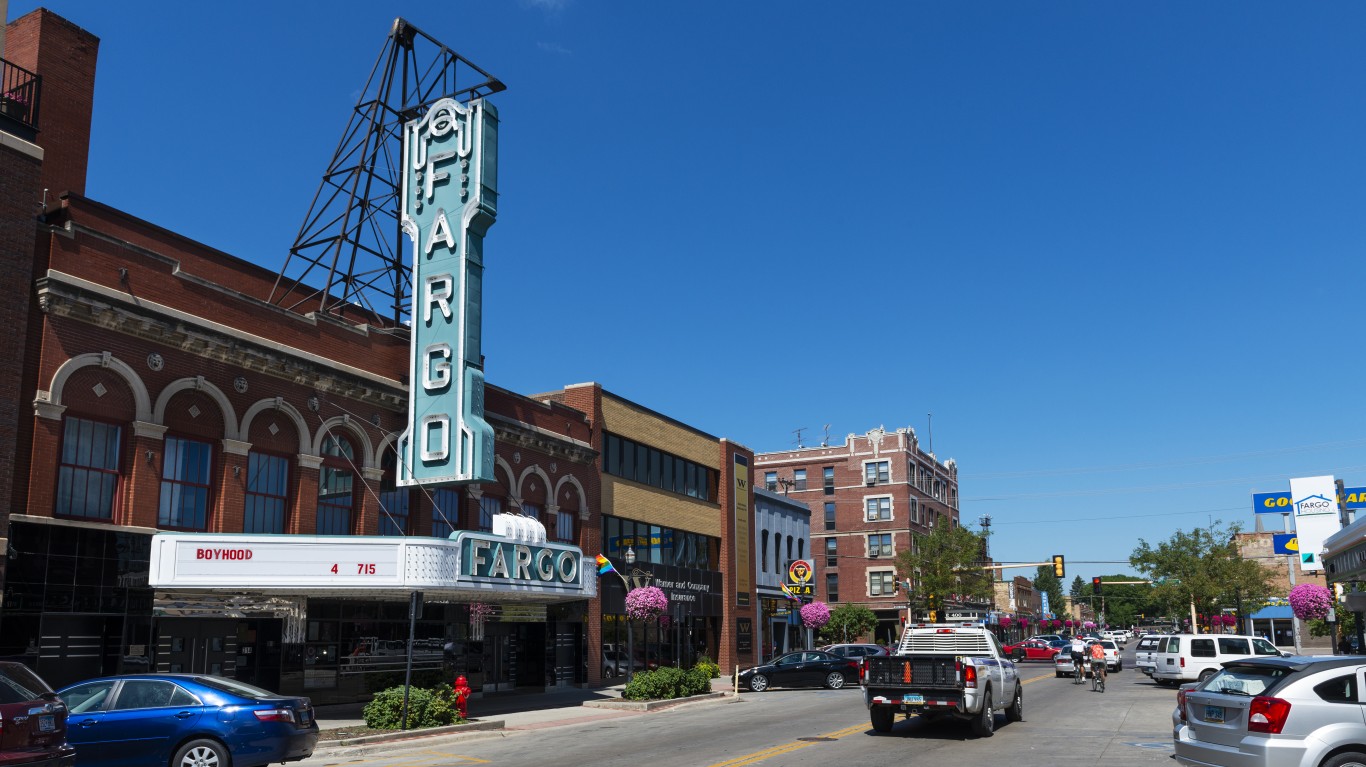
North Dakota: Fargo
> Avg. time lost to traffic delays in 2022: 0 hours per commuter
> Overall national ranking: tied – 274th worst of 280 U.S. cities considered
> Change in traffic delays from 2021: +0%
> Avg. commute time in city: 16 minutes (State avg.: 18 minutes)
> Commuters who drive or carpool to work: 63,762; 92.4% of commuters
> Cities considered in state: 1
Because Fargo is the only city with available data in North Dakota, it ranks as having the worst traffic by default.
[in-text-ad-2]
Source: RudyBalasko / Getty Images
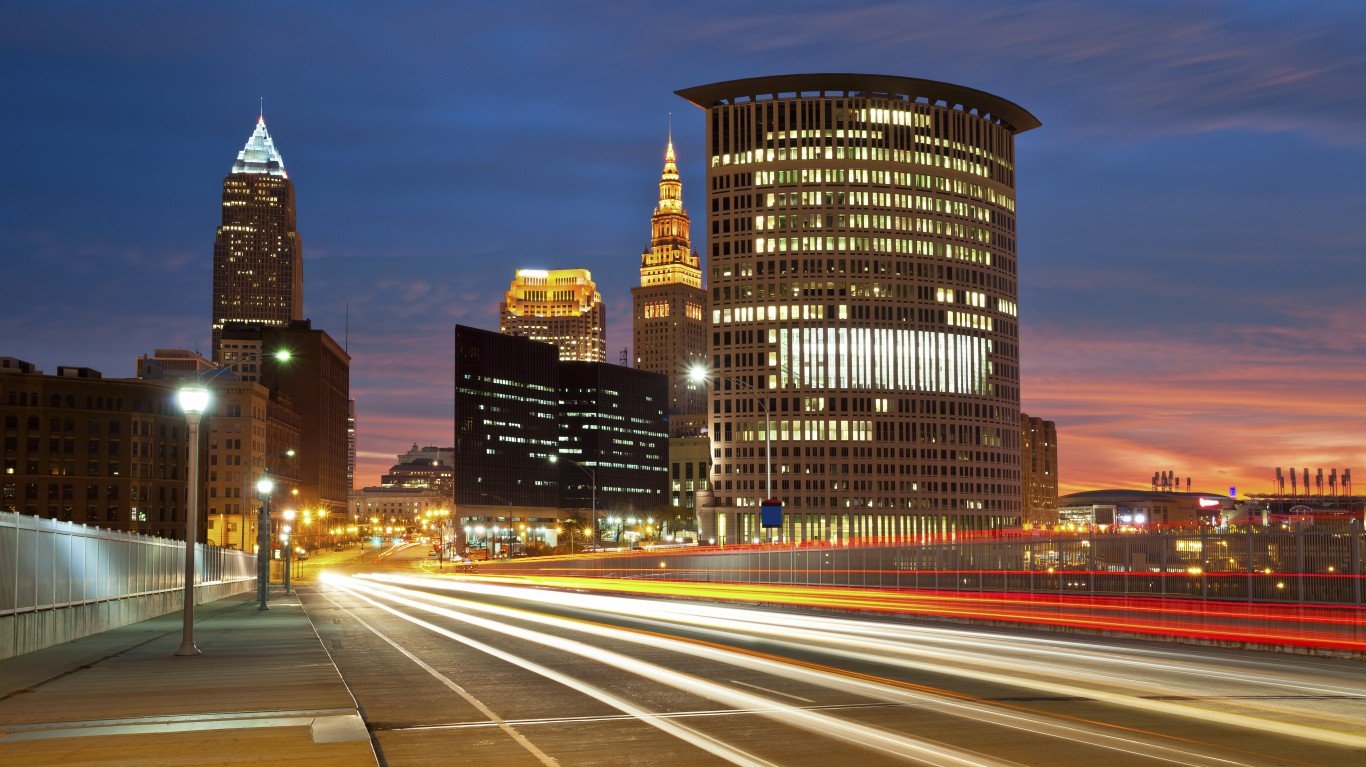
Ohio: Cleveland
> Avg. time lost to traffic delays in 2022: 20 hours per commuter
> Overall national ranking: tied – 71st worst of 280 U.S. cities considered
> Change in traffic delays from 2021: +36%
> Avg. commute time in city: 23 minutes (State avg.: 24 minutes)
> Commuters who drive or carpool to work: 120,735; 84.3% of commuters
> Cities considered in state: 9
Source: peeterv / Getty Images
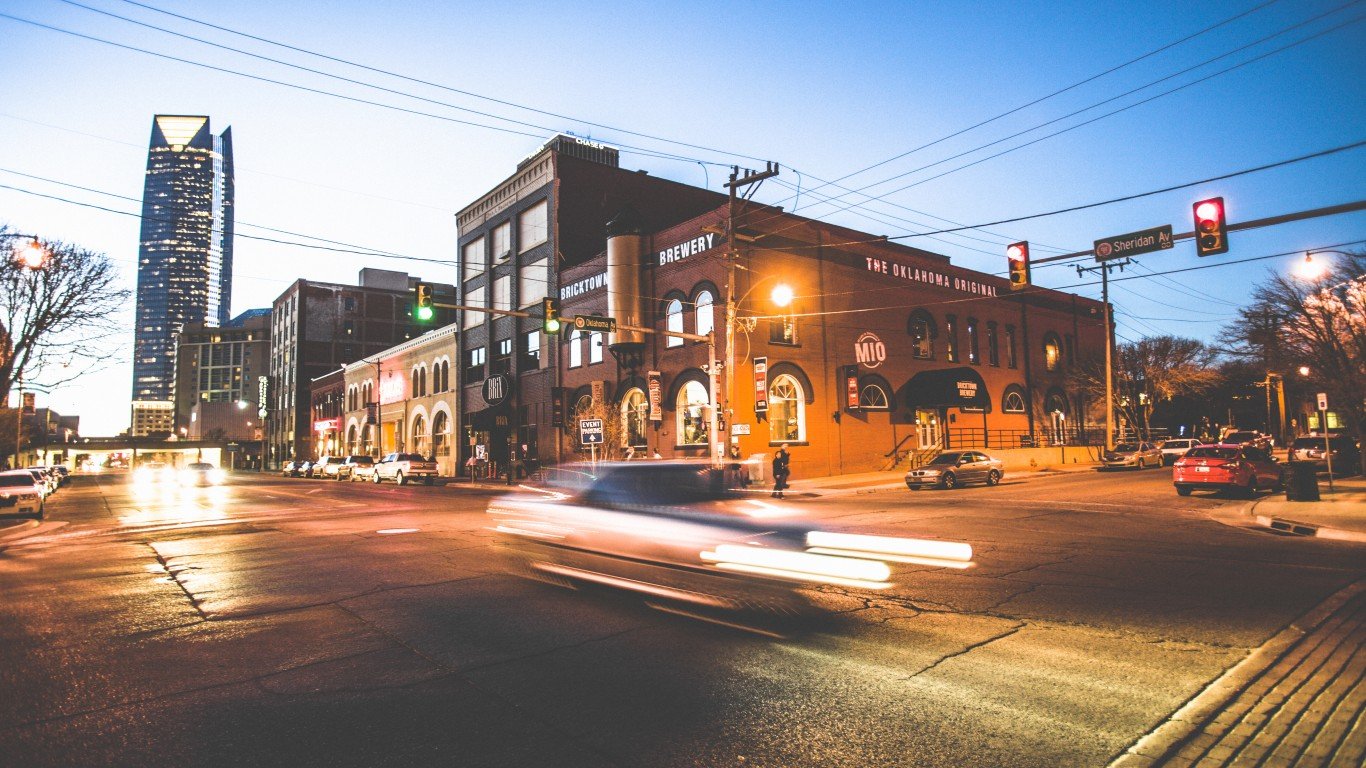
Oklahoma: Oklahoma City
> Avg. time lost to traffic delays in 2022: 14 hours per commuter
> Overall national ranking: tied – 110th worst of 280 U.S. cities considered
> Change in traffic delays from 2021: +44%
> Avg. commute time in city: 22 minutes (State avg.: 22 minutes)
> Commuters who drive or carpool to work: 298,213; 96.2% of commuters
> Cities considered in state: 2
[in-text-ad]
Source: peeterv / iStock via Getty Images
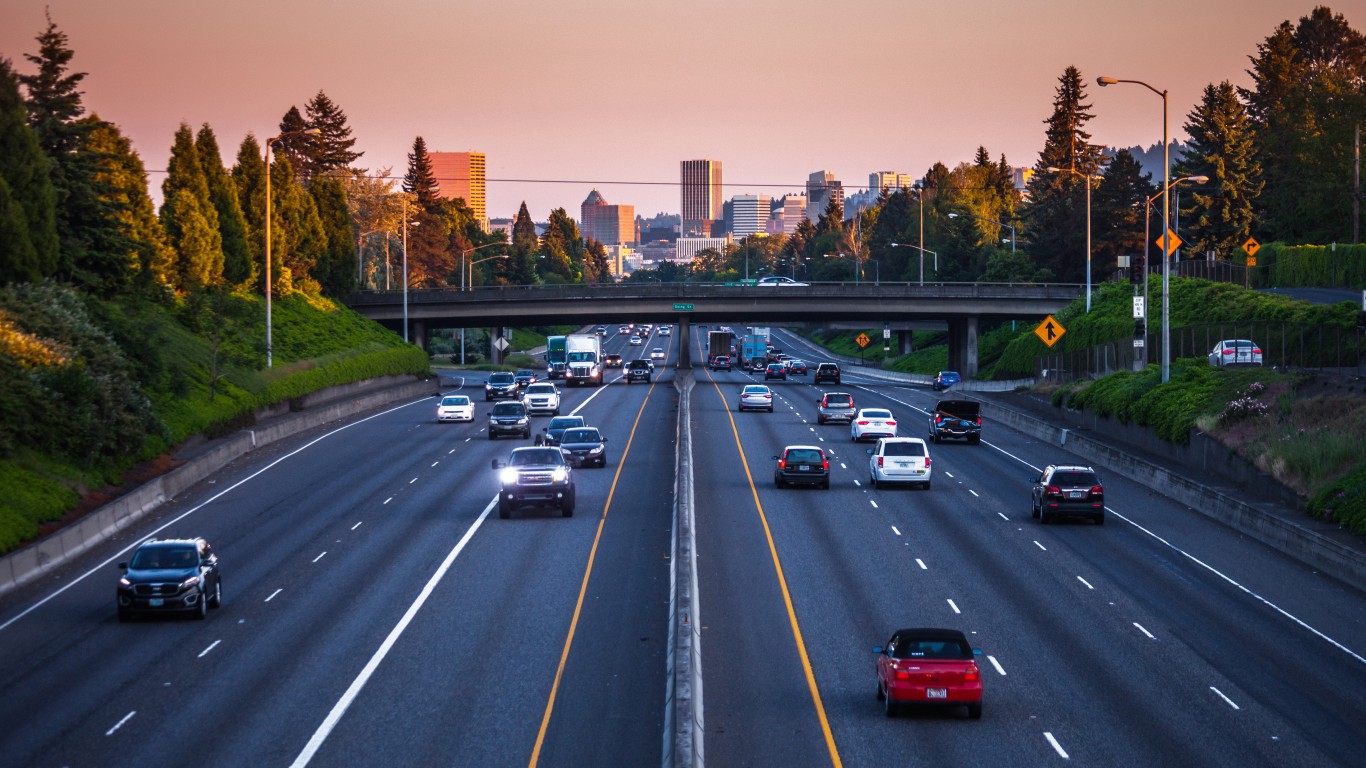
Oregon: Portland
> Avg. time lost to traffic delays in 2022: 72 hours per commuter
> Overall national ranking: 13th worst of 280 U.S. cities considered
> Change in traffic delays from 2021: +50%
> Avg. commute time in city: 26 minutes (State avg.: 24 minutes)
> Commuters who drive or carpool to work: 220,404; 74.5% of commuters
> Cities considered in state: 4
Source: peeterv / iStock via Getty Images
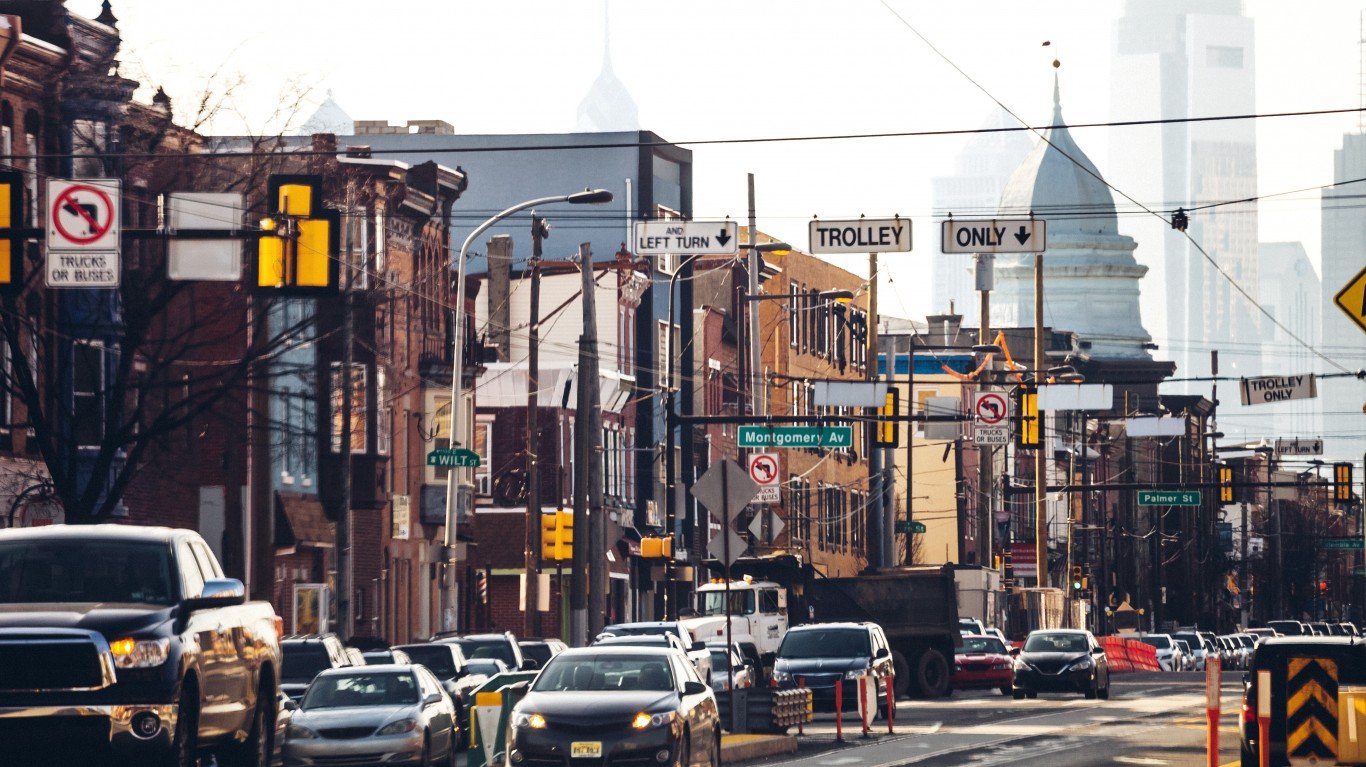
Pennsylvania: Philadelphia
> Avg. time lost to traffic delays in 2022: 114 hours per commuter
> Overall national ranking: 4th worst of 280 U.S. cities considered
> Change in traffic delays from 2021: +27%
> Avg. commute time in city: 33 minutes (State avg.: 27 minutes)
> Commuters who drive or carpool to work: 399,184; 62.9% of commuters
> Cities considered in state: 13
Source: aimintang / iStock Unreleased via Getty Images
Rhode Island: Providence
> Avg. time lost to traffic delays in 2022: 42 hours per commuter
> Overall national ranking: 21st worst of 280 U.S. cities considered
> Change in traffic delays from 2021: +11%
> Avg. commute time in city: 24 minutes (State avg.: 25 minutes)
> Commuters who drive or carpool to work: 65,447; 84.1% of commuters
> Cities considered in state: 1
Because Providence is the only city with available data in Rhode Island, it ranks as having the worst traffic by default.
[in-text-ad-2]
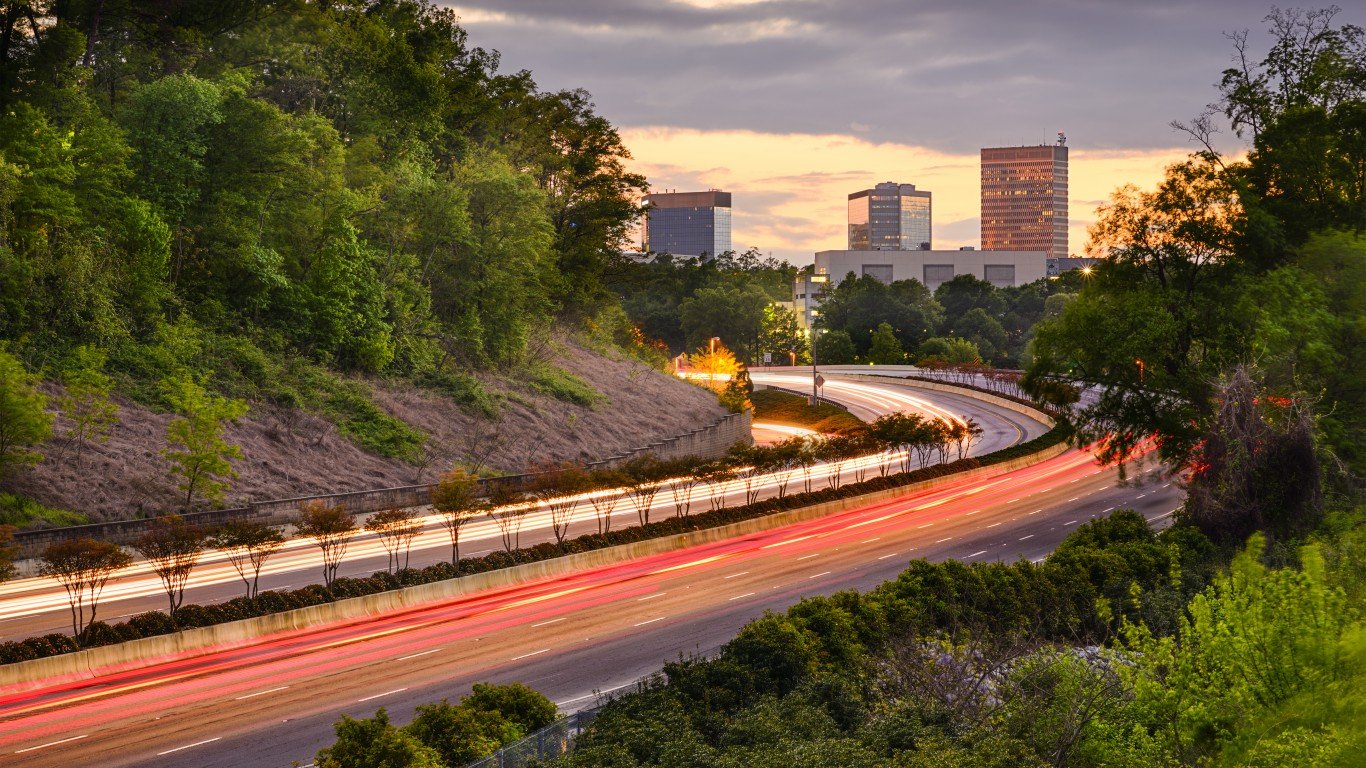
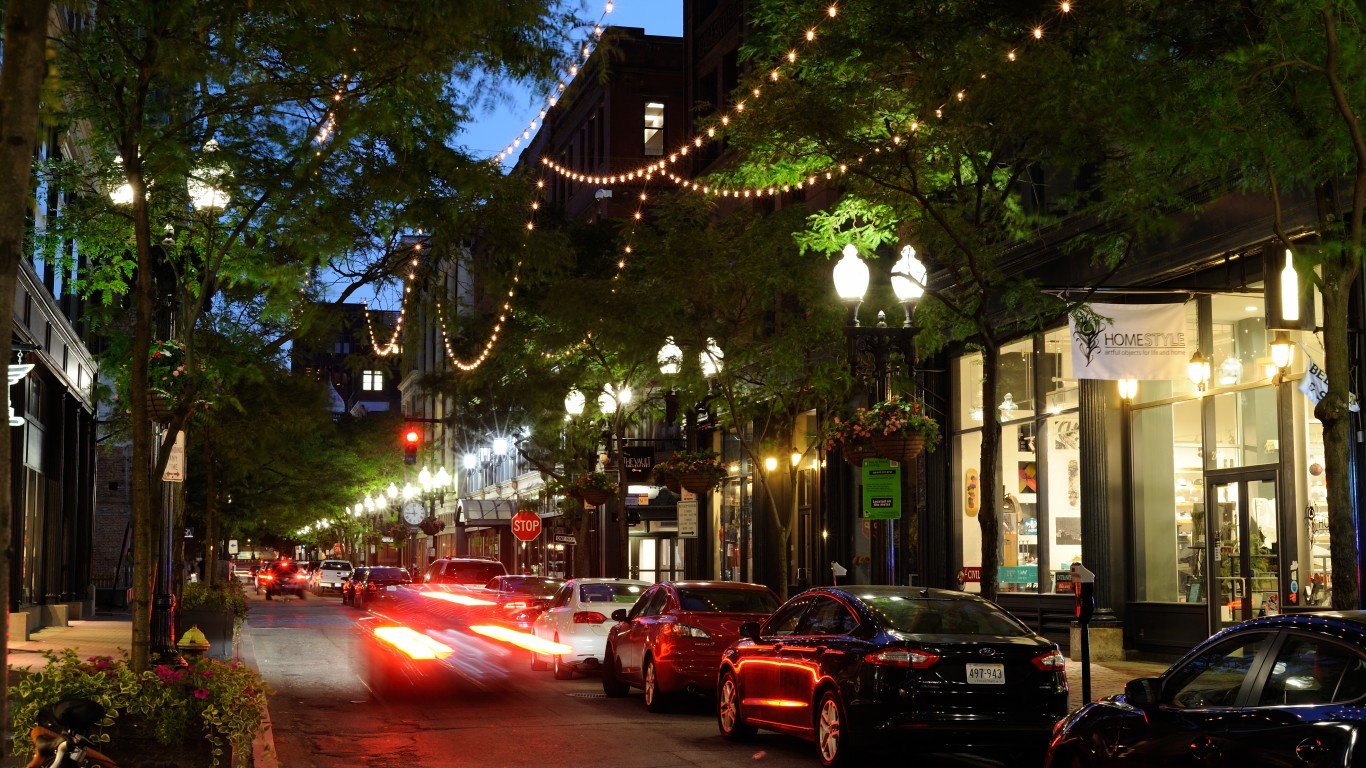
Source: SeanPavonePhoto / iStock via Getty Images
South Carolina: Greenville
> Avg. time lost to traffic delays in 2022: 23 hours per commuter
> Overall national ranking: tied – 53rd worst of 280 U.S. cities considered
> Change in traffic delays from 2021: +34%
> Avg. commute time in city: 20 minutes (State avg.: 25 minutes)
> Commuters who drive or carpool to work: 31,735; 92.1% of commuters
> Cities considered in state: 6
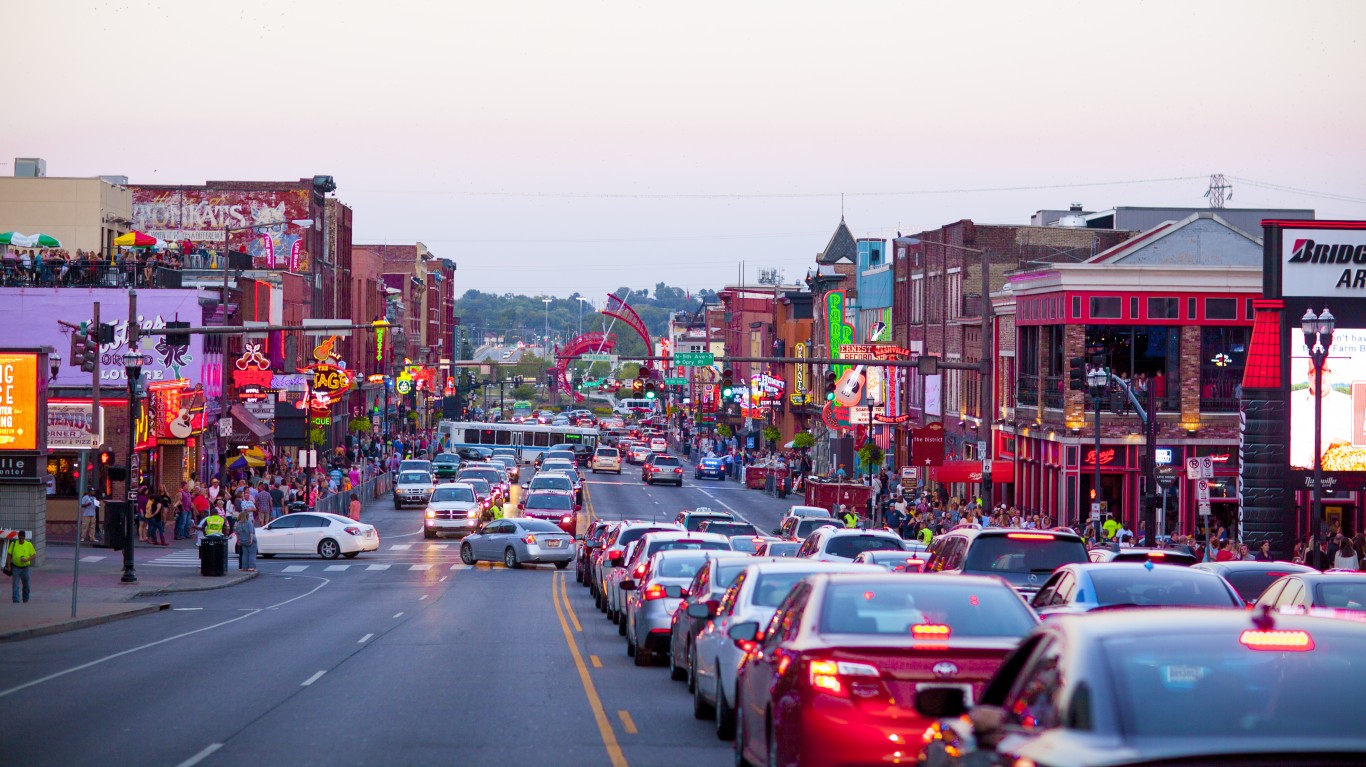
Source: FangXiaNuo / Getty Images
Tennessee: Nashville
> Avg. time lost to traffic delays in 2022: 41 hours per commuter
> Overall national ranking: tied – 22nd worst of 280 U.S. cities considered
> Change in traffic delays from 2021: +155%
> Avg. commute time in city: 25 minutes (State avg.: 25 minutes)
> Commuters who drive or carpool to work: 305,799; 93.8% of commuters
> Cities considered in state: 6
[in-text-ad]
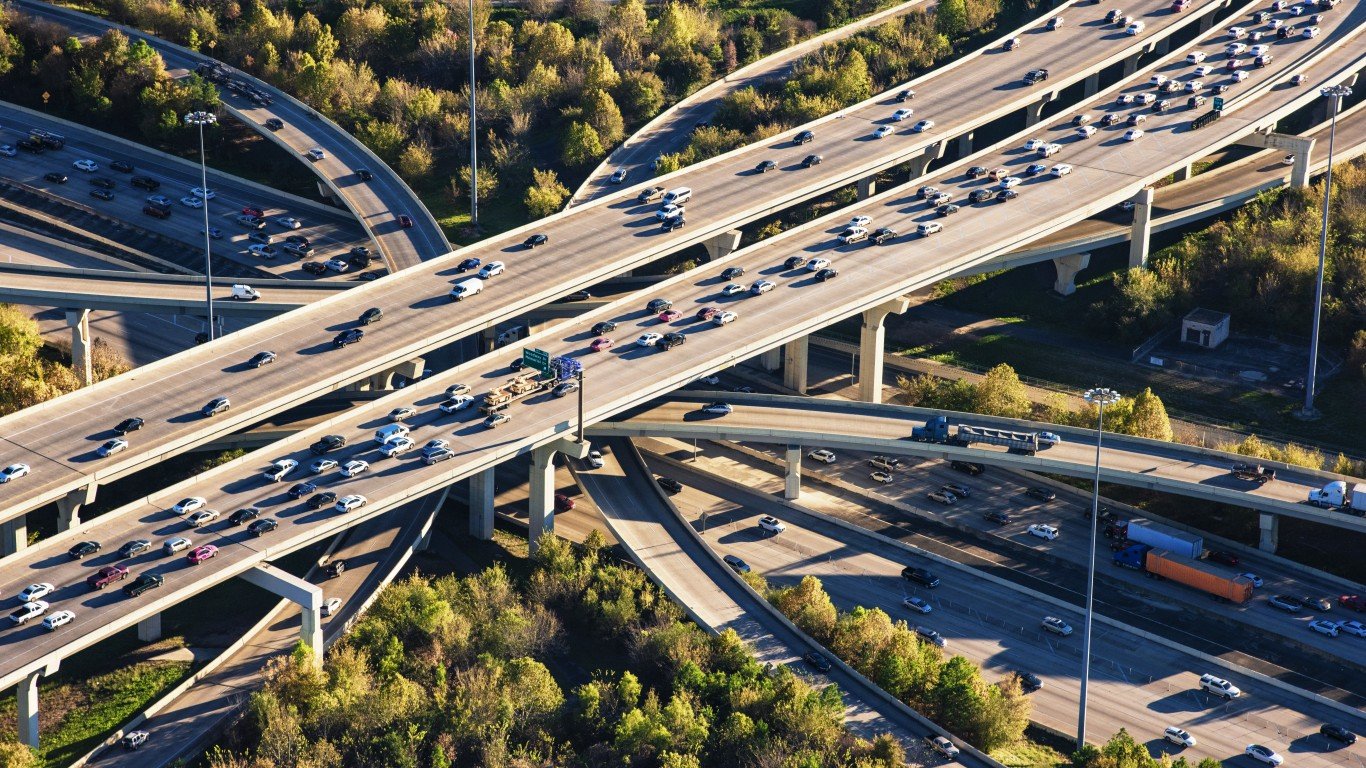
Source: Art Wager / E+ via Getty Images
Texas: Houston
> Avg. time lost to traffic delays in 2022: 74 hours per commuter
> Overall national ranking: tied – 10th worst of 280 U.S. cities considered
> Change in traffic delays from 2021: +28%
> Avg. commute time in city: 28 minutes (State avg.: 27 minutes)
> Commuters who drive or carpool to work: 912,664; 91.0% of commuters
> Cities considered in state: 20
Source: DenisTangneyJr / iStock via Getty Images
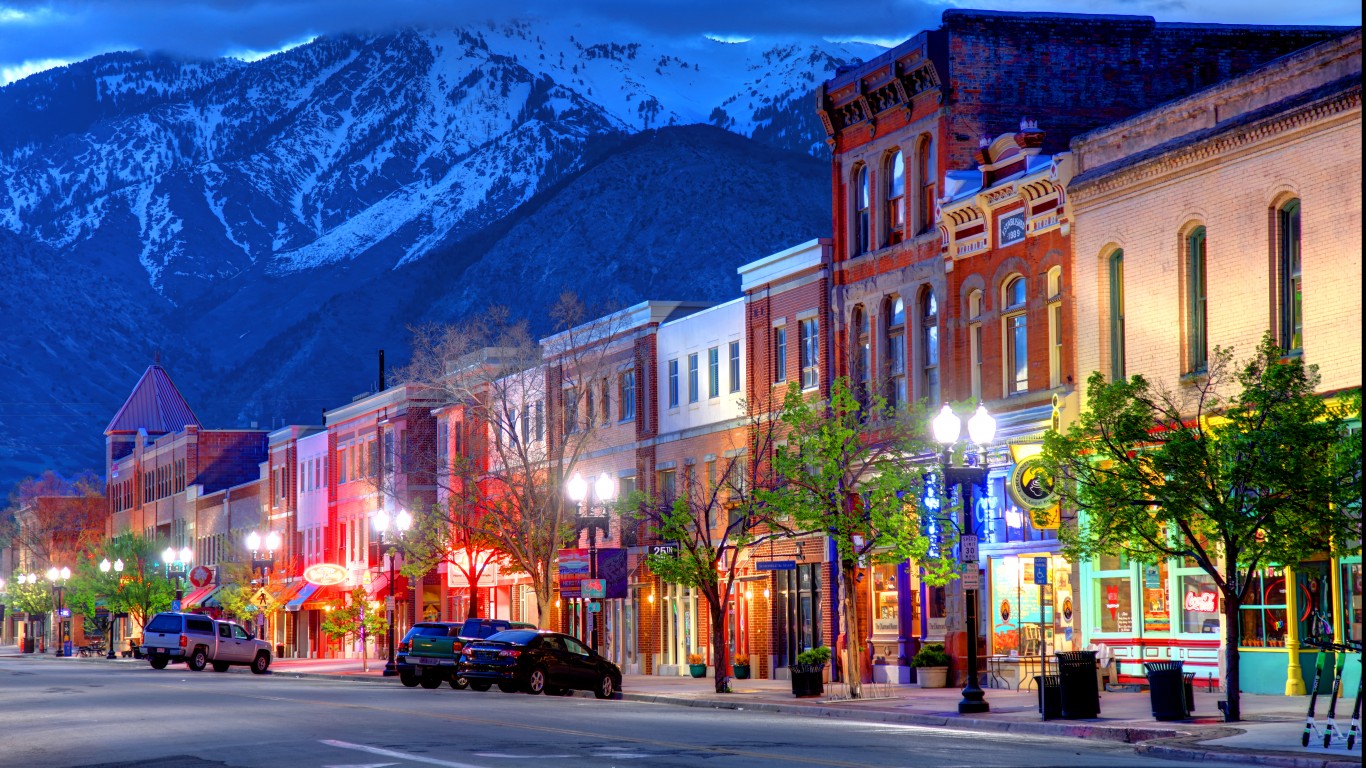
Utah: Ogden
> Avg. time lost to traffic delays in 2022: 14 hours per commuter
> Overall national ranking: tied – 110th worst of 280 U.S. cities considered
> Change in traffic delays from 2021: +31%
> Avg. commute time in city: 21 minutes (State avg.: 22 minutes)
> Commuters who drive or carpool to work: 36,096; 93.0% of commuters
> Cities considered in state: 5
Source: krblokhin / iStock Editorial via Getty Images
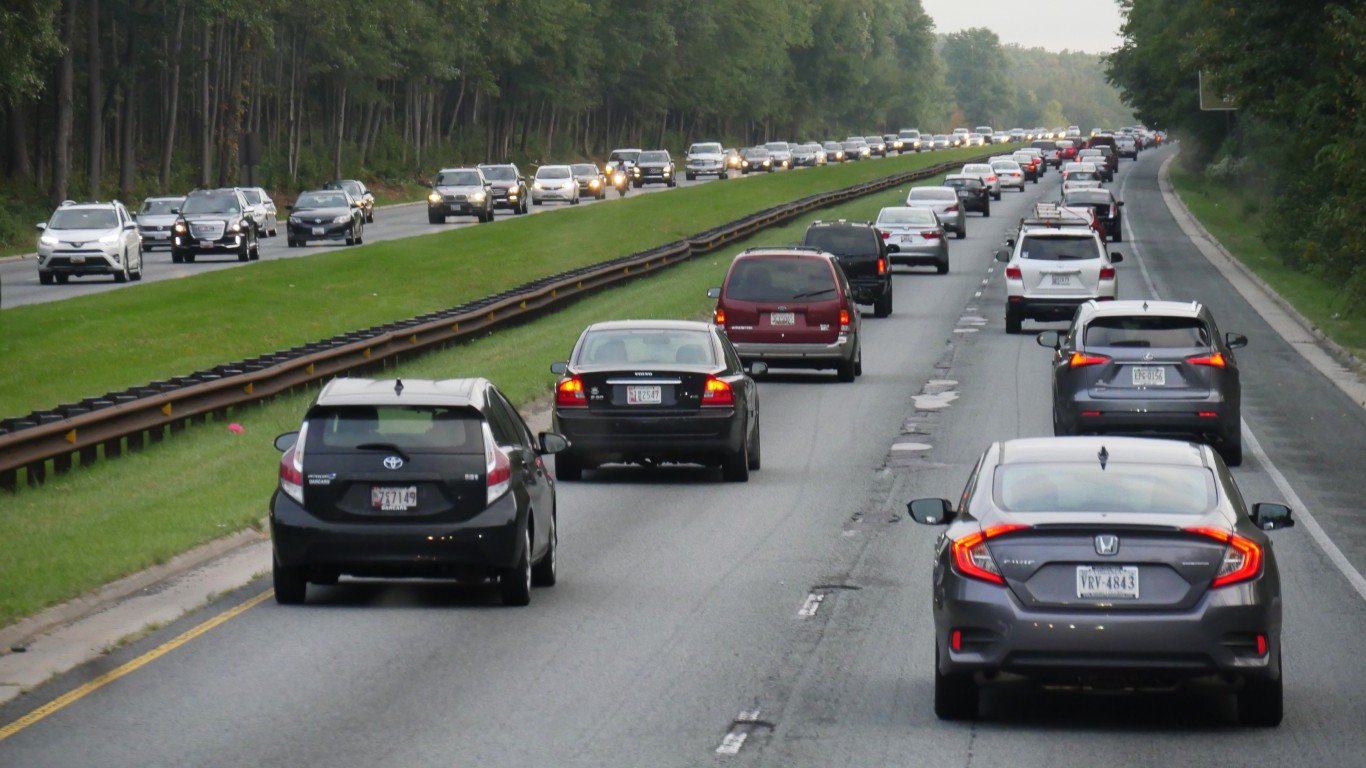
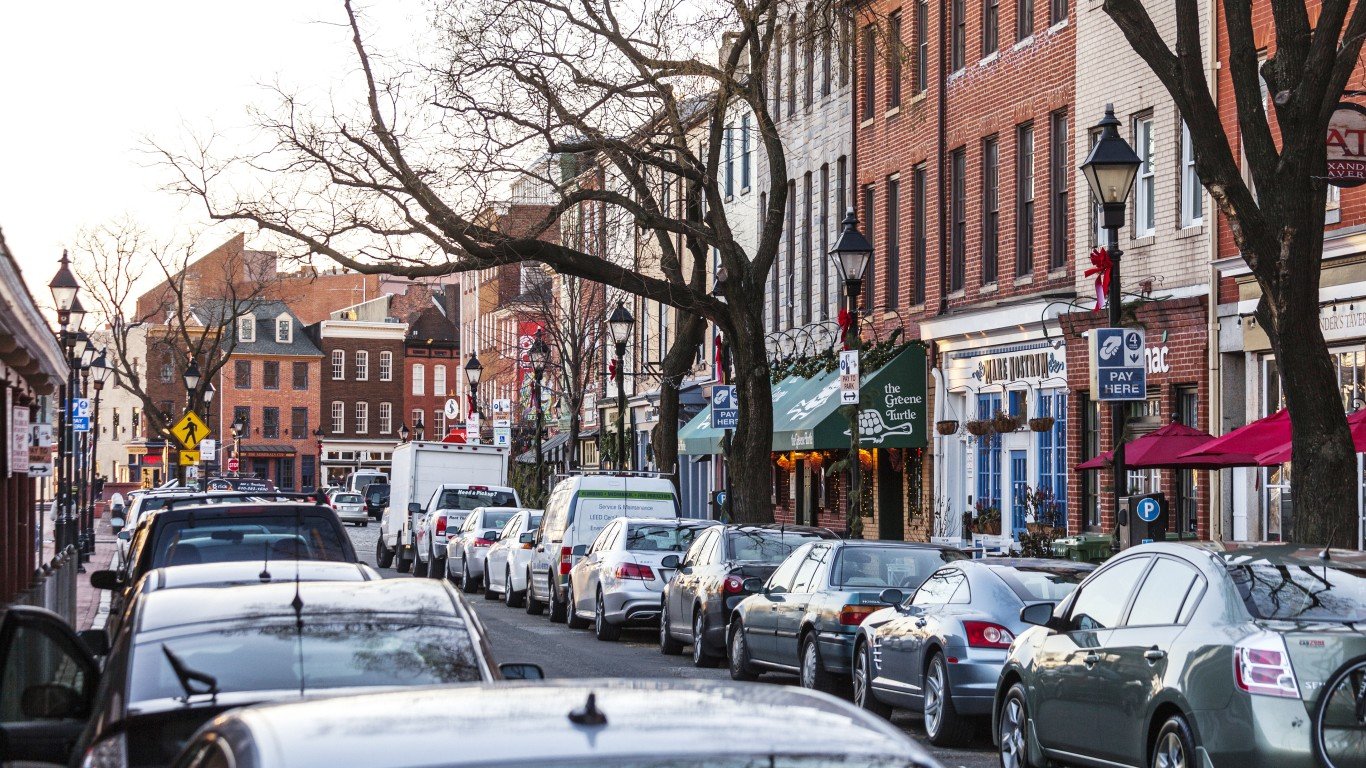
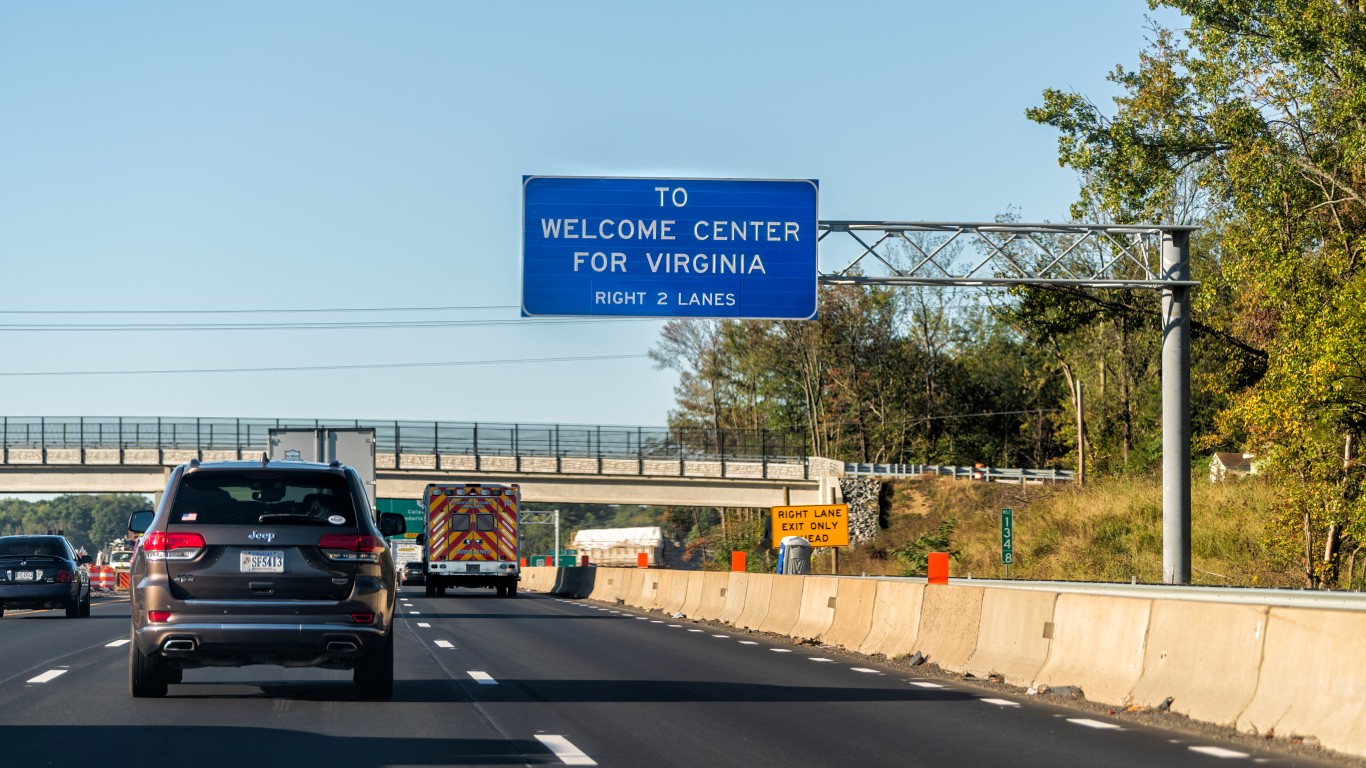
Virginia: Fredericksburg
> Avg. time lost to traffic delays in 2022: 24 hours per commuter
> Overall national ranking: tied – 46th worst of 280 U.S. cities considered
> Change in traffic delays from 2021: +9%
> Avg. commute time in city: 30 minutes (State avg.: 28 minutes)
> Commuters who drive or carpool to work: 12,106; 87.6% of commuters
> Cities considered in state: 11
[in-text-ad-2]
Source: peeterv / iStock via Getty Images
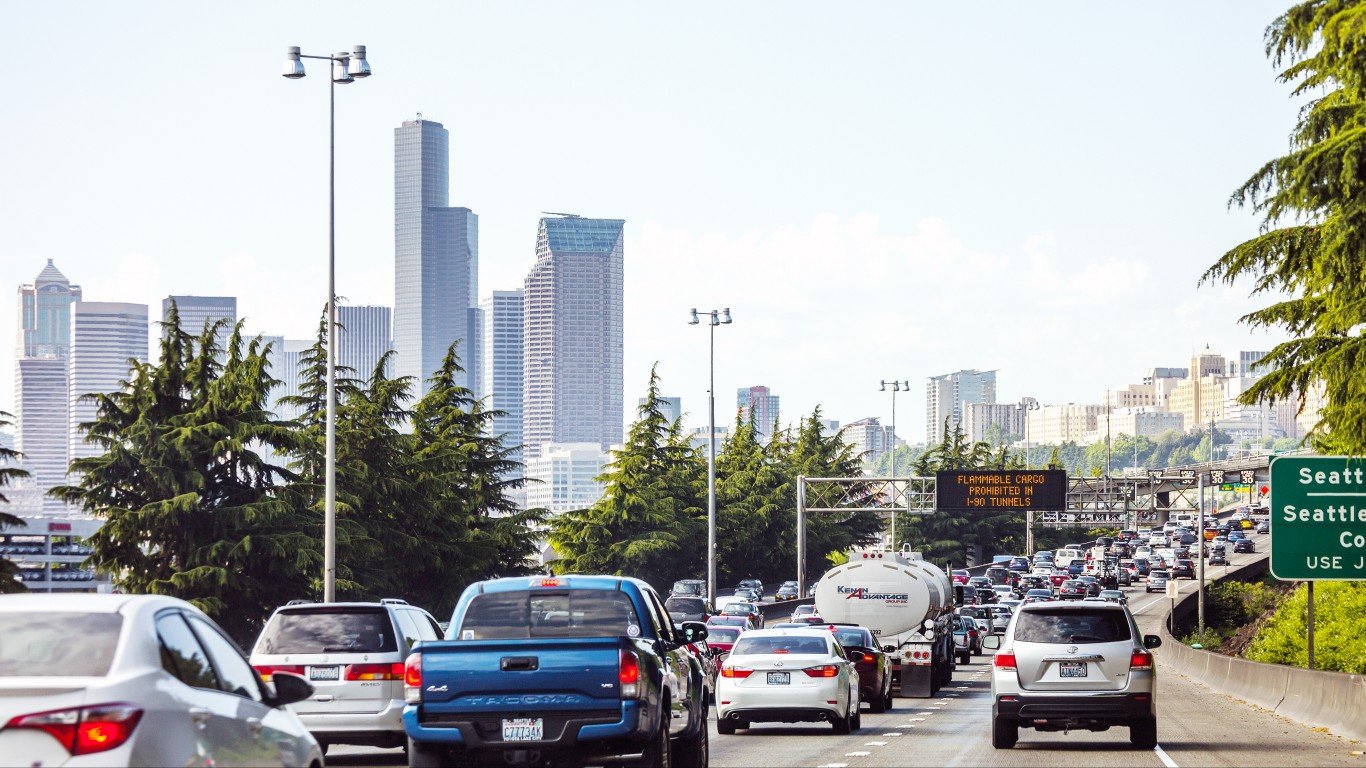
Washington: Seattle
> Avg. time lost to traffic delays in 2022: 46 hours per commuter
> Overall national ranking: 20th worst of 280 U.S. cities considered
> Change in traffic delays from 2021: +52%
> Avg. commute time in city: 28 minutes (State avg.: 28 minutes)
> Commuters who drive or carpool to work: 204,468; 59.4% of commuters
> Cities considered in state: 7
Source: ChrisBoswell / iStock via Getty Images
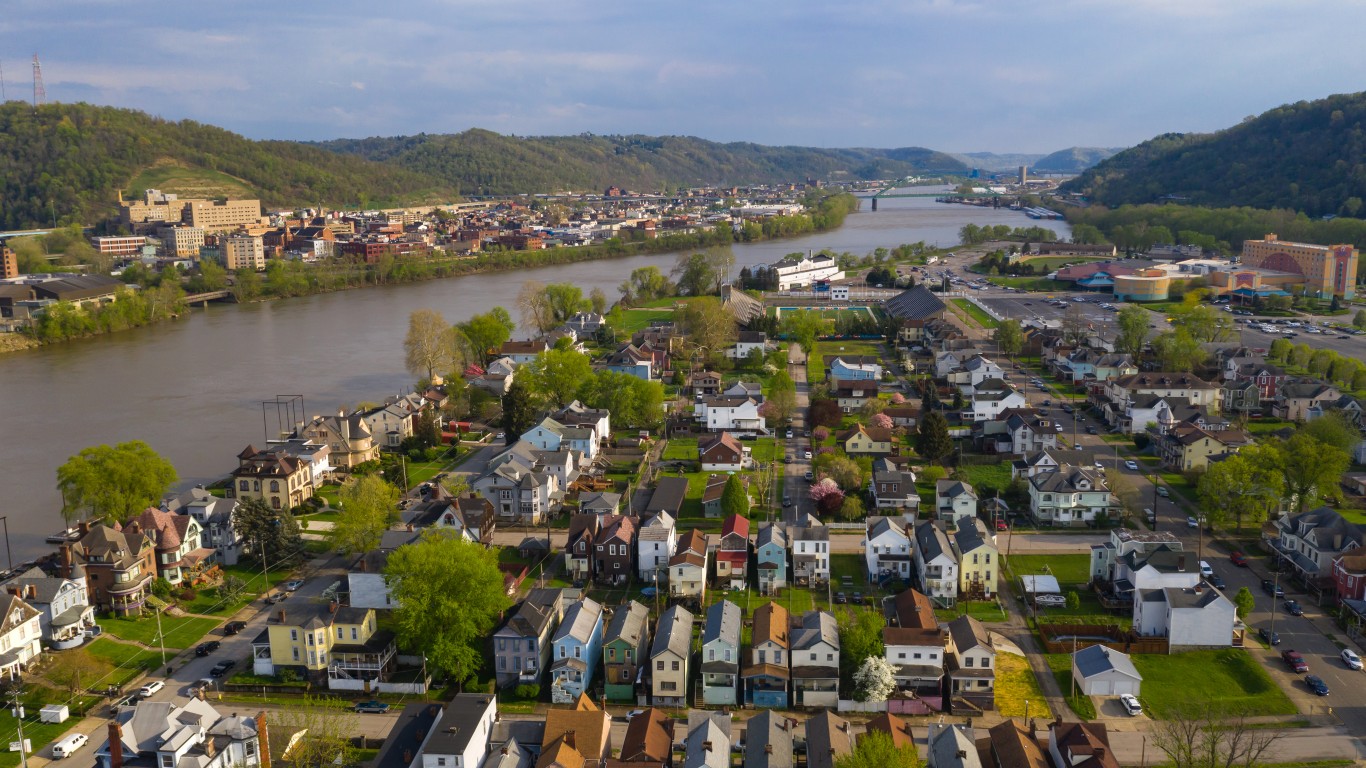
West Virginia: Wheeling
> Avg. time lost to traffic delays in 2022: 12 hours per commuter
> Overall national ranking: tied – 143rd worst of 280 U.S. cities considered
> Change in traffic delays from 2021: +33%
> Avg. commute time in city: 19 minutes (State avg.: 26 minutes)
> Commuters who drive or carpool to work: 9,738; 92.8% of commuters
> Cities considered in state: 2
[in-text-ad]
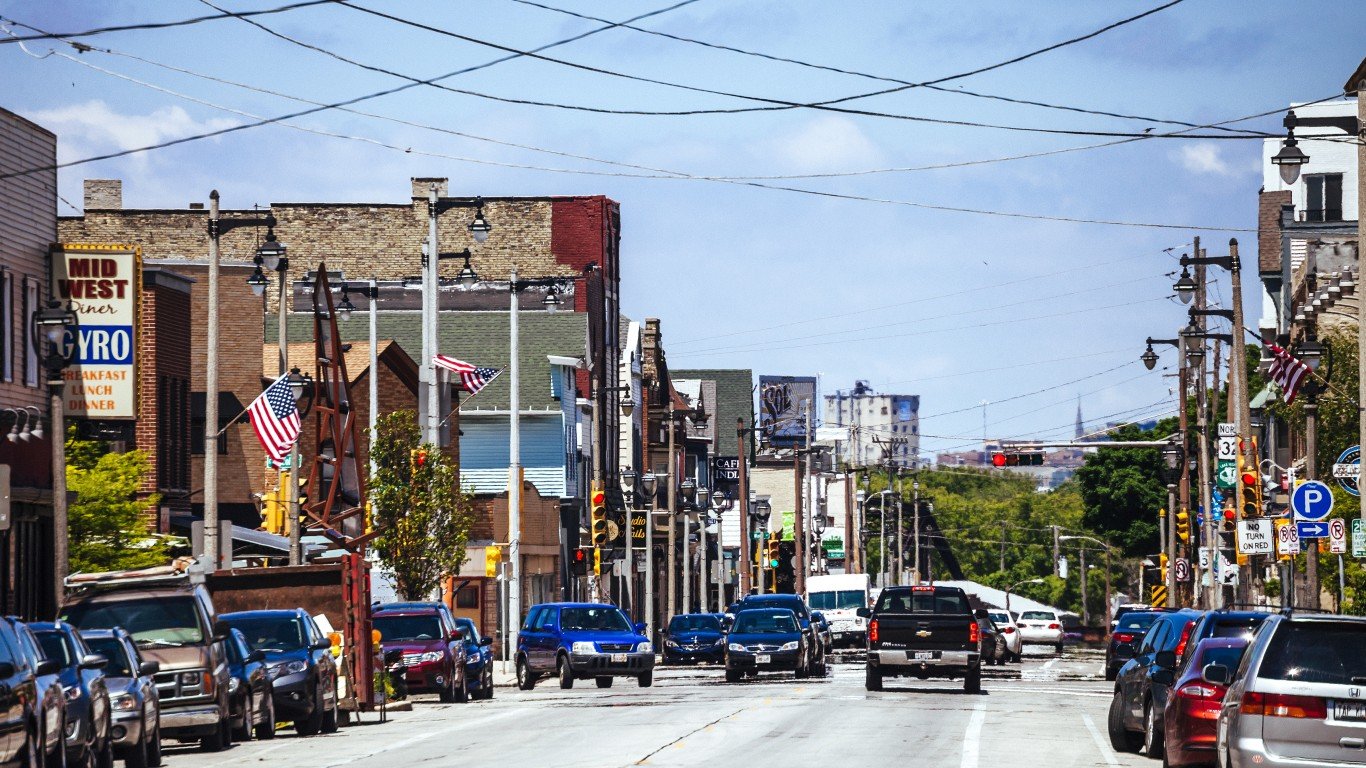
Source: peeterv / iStock via Getty Images
Wisconsin: Milwaukee
> Avg. time lost to traffic delays in 2022: 32 hours per commuter
> Overall national ranking: tied – 27th worst of 280 U.S. cities considered
> Change in traffic delays from 2021: +47%
> Avg. commute time in city: 22 minutes (State avg.: 22 minutes)
> Commuters who drive or carpool to work: 210,005; 87.5% of commuters
> Cities considered in state: 6
Methodology
To identify the city with the worst traffic in every state, 24/7 Wall St. reviewed data from the 2022 Global Traffic Scorecard, from INRIX, a traffic data and analytics company. We used the average time the typical commuter lost to traffic congestion in 2022 in the 280 U.S. cities with available data. Within each state, we identified the city with the most time lost to traffic congestion.
Due to a lack of data, Alaska, South Dakota, Vermont and Wyomingis not included on this list. We did include Washington, D.C., however, which is one of six states or districts that is home to only one city with available data. In these places, which are noted, the city listed ranks as having the worst traffic by default.
Supplementary data on average commute time for those not working from home and the number and share of commuters who drive or carpool to work are five year estimates from the U.S. Census Bureau’s 2021 American Community Survey. Due to a lack of ACS data at the city level for Ocean Township, New Jersey, we used data for Monmouth County, which is where Ocean Township is located.
Data on change in the average traffic delays from 2021 is also from INRIX.
Sponsored: Want to Retire Early? Here’s a Great First Step
Want retirement to come a few years earlier than you’d planned? Or are you ready to retire now, but want an extra set of eyes on your finances?
Now you can speak with up to 3 financial experts in your area for FREE. By simply clicking here you can begin to match with financial professionals who can help you build your plan to retire early. And the best part? The first conversation with them is free.
Click here to match with up to 3 financial pros who would be excited to help you make financial decisions.
Thank you for reading! Have some feedback for us?
Contact the 24/7 Wall St. editorial team.
Editors' Picks