Philando Castille. Breonna Taylor. George Floyd. Tyre Nichols. These are just four of the better-known Black American victims of police violence out of many mostly forgotten names who have been killed by members of U.S. law enforcement over the decades.
The May 25, 2020, murder of George Floyd under the knee of former officer Derek Chauvin, now serving 22.5 years for his crime, elicited Black Lives Matter protests nationwide, some of which became chaotic, but were mostly peaceful.
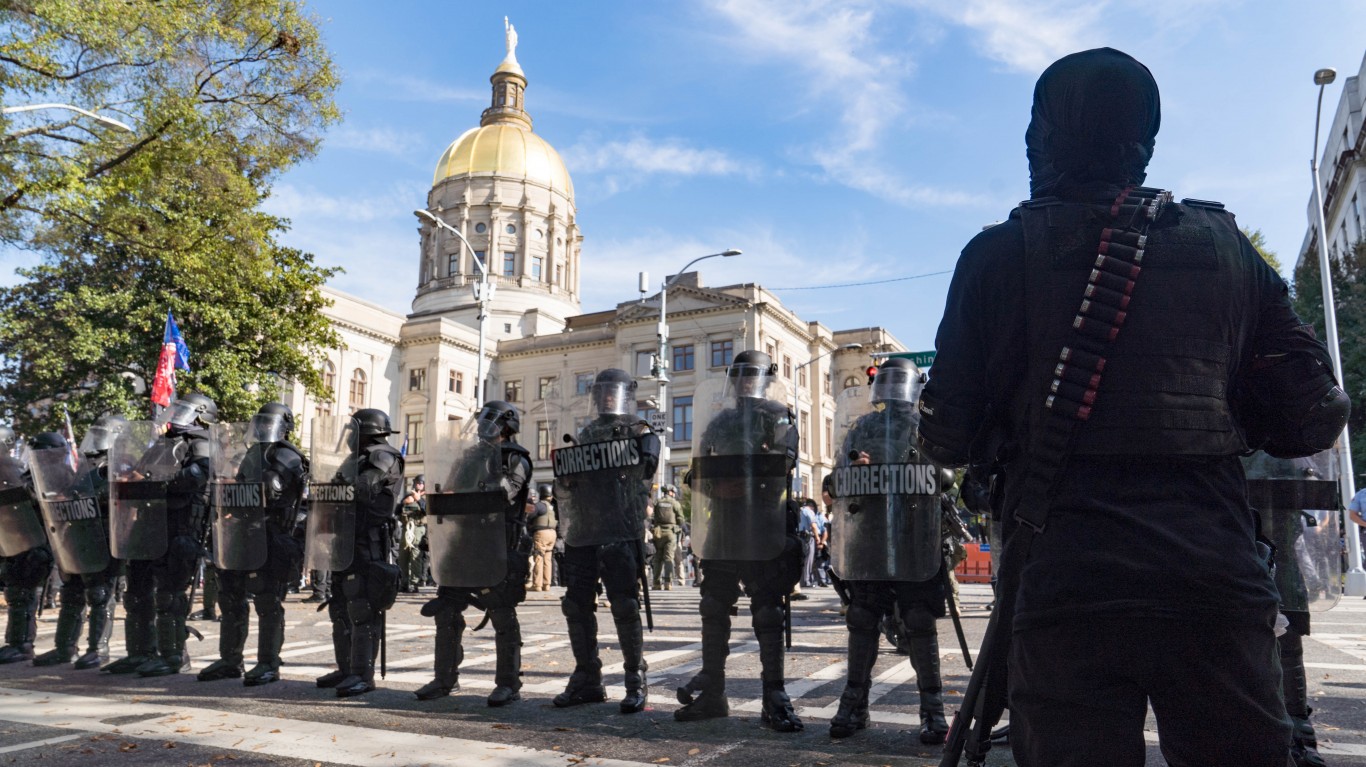
Police in some of the largest cities exhibited the very problem underscored by the BLM movement: they aggressively overreacted to the protests. Some officers were ordered to launch tear gas and dangerous “non-lethal” projectiles into crowds and hemming protesters into small areas, a potentially dangerous tactic known as “kettling.” Outside investigators blamed a lack of proper training for these incidents. (These are the most militarized local police departments in America.)
Police use of excessive force can lead to injury and death. To determine the police departments with the most killings, 24/7 Wall St. reviewed data from Mapping Police Violence, a research collaborative that collects data on police killings across the nation from the country’s three largest comprehensive and impartial crowdsourced databases. Data was accessed on Feb. 22, 2023, and includes all police department killings from 2013 through the end of 2022.
Over the most recent decade, at least 1,994 people have been reported killed by U.S. law enforcement in the 30 deadliest police agencies in America, including Los Angeles and its surrounding county, Phoenix, New York City, Houston, and Chicago. (New York City has far and away the largest police department in the U.S.)
In some cases, the killed suspects were armed or were involved in criminal activity that led officers to believe they, their fellow officers, or others were in danger – an understandable situation in a nation awash with over 400 million civilian firearms.
But in all too many cases, these police-shooting victims were unarmed, were not involved in criminal activity, were committing nonviolent misdemeanors, or were suffering mental breakdowns in states that have underfunded mental health care – a problem that the Harvard Political Review said in 2020 has turned correctional facilities into “de facto mental health hospitals.” Many victims of police shootings have been minors. Disproportionately, they have been Black or Hispanic.
Some of the highest profile killings of Black Americans, like Ahmad Arbery, Breonna Taylor, and George Floyd, were committed by officers of police agencies that are not among the country’s deadliest, suggesting just how systemic the use of unjustified deadly police force is being used against people of color, particularly Black Americans, even in police agencies with better overall records. Most police face little or no administrative repercussions for these killings. In cases that do go to trial, juries tend to give police officers the benefit of the doubt.
Though most police never fire their weapons, shooting is only one method by which suspects are killed. The use of so-called lateral vascular neck restraint (aka a chokehold, usually as the suspect is lying face down on the ground) is a common way that suspects die during police encounters. In numerous instances of police killings, the suspect is heard on body cam footage pleading “I can’t breathe” moments before they die, which has turned the phrase into a BLM slogan against police violence.
Here are the deadliest US police departments.
Click here to see our detailed methodology.
Source: Michael B. Thomas / Getty Images
30. Tulsa Police Department
> Documented police killings (2013-2022): 36 (12.2% of state killings)
> Worst year for documented killings (2013-2022): 2016: 8
> % of those killed who were Black: 23.5% (total: 8)
> % of those killed who did not have a gun: 54.3% (total: 19)
> % of those killed who were fleeing: 25.0% (total: 7)
> % of cases officer was disciplined or charged with a crime: 7.7% (total: 2)
In January 2020, Tulsa Mayor G.T. Bynum selected Maj. Wendell Franklin to become the city’s first Black police chief. Franklin’s promotion came months after the U.S. Justice Department announced it would not pursue federal charges against a former police officer who fatally shot Terence Crutcher, a 40-year-old unarmed Black motorist, during a routine traffic stop.
Franklin had previously served several years commanding operations in the historically Black part of north Tulsa, not far from the Greenwood District that was reduced to smoking rubble by an angry white mob that murdered hundreds of Black Tulsans during the 1921 Tulsa Race Massacre. Five months after Franklin’s promotion, Bynum condemned the use of excessive force by police against two Black teens who were jaywalking, questioning whether the same policing would have been used in “other communities.”
[in-text-ad]

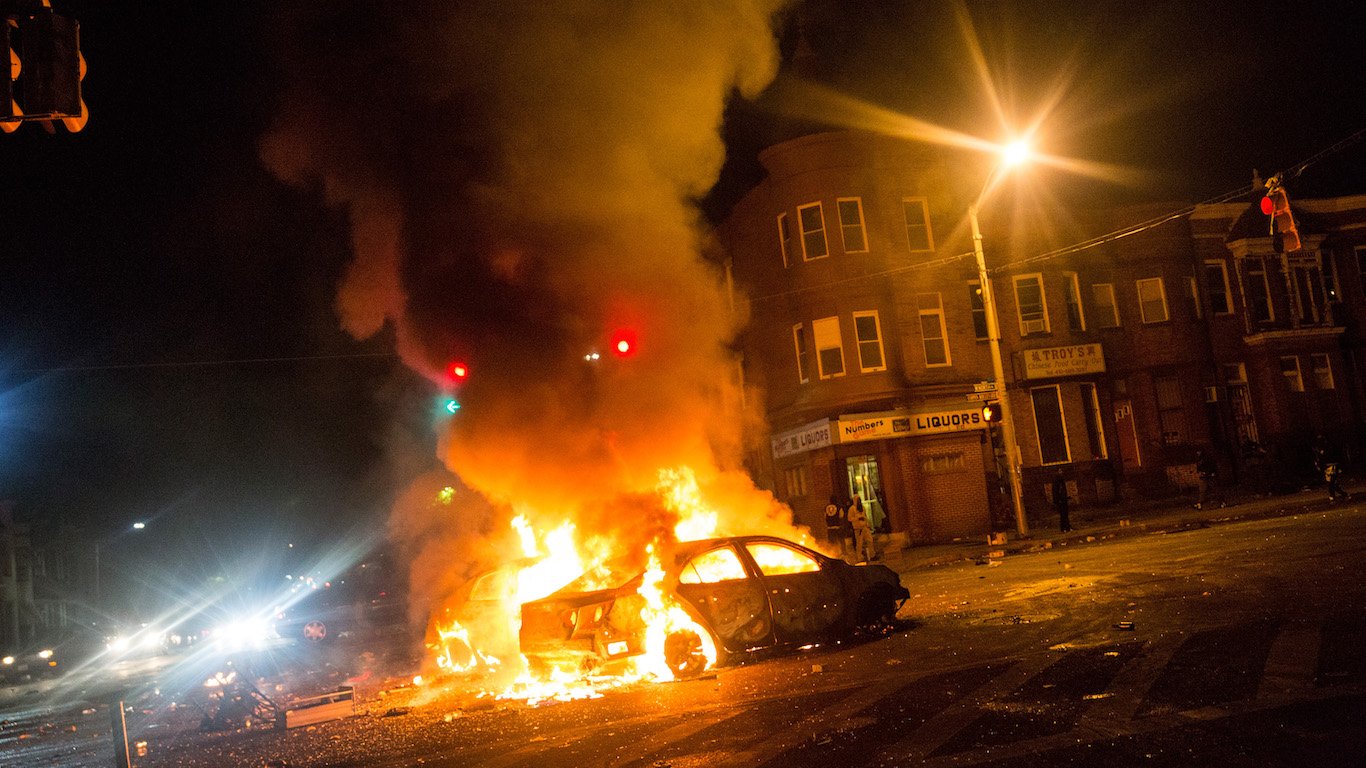
29. Baltimore Police Department
> Documented police killings (2013-2022): 40 (22.5% of state killings)
> Worst year for documented killings (2013-2022): 2013: 9
> % of those killed who were Black: 89.7% (total: 35)
> % of those killed who did not have a gun: 40.0% (total: 16)
> % of those killed who were fleeing: 21.7% (total: 5)
> % of cases officer was disciplined or charged with a crime: 3.7% (total: 1)
In 2017, the City of Baltimore approved a $300,000 settlement with the family of Anthony Anderson, 46, who was killed in 2012 after an officer deployed a fatal takedown maneuver for allegedly trying to swallow drugs in his possession. It was the largest settlement since the $6.4 million payout to the family of Freddie Gray, 25, who in 2015 sustained a fatal spinal injury in the back of a police van while shackled, an incident the state attorney ruled a homicide. The U.S. Justice Department denounced the BPD in 2016 for making unjustified encounters, subjecting “African Americans to disproportionate rates of stops, searches and arrests.”
 24/7 Wall St.
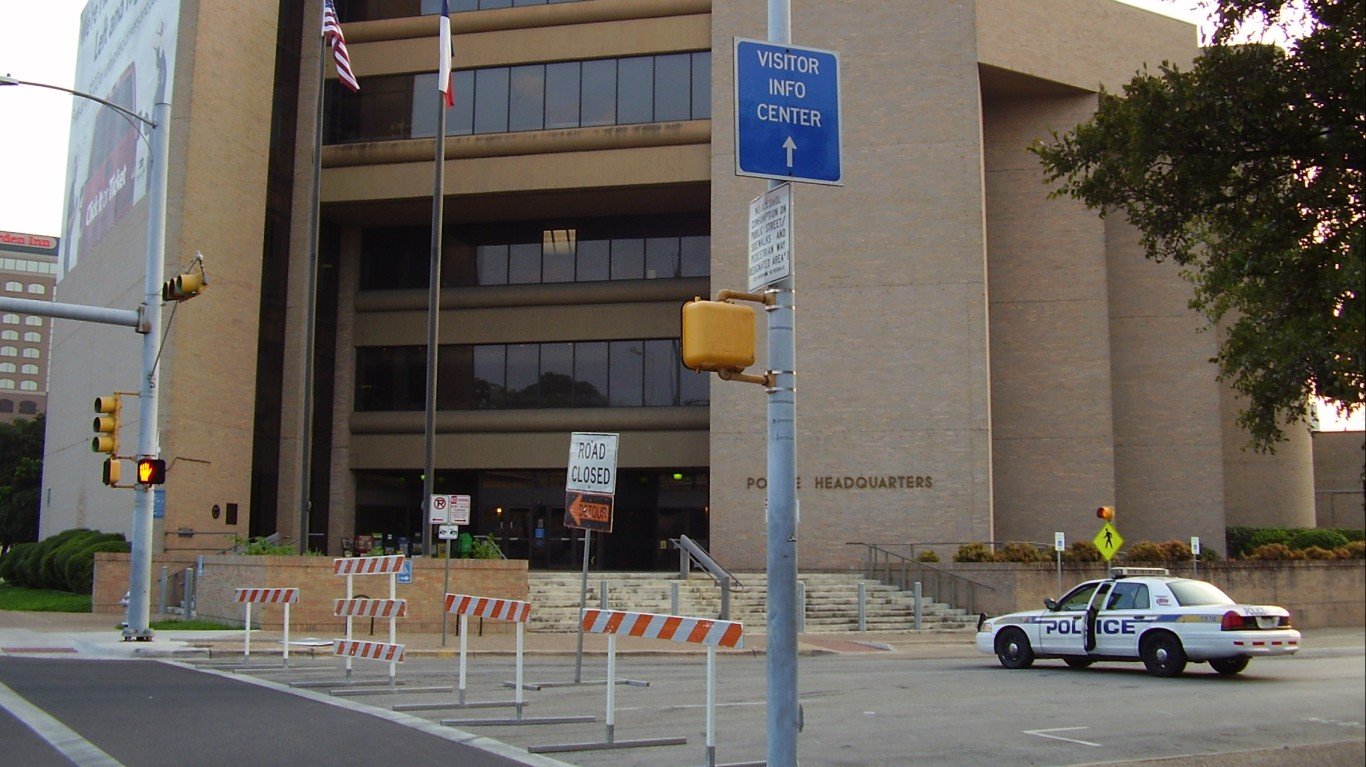
Source: Public Domain / Wikimedia Commons
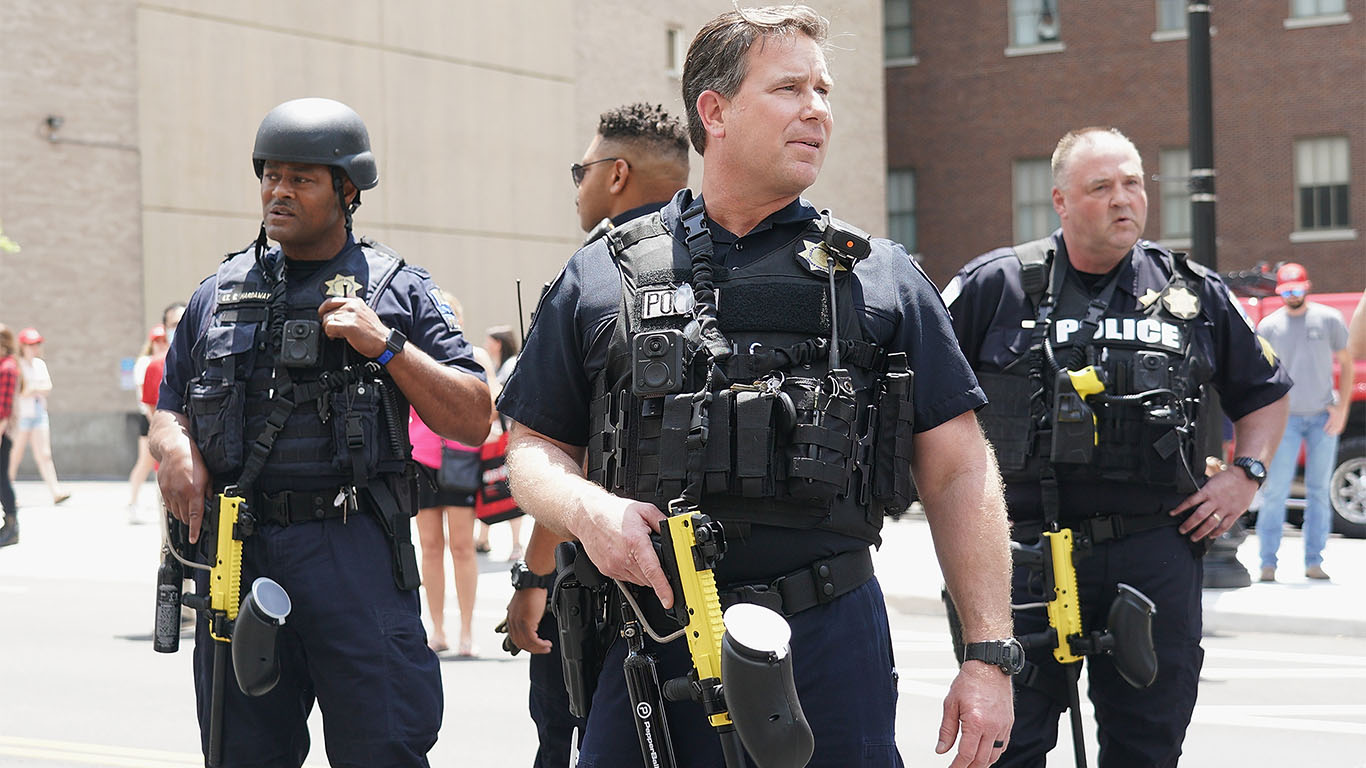
28. Austin Police Department
> Documented police killings (2013-2022): 41 (3.9% of state killings)
> Worst year for documented killings (2013-2022): tied — 2015, 2018: 6
> % of those killed who were Black: 17.9% (total: 7)
> % of those killed who did not have a gun: 41.5% (total: 17)
> % of those killed who were fleeing: 33.3% (total: 11)
> % of cases officer was disciplined or charged with a crime: 13.8% (total: 4)
In February, Austin settled a lawsuit by agreeing to pay $3.3 million for the fatal shooting of Landon Nobles, 24, by two bicycle cops who had heard gunfire in a crowd. A jury dismissed the officers’ claims that Nobles pointed a gun he was carrying at them, initially awarding $67 million to the family, an amount that was later reduced. On the same day the settlement was announced, the Austin City Council also approved payouts to three people who were significantly injured by police during 2020 protests in the wake of the George Floyd murder. Police officers used “less fatal” bean bag ammo at protesters, hospitalizing 19 people.
Source: shakzu / iStock Editorial via Getty Images
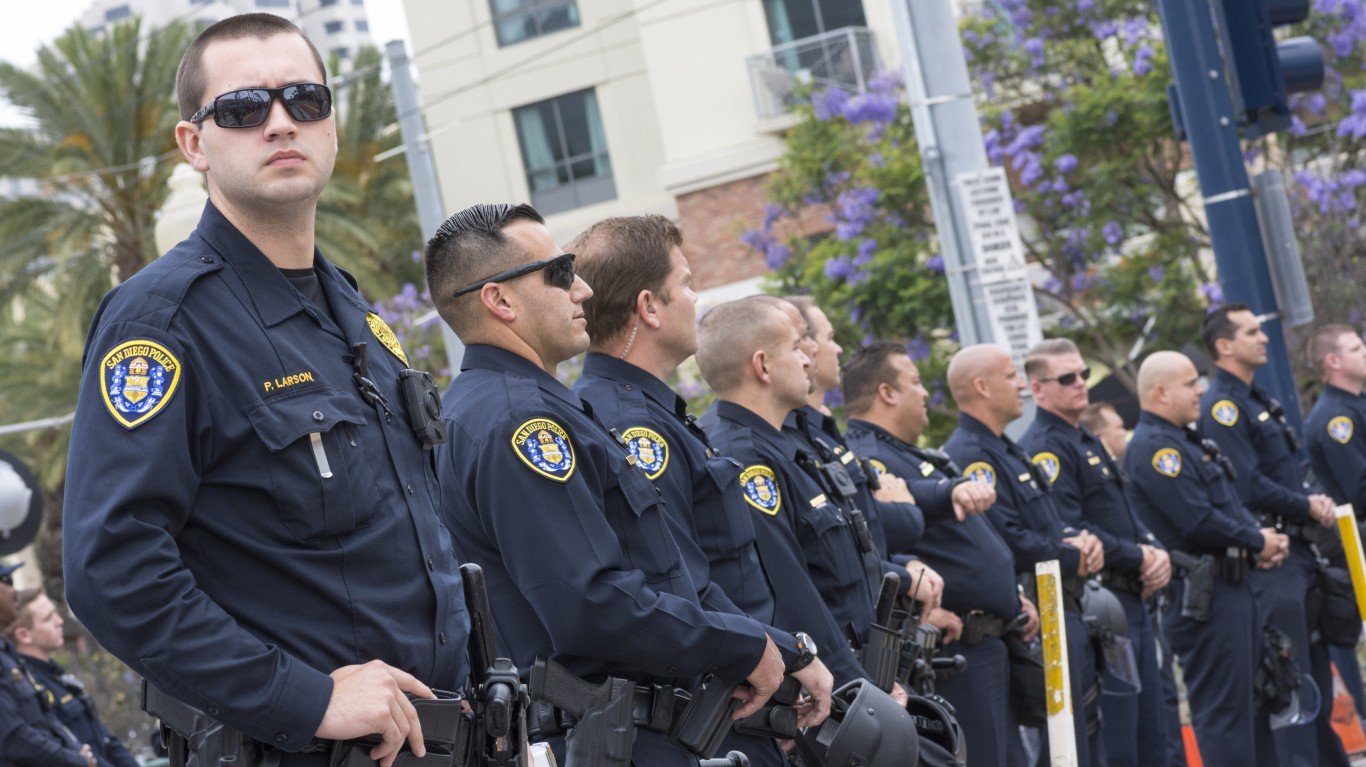
27. San Diego Police Department
> Documented police killings (2013-2022): 42 (2.5% of state killings)
> Worst year for documented killings (2013-2022): 2015: 7
> % of those killed who were Black: 7.7% (total: 3)
> % of those killed who did not have a gun: 61.9% (total: 26)
> % of those killed who were fleeing: 28.6% (total: 8)
> % of cases officer was disciplined or charged with a crime: 0.0% (total: 0)
In 2019, a reporting project by more than 30 newsrooms statewide found that hundreds of California police officers who had been convicted of crimes over the past decade not only dodged jail time but also often kept their jobs, including officers in San Diego County. According to the nonprofit Police Scorecard project, the San Diego Police Department has low marks for the use of excessive force and for the low rate of upholding civilian complaints of excessive force, discrimination, and criminal misconduct.
[in-text-ad-2]

26. Kansas City Police Department
> Documented police killings (2013-2022): 43 — tied (14.6% of state killings)
> Worst year for documented killings (2013-2022): tied — 2018, 2020: 7
> % of those killed who were Black: 65.7% (total: 23)
> % of those killed who did not have a gun: 23.8% (total: 10)
> % of those killed who were fleeing: 26.9% (total: 7)
> % of cases officer was disciplined or charged with a crime: 3.4% (total: 1)
In one of many examples of the high fiscal cost a U.S. city can pay for police misconduct, Kansas City settled in November 2022 with the family of Terrence Bridges Jr., agreeing to pay $5 million for the fatal shooting in 2019 of the 30-year-old unarmed Black carjacking suspect who was not involved in the crime.
The Kansas City Police Department has one of the most dismal ratings by the nonprofit Police Scorecard Project, with an overall score of just 26%, earning failing scores in most categories, including unjustified deadly force and upholding almost none of the more than 2,600 civilian complaints directed at officers for excessive force and discrimination. Local activists have criticized the KCPD for opting to settle police brutality lawsuits rather than pursuing structural reform in the city of 500,000 people.
Source: Public Domain / Wikimedia Commons
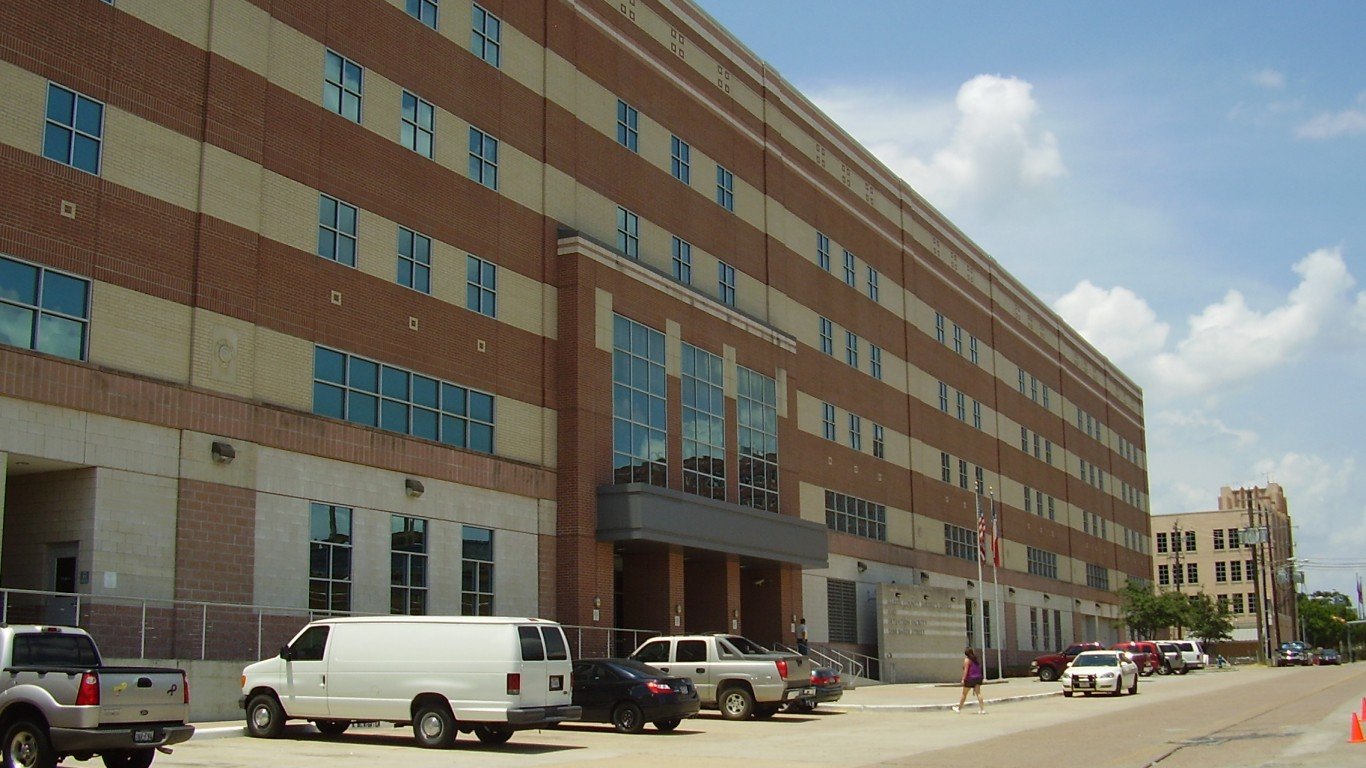
25. Harris County Sheriff’s Office
> Documented police killings (2013-2022): 43 — tied (4.1% of state killings)
> Worst year for documented killings (2013-2022): 2018: 6
> % of those killed who were Black: 37.5% (total: 15)
> % of those killed who did not have a gun: 48.8% (total: 20)
> % of those killed who were fleeing: 50.0% (total: 14)
> % of cases officer was disciplined or charged with a crime: 3.6% (total: 1)
The Harris County Sheriff’s Department is responsible for patrolling the Houston exurbs while Houston, the fourth most-populous city in the country, is policed by its large municipal police department. Both are listed among the deadliest police agencies in the country. Black targets of unjustified deadly force by county officers in recent years include Roderick Brooks, 47 and unarmed, gunned down in 2022 for allegedly shoplifting at a Dollar Store, and Danny Ray Thomas, 34 and unarmed, fatally shot in 2018 while having a mental breakdown.
[in-text-ad]
Source: Scott Olson / Getty Images News via Getty Images
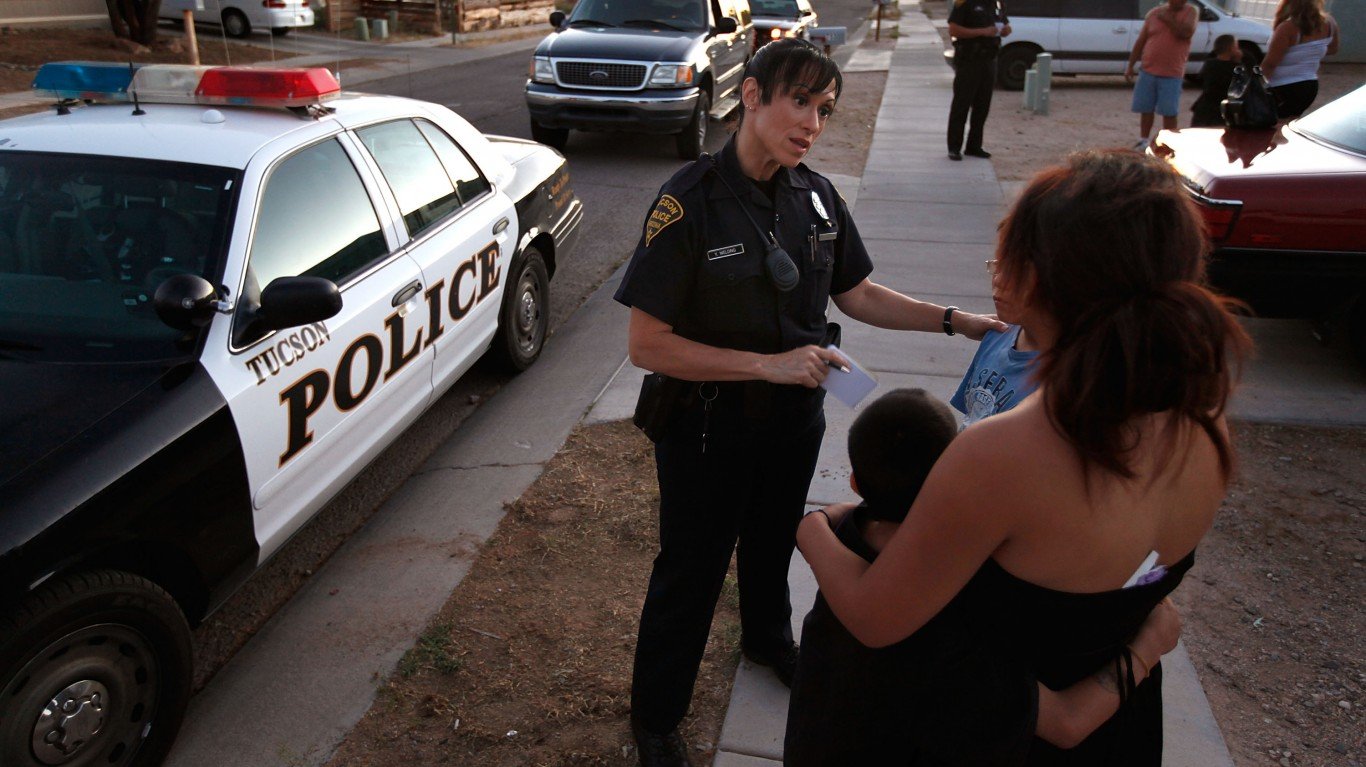
24. Tucson Police Department
> Documented police killings (2013-2022): 45 — tied (9.1% of state killings)
> Worst year for documented killings (2013-2022): tied — 2021, 2022: 6
> % of those killed who were Black: 14.3% (total: 5)
> % of those killed who did not have a gun: 36.4% (total: 16)
> % of those killed who were fleeing: 17.9% (total: 5)
> % of cases officer was disciplined or charged with a crime: 7.7% (total: 2)
Seven of the 10 largest U.S. states by population have at least one police agency that ranks among the country’s deadliest. (The three most-populous states that are not on this list are Michigan, Georgia, and North Carolina.) Among the 40 smaller states, three stand out because their two largest police agencies are included in this list: Oklahoma, Missouri, and Arizona.
Though Tucson police officers have killed a third of the number of suspects as Phoenix cops, the city’s population is about a third smaller. This means that on a per-capita basis, Tucson and Phoenix (the second-deadliest U.S. city in terms of the number of police killings, listed below) are about on par with each other when it comes to police killings relative to the share of the population.
Source: typhoonski / iStock Editorial via Getty Images
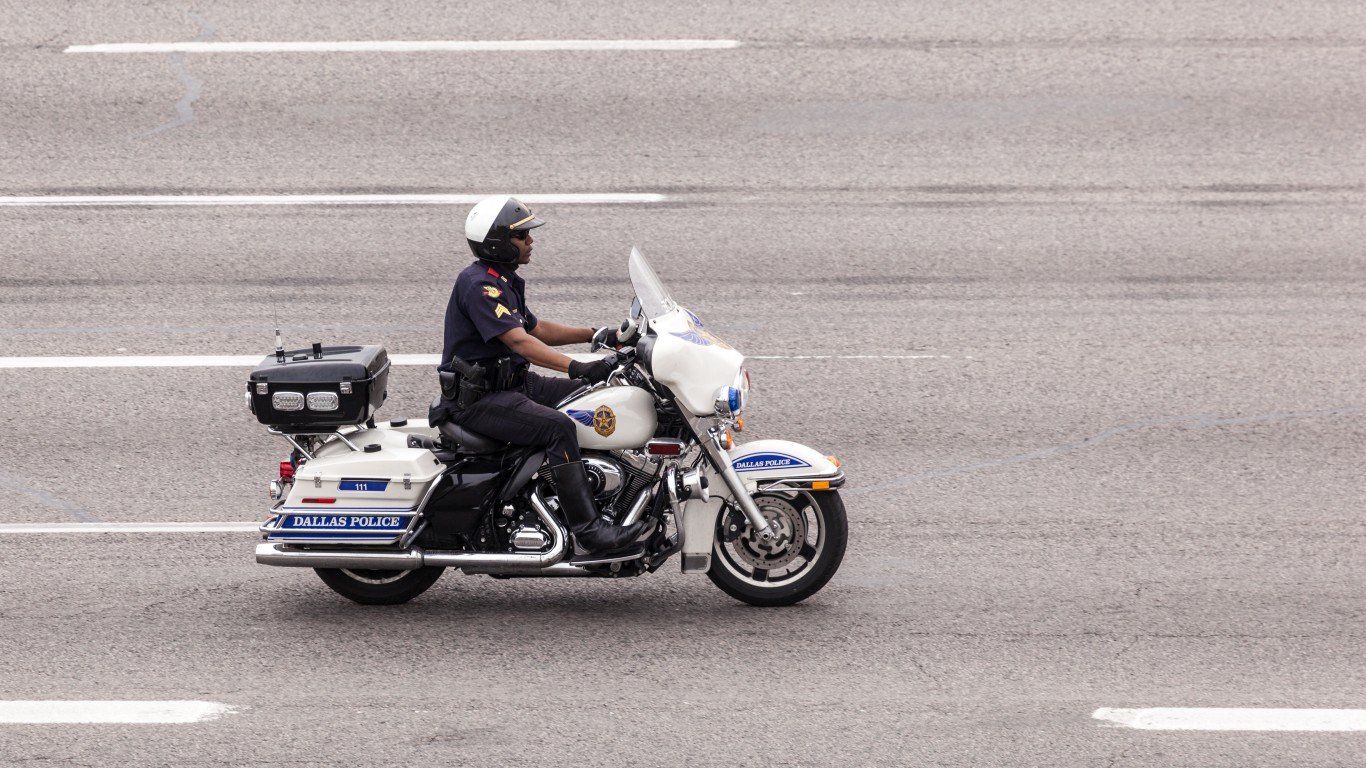
23. Dallas Police Department
> Documented police killings (2013-2022): 45 — tied (4.3% of state killings)
> Worst year for documented killings (2013-2022): 2014: 10
> % of those killed who were Black: 44.2% (total: 19)
> % of those killed who did not have a gun: 38.6% (total: 17)
> % of those killed who were fleeing: 18.2% (total: 4)
> % of cases officer was disciplined or charged with a crime: 13.8% (total: 4)
Dallas is home to one of five Texas police agencies that rank among the nation’s deadliest. One of the most high-profile police killings in Dallas occurred on Sept. 6, 2018, when off-duty officer Amber Guyger accidentally entered the apartment of neighbor Botham Jean, a 26-year-old Black accountant, and, mistaking him for a burglar, gunned him down. Guyger was convicted for murder, making her one of the few U.S. police officers convicted and imprisoned for the unjustified killing of a suspect.
Two years earlier, Micah Javier Johnson, angry about police killing of Black men, ambushed and gunned down five Dallas officers and injured nine others. The DPD used a bomb disposal robot armed with an explosive device to kill Johnson. It is believed to be the first time a robot was used by U.S. police in this manner.
Source: Ericbvd / iStock Editorial via Getty Images
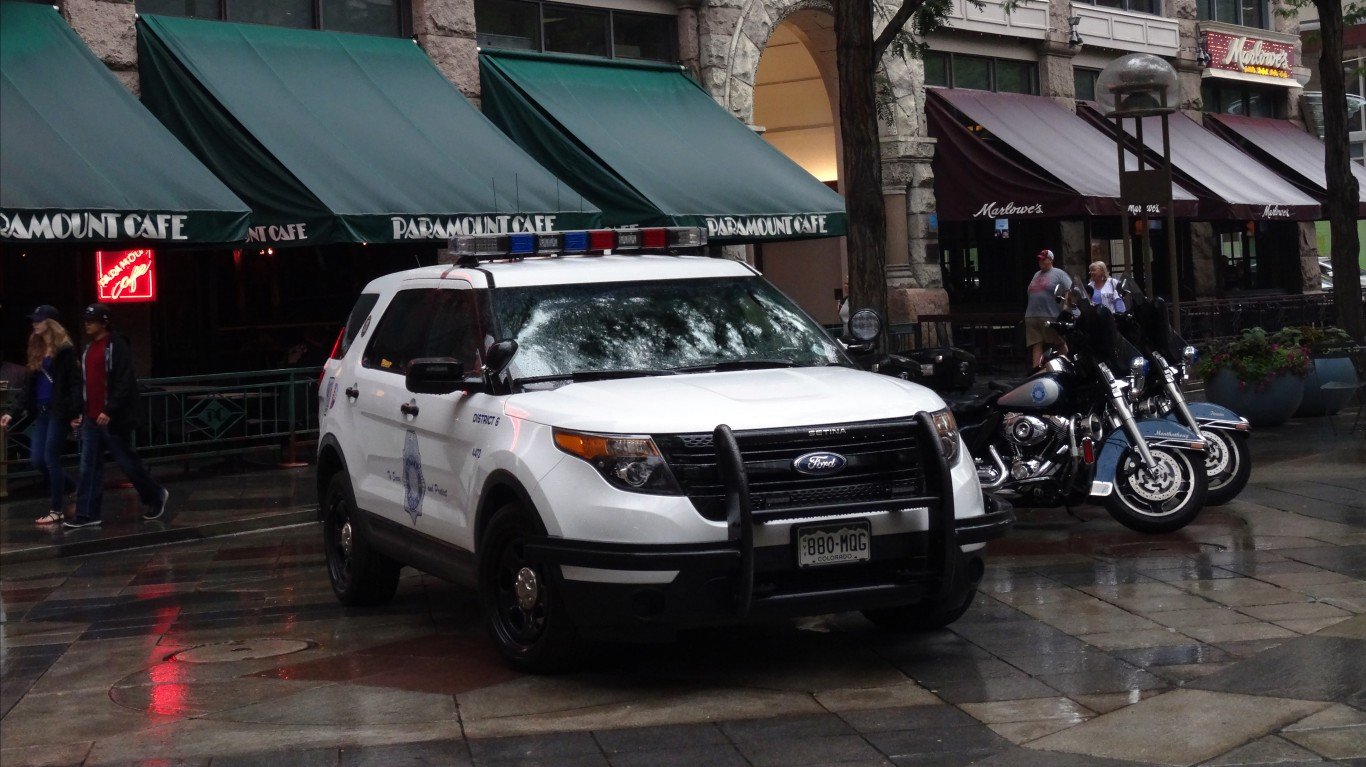
22. Denver Police Department
> Documented police killings (2013-2022): 45 — tied (12.8% of state killings)
> Worst year for documented killings (2013-2022): 2020: 8
> % of those killed who were Black: 17.5% (total: 7)
> % of those killed who did not have a gun: 32.6% (total: 14)
> % of those killed who were fleeing: 48.6% (total: 17)
> % of cases officer was disciplined or charged with a crime: 0.0% (total: 0)
Like other police departments, the Denver Police Department was found to have “acted dangerously and anonymously” during the 2020 nationwide protests over the killing of George Floyd, according to the Office of the Independent Monitor, the local civilian oversight agency for the DPD and the adjoining sheriff’s department.
[in-text-ad-2]

21. Philadelphia Police Department
> Documented police killings (2013-2022): 46 — tied (18.8% of state killings)
> Worst year for documented killings (2013-2022): 2013: 10
> % of those killed who were Black: 82.4% (total: 28)
> % of those killed who did not have a gun: 37.8% (total: 17)
> % of those killed who were fleeing: 32.0% (total: 8)
> % of cases officer was disciplined or charged with a crime: 13.0% (total: 3)
The Philadelphia Police Department has a bad reputation. Its worst police officers receive a far greater number of civilian complaint citations than the most aggressive cops in other cities like Boston and Minneapolis. Use of excessive force included shooting 30-year-old David Jones in the back in 2017, an incident that resulted in the first charges against an on-duty police officer for killing a suspect in about two decades.
Protests, looting, and violent clashes erupted in Philadelphia following the May 25, 2020, police killing of George Floyd in Minneapolis. A 2021 report from the local office of the Comptroller concluded that Philadelphia Police Commissioner Danielle Outlaw used overly aggressive tactics, including the use of tear gas, during the demonstrations.

20. St. Louis Metropolitan Police Department
> Documented police killings (2013-2022): 46 — tied (15.6% of state killings)
> Worst year for documented killings (2013-2022): 2017: 10
> % of those killed who were Black: 90.5% (total: 38)
> % of those killed who did not have a gun: 25.0% (total: 11)
> % of those killed who were fleeing: 43.3% (total: 13)
> % of cases officer was disciplined or charged with a crime: 3.3% (total: 1)
On Aug. 9, 2014, unarmed 18-year-old Michael Brown was fatally shot at least six times, including twice in the head, by Officer Darren Wilson during an altercation between the officer and the Black suspect in the St. Louis suburb of Ferguson. The shooting sparked weeks of protests following the incident, as well as more protests when a jury acquitted Wilson months later. The public outcry reflected bottled up frustration and tensions over police brutality in St. Louis.
Skipping forward to 2022, three city police associations filed a lawsuit to block expansion of civilian oversight of the city’s police department. St. Louis is the smallest city on this list by population with about 290,000 residents.
[in-text-ad]

19. Columbus Division of Police
> Documented police killings (2013-2022): 46 — tied (14.8% of state killings)
> Worst year for documented killings (2013-2022): 2018: 9
> % of those killed who were Black: 73.3% (total: 33)
> % of those killed who did not have a gun: 39.0% (total: 16)
> % of those killed who were fleeing: 24.1% (total: 7)
> % of cases officer was disciplined or charged with a crime: 11.4% (total: 4)
Andre Hill, 47, is one of at least 46 people Columbus Division of Police officers killed in this 10-year period. The 47-year-old unarmed man was shot by an officer who allegedly mistook his mobile phone for a weapon. Officers were responding to a call about someone sitting in their SUV for an unusually long time. Hill was wearing a Black Lives Matter T-shirt when he was shot while he was leaving a friend’s house. He laid on the ground handcuffed and bled out minutes later.
The Police Scorecard project determined that the CPD has more police shootings per arrest than 99% of the more than 13,000 U.S. police agencies tracked by the nonprofit group.
 24/7 Wall St.
18. Albuquerque Police Department
> Documented police killings (2013-2022): 51 (22.9% of state killings)
> Worst year for documented killings (2013-2022): 2022: 11
> % of those killed who were Black: 13.3% (total: 6)
> % of those killed who did not have a gun: 32.7% (total: 16)
> % of those killed who were fleeing: 35.1% (total: 13)
> % of cases officer was disciplined or charged with a crime: 4.5% (total: 1)
With about 560,000 residents, Albuquerque had the second-highest rate of fatal police shootings per 100,000 residents among U.S. cities with populations higher than half a million people from 2015 to 2021, according to Washington Post and Census data analyzed by the Guardian newspaper.
Among the 51 people killed by APD officers was Keshawn Thomas, 22, who was gunned down by three police officers during a welfare check at a gas station. Thomas had a concealed carry permit and an unloaded gun in his car and a loaded magazine in his trunk. Thomas (who was Black and Hispanic) was killed despite being cooperative, informing officers of his weapon, and reportedly having respect for authority. The killing raised the issue of how police officers interact with people of color who are lawful gun owners.

17. Pennsylvania State Police
> Documented police killings (2013-2022): 52 (21.2% of state killings)
> Worst year for documented killings (2013-2022): 2018: 10
> % of those killed who were Black: 7.1% (total: 3)
> % of those killed who did not have a gun: 44.0% (total: 22)
> % of those killed who were fleeing: 36.4% (total: 12)
> % of cases officer was disciplined or charged with a crime: 0.0% (total: 0)
The Pennsylvania State Police is one of three state police or highway patrol agencies on this list. Deputies and troopers are usually less likely to kill suspects compared to city police officers because they tend to patrol large rural areas with low rates of violent crime.
In 2021, the New York Times profiled Pennsylvania Trooper Jay Splain, who shot and killed four suspects in separate encounters and was cleared of culpability each time. The PSP fought efforts in 2014 to release police records to the family of one of the victims. No PSP officer has even been prosecuted for use of fatal unjustified force. “That history aligns with a longstanding pattern across the country of little accountability for police officers’ use of deadly force,” the Times reported.
[in-text-ad-2]

Source: Courtesy of San Bernardino County Sheriff's Department via Facebook
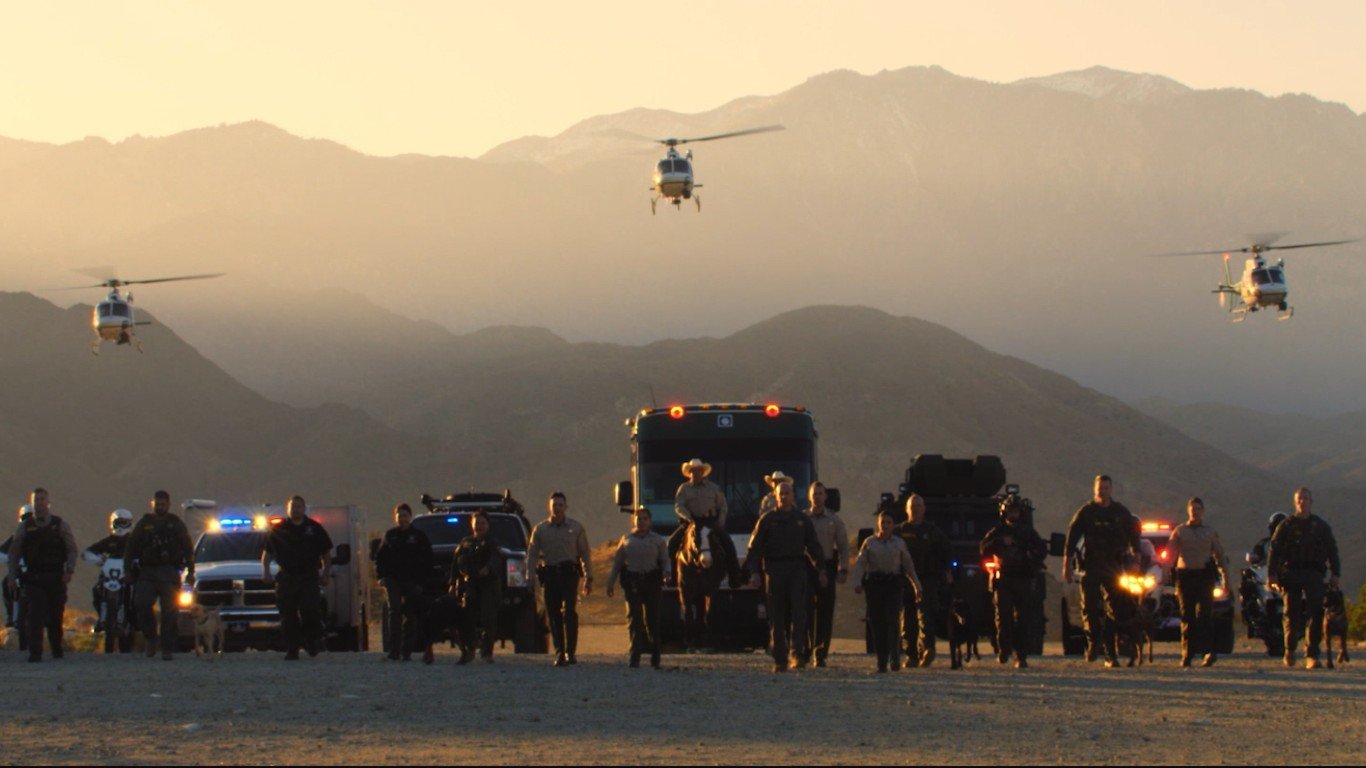
16. San Bernardino County Sheriff’s Department
> Documented police killings (2013-2022): 53 (3.2% of state killings)
> Worst year for documented killings (2013-2022): 2019: 11
> % of those killed who were Black: 19.0% (total: 8)
> % of those killed who did not have a gun: 62.3% (total: 33)
> % of those killed who were fleeing: 45.0% (total: 18)
> % of cases officer was disciplined or charged with a crime: 0.0% (total: 0)
Adjacent to Los Angeles County, San Bernardino County is the nation’s largest by landmass, and its deputies serve more than 2 million people. An investigation by KPCC public radio and the San Bernardino Sun found that at least 103 people were shot by deputies from 2010 to 2015, and that 27 of them were unarmed and 74 showed signs of drug or alcohol abuse. The report found that San Bernardino county deputies are more likely to shoot an unarmed suspect showing signs of substance abuse, and the rate at which they fire into moving cars was more than double the rate of L.A. County officers. The county’s Black population is small at about 175,000 people.
Source: Courtesy of Riverside County Sheriff's Department via Facebook
15. Riverside County Sheriff’s Department
> Documented police killings (2013-2022): 55 — tied (3.3% of state killings)
> Worst year for documented killings (2013-2022): tied — 2013, 2021: 7
> % of those killed who were Black: 12.2% (total: 5)
> % of those killed who did not have a gun: 58.8% (total: 30)
> % of those killed who were fleeing: 28.1% (total: 9)
> % of cases officer was disciplined or charged with a crime: 3.6% (total: 1)
Nestled below San Bernardino County and east of Orange County, Riverside County is home to 2.5 million people. About half of the residents are Hispanic. In 2021, civil rights groups called on the state’s attorney general to investigate the RCSD for what they called racist policies that have led to nearly as many fatal shootings as those by Los Angeles County deputies despite having about a fourth of the population. “A Black person is 1.6 times more likely to be killed by law enforcement officers in Riverside County than someone who is white,” the American Civil Liberties Union said in 2021. Only about 160,000 Riverside County residents are Black.
[in-text-ad]
Source: Roberto Galan / iStock Editorial via Getty Images
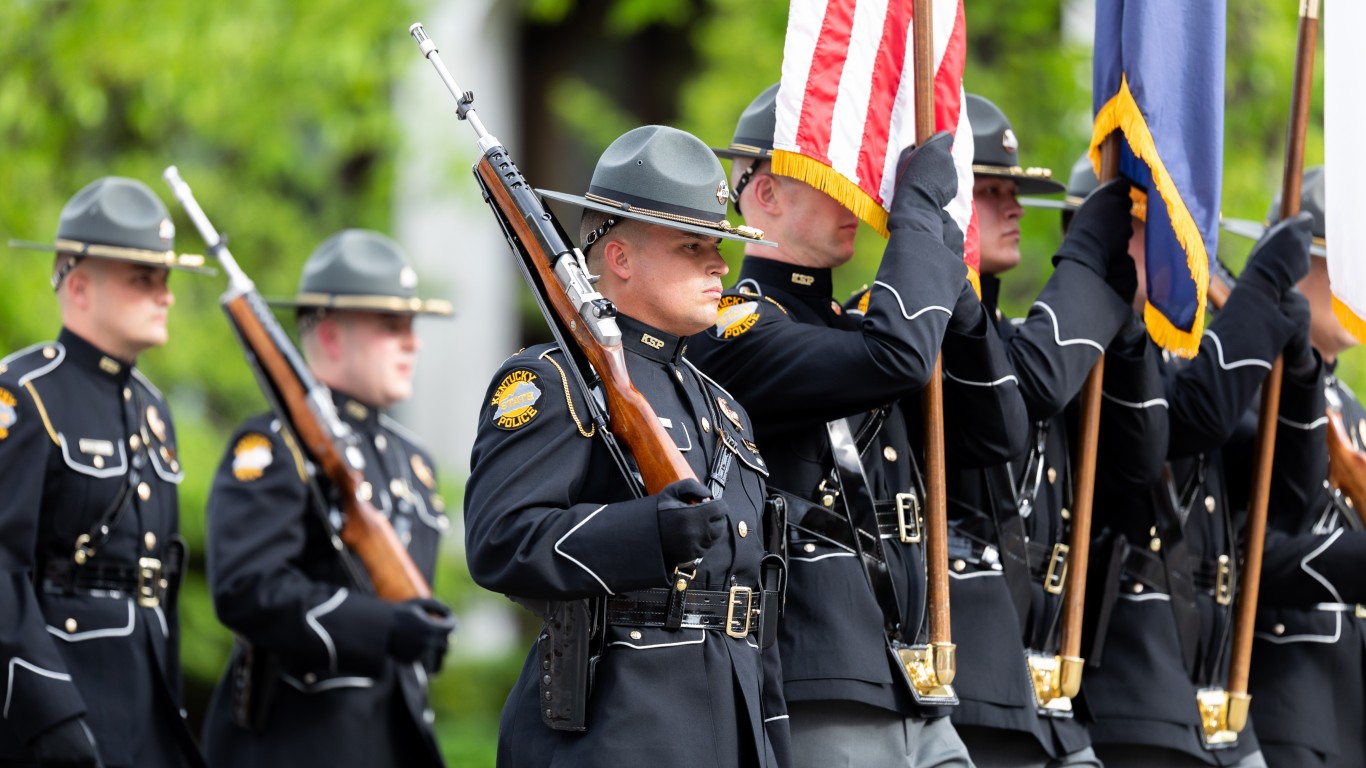
14. Kentucky State Police
> Documented police killings (2013-2022): 55 — tied (30.1% of state killings)
> Worst year for documented killings (2013-2022): 2014: 9
> % of those killed who were Black: 4.5% (total: 2)
> % of those killed who did not have a gun: 34.0% (total: 17)
> % of those killed who were fleeing: 38.2% (total: 13)
> % of cases officer was disciplined or charged with a crime: 0.0% (total: 0)
One of three state police or highway patrol agencies on this list is the second-deadliest U.S. police agency after the California Highway Patrol despite serving a much smaller population and jurisdiction. Incidents of excessive force in recent years include the brutal beating of an unarmed suspect in 2020 that led to federal charges following an FBI investigation. A similar incident, also in 2020, led to a $130,000 settlement the KSP did not disclose until investigative reporters found it through an open-records request.
Source: Courtesy of Jacksonville Sheriff's Office via Facebook
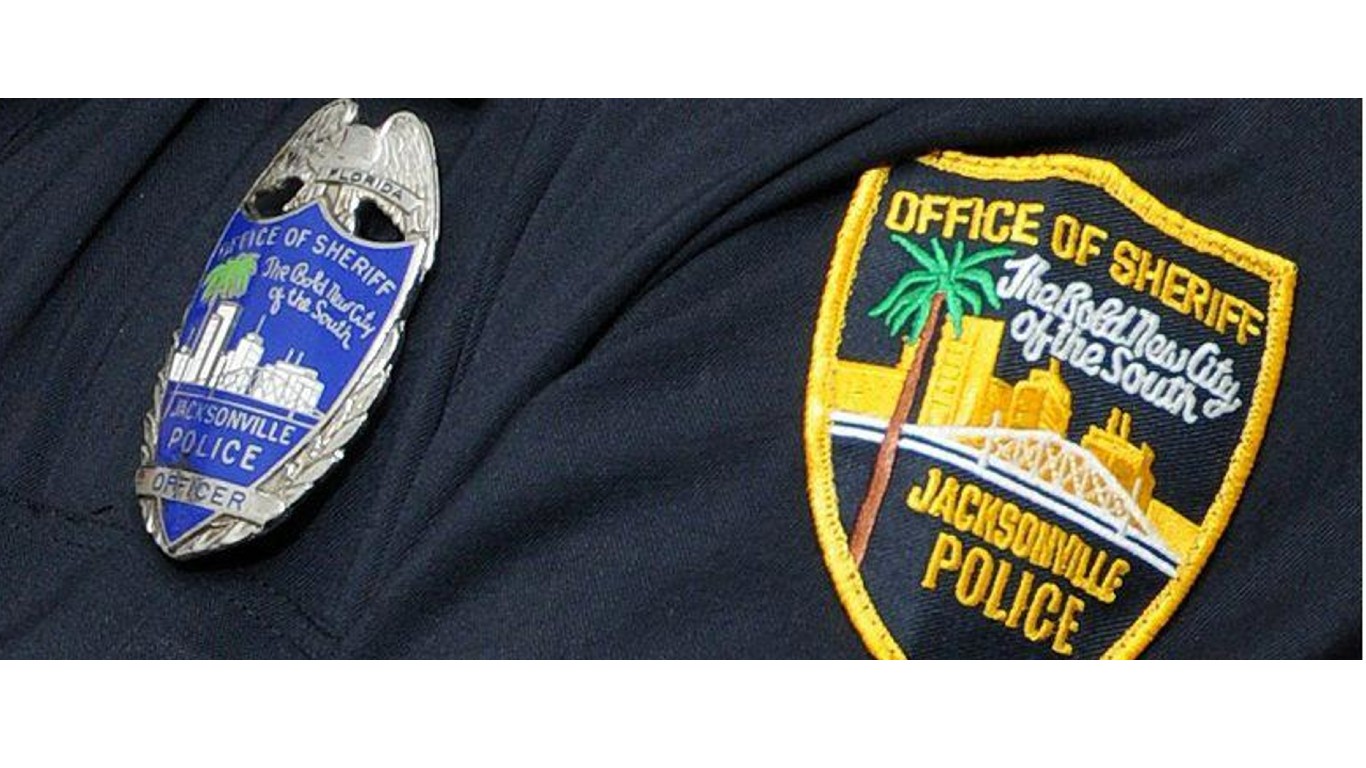
13. Jacksonville Sheriff’s Office
> Documented police killings (2013-2022): 57 (7.4% of state killings)
> Worst year for documented killings (2013-2022): tied — 2020, 2022: 8
> % of those killed who were Black: 58.2% (total: 32)
> % of those killed who did not have a gun: 52.6% (total: 30)
> % of those killed who were fleeing: 37.2% (total: 16)
> % of cases officer was disciplined or charged with a crime: 0.0% (total: 0)
Despite serving the smallest population out of the five sheriff’s departments on this list (1 million residents) the Jacksonville Sheriff’s Office committed more fatal shootings than deputies of Harris County, Texas (4.7 million residents) and officers in Riverside (2.5 million) and San Bernardino (2.2 million) counties in Southern California. Only Los Angeles County Sheriff’s Department officers, serving 9.8 million residents, have killed more people.
In 2020, two police body camera videos surfaced showing white Jacksonville deputies exhibiting aggressive and violent interactions with Black residents. One of them involving an officer knocking the teeth out of a Black woman who demanded he move his patrol car off her driveway (the video cut out during the assault), and another one showing a white officer chasing a Black man suspect while yelling “I’m going to shoot you, mother f****r!”

Source: Courtesy of Oklahoma City Police Department via Facebook
12. Oklahoma City Police Department
> Documented police killings (2013-2022): 58 (19.6% of state killings)
> Worst year for documented killings (2013-2022): 2014: 9
> % of those killed who were Black: 50.0% (total: 29)
> % of those killed who did not have a gun: 44.4% (total: 24)
> % of those killed who were fleeing: 25.0% (total: 8)
> % of cases officer was disciplined or charged with a crime: 5.1% (total: 2)
Oklahoma has the highest rate of deadly enforcement, the highest rate of police violence against Black Americans, and the highest rate of underreporting police-involved fatalities than any other U.S. state, according to a peer-reviewed study published at The Lancet medical journal. The study examined data from 1980 to 2018.
Among the 58 people that have been killed by OKCPD officers between 2013 and 2022 was Bennie Edwards, a 60-year-old unarmed Black man suffering from untreated paranoid schizophrenia. Oklahoma ranks near the bottom in mental health funding despite having among the nation’s highest rates of serious mental illness.
*******************************************************************************
[in-text-ad-2]

Source: robyvannucci / iStock Unreleased via Getty Images
11. Miami-Dade Police Department
> Documented police killings (2013-2022): 60 (7.8% of state killings)
> Worst year for documented killings (2013-2022): 2013: 15
> % of those killed who were Black: 38.5% (total: 20)
> % of those killed who did not have a gun: 51.9% (total: 28)
> % of those killed who were fleeing: 38.2% (total: 13)
> % of cases officer was disciplined or charged with a crime: 0.0% (total: 0)
The Miami-Dade Police Department serves the 2.7 million people of Miami-Dade County. According to the Police Scorecard nonprofit project, the department scores low on the use of deadly force per arrest and deadly force on unarmed victims per arrest. The department also scores low on upholding civilian complaints against officers for the use of excessive force.
Among the 60 people killed by MDPD officers in this 10-year period was Anthony Ford, who was 27 years old and unarmed when he was fatally shot by Miami-Dade Police Officer Eduardo Pares. Last year, Miami-Dade officer Alejandro Giraldo was convicted of felony battery of Dyma Loving, a Black woman who had called to complain about a neighbor pointing a shotgun at her.

10. California Highway Patrol
> Documented police killings (2013-2022): 61 (3.7% of state killings)
> Worst year for documented killings (2013-2022): 2017: 11
> % of those killed who were Black: 7.8% (total: 4)
> % of those killed who did not have a gun: 61.8% (total: 34)
> % of those killed who were fleeing: 37.5% (total: 15)
> % of cases officer was disciplined or charged with a crime: 0.0% (total: 0)
The only state highway patrol on this list is also the 10th deadliest U.S. police agency. Highway patrol and county sheriff officers are typically less likely to use deadly force compared to large city police departments because of the lower incidence of violent crime and lower population densities in their communities.
Among the 61 people killed by CHP troopers from 2013 to 2022 was Edward Bronstein, 38, who was killed in a similar fashion to George Floyd during a traffic stop for suspected DUI. Like Floyd, Bronstein pleaded “I can’t breathe” to an officer who had pinned him to the ground.
[in-text-ad]
Source: typhoonski / iStock Editorial via Getty Images
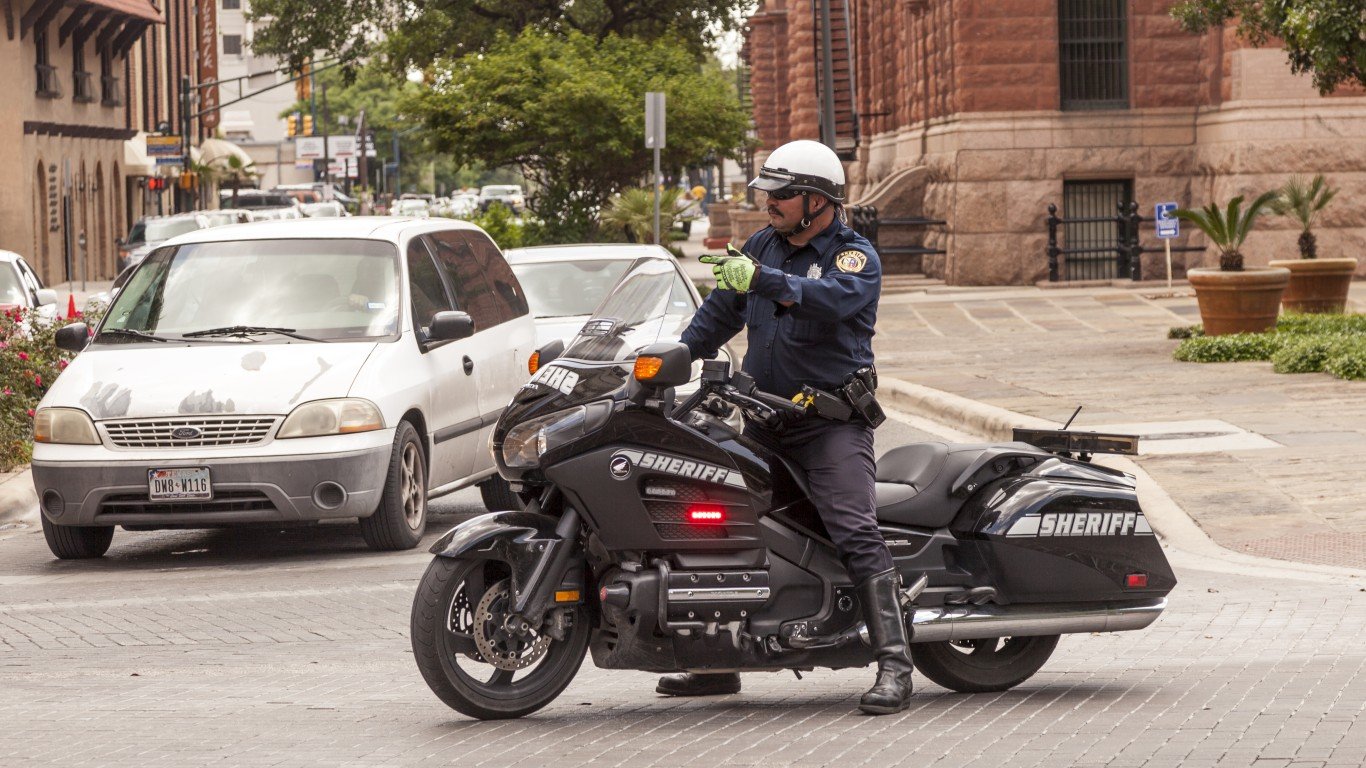
9. San Antonio Police Department
> Documented police killings (2013-2022): 73 (7.0% of state killings)
> Worst year for documented killings (2013-2022): tied — 2019, 2021: 11
> % of those killed who were Black: 15.7% (total: 11)
> % of those killed who did not have a gun: 40.8% (total: 29)
> % of those killed who were fleeing: 23.4% (total: 11)
> % of cases officer was disciplined or charged with a crime: 0.0% (total: 0)
The country’s seventh largest U.S. city by population has the ninth deadliest police force in the country with relatively high incidents of deadly force per arrest and a low rate of upholding civilian discrimination complaints, according to the Police Scorecard project.
Among the 73 people killed by SAPD officers from 2013 to 2022 are Antronie Scott, who was 36 and unarmed when he was gunned down by an officer arresting him for outstanding drug warrants. Echoing similar incidents of police killings, the officer mistook Scott’s mobile phone for a weapon.

8. Las Vegas Metropolitan Police Department
> Documented police killings (2013-2022): 87 (48.6% of state killings)
> Worst year for documented killings (2013-2022): 2018: 13
> % of those killed who were Black: 22.1% (total: 17)
> % of those killed who did not have a gun: 38.8% (total: 33)
> % of those killed who were fleeing: 27.4% (total: 17)
> % of cases officer was disciplined or charged with a crime: 4.3% (total: 2)
The 87 people who have been killed by the Las Vegas Metropolitan Police Department from 2013 to 2022 occurred despite the department’s participation from 2012 in a Justice Department program ostensibly aimed at reducing deadly force practices.
Recent police killings include Byron Lee Williams, 50, killed by police in September 2019 after he was stopped for riding a bicycle without a light. Like George Floyd and others, Williams was pinned to the ground and a police bodycam video shows him pleading multiple times to officers, “I can’t breathe.” The cause of death was similar to Tashii S. Farmer, 40, who died in May 2017 from asphyxia while being restrained by police during an arrest for erratic nonviolent behavior inside a Vegas Strip casino.

7. U.S. Marshals Service
> Documented police killings (2013-2022): 88 (28.4% of state killings)
> Worst year for documented killings (2013-2022): tied — 2016, 2021: 15
> % of those killed who were Black: 33.3% (total: 27)
> % of those killed who did not have a gun: 30.9% (total: 25)
> % of those killed who were fleeing: 32.8% (total: 19)
> % of cases officer was disciplined or charged with a crime: 0.0% (total: 0)
The nation’s oldest federal law enforcement agency is a U.S. Justice Department bureau with a nationwide jurisdiction. In addition to protecting senior government officials, it also pursues fugitives, manages the U.S. Federal Witness Protection Program, and executes federal arrest warrants. The agency also famously protected Black students during school desegregation in the South during the civil rights movement. The scope of the agency’s operations makes it one of the deadliest police agencies in the country, but it ranks among the lowest on this list for killing unarmed suspects.
[in-text-ad-2]
Source: tupungato / iStock Editorial via Getty Images
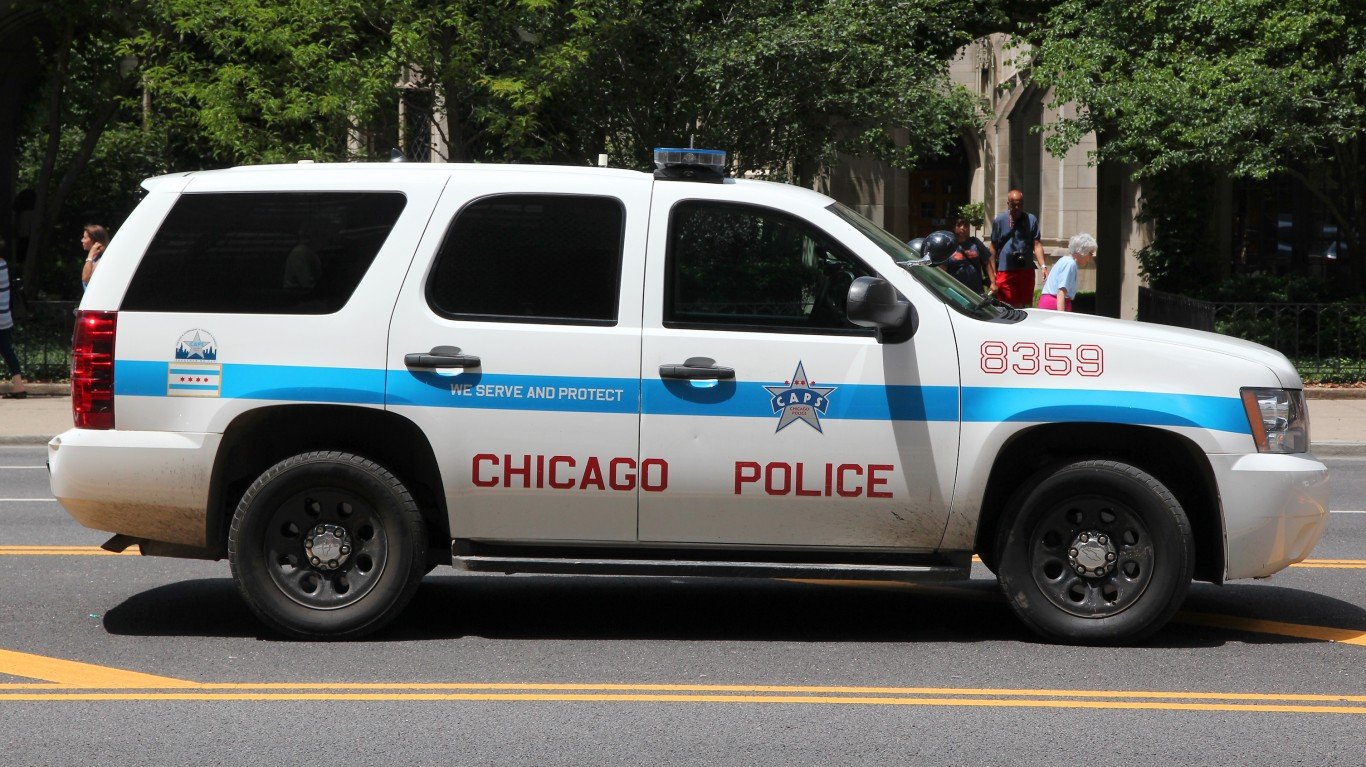
6. Chicago Police Department
> Documented police killings (2013-2022): 92 (35.8% of state killings)
> Worst year for documented killings (2013-2022): 2014: 20
> % of those killed who were Black: 74.2% (total: 66)
> % of those killed who did not have a gun: 44.7% (total: 38)
> % of those killed who were fleeing: 49.0% (total: 25)
> % of cases officer was disciplined or charged with a crime: 13.0% (total: 7)
As the law enforcement agency for one of the largest and oldest U.S. cities, the Chicago Police Department was historically beset with corruption well into the 20th century, and today it struggles with dismal community relations, deep racial disparities in the use of deadly force, and low rates of upholding complaints of misconduct, excessive force, discrimination, and criminal misconduct. The city also has a high rate of violent crime, even relative to other large U.S. cities.
The 92 people killed by the CPD in this 10-year period include Quintonio LeGrier, a 19-year-old college student visiting home on winter break. He was shot six times while welding a baseball bat and calling 911 amid a mental crisis. During that incident, police also accidentally shot and killed a neighbor, 55-year-old Bettie Jones.
Source: Courtesy of Houston Police Department via Facebook
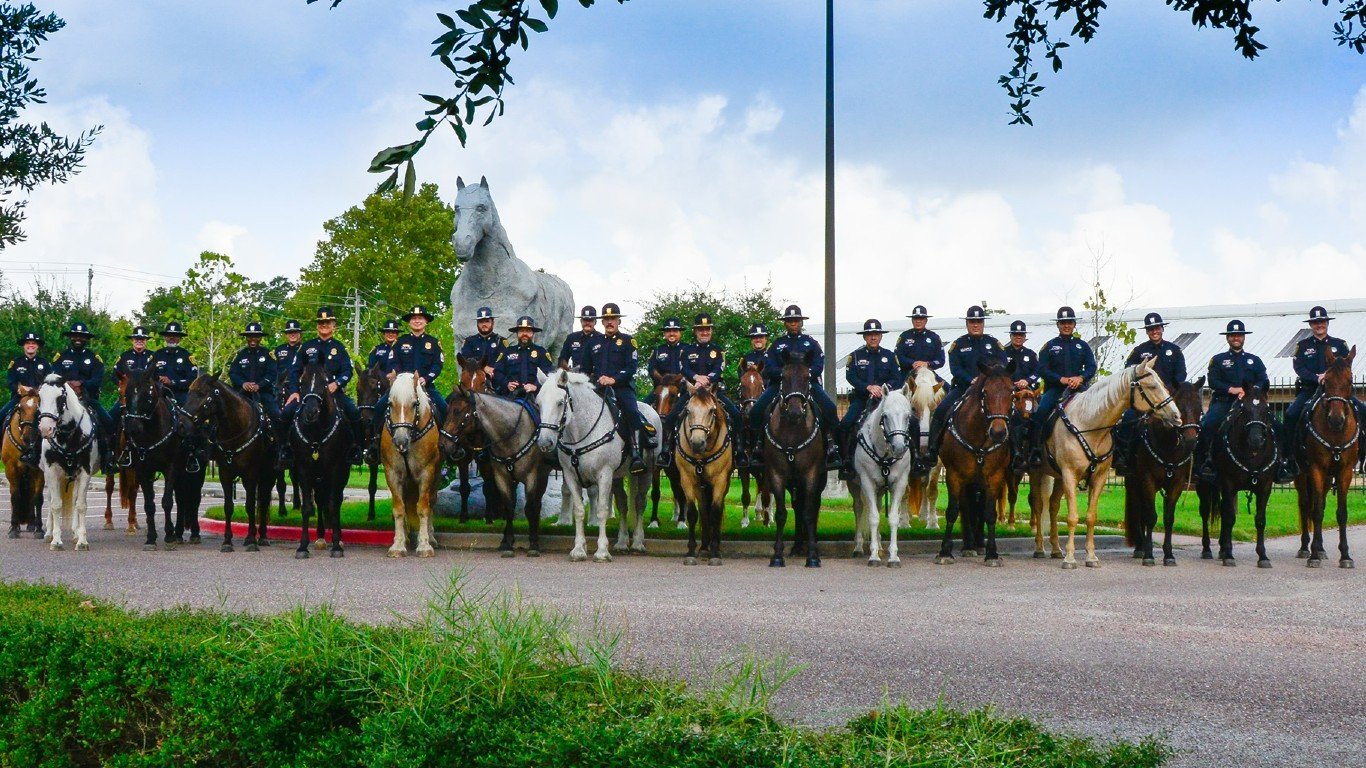
5. Houston Police Department
> Documented police killings (2013-2022): 97 (9.3% of state killings)
> Worst year for documented killings (2013-2022): 2022: 13
> % of those killed who were Black: 55.9% (total: 52)
> % of those killed who did not have a gun: 30.9% (total: 29)
> % of those killed who were fleeing: 32.3% (total: 20)
> % of cases officer was disciplined or charged with a crime: 3.6% (total: 2)
The Houston Police Department serves this city of 2.3 million, while the Harris County Sheriff’s Office patrols the rest of the county of about 2.4 million people who live near Houston. Together, these agencies have killed 140 people in this 10-year period. Houston is more ethnically and racially diverse than its more affluent and more dispersed suburban population, and the HPD scores low on use of deadly force and upholding civilian complaints.
Among the 97 people killed by HPD officers from 2013 to 2022 was Jalen Randle, 29, who was fatally shot after a police chase when an officer prematurely fired his gun, according to the officer’s body cam footage. In February, the mother of Jermaine Sonnier, 19, initiated a civil lawsuit for the June 2021 killing of her son while restraining him after a foot chase.
[in-text-ad]
Source: tillsonburg / iStock Unreleased via Getty Images
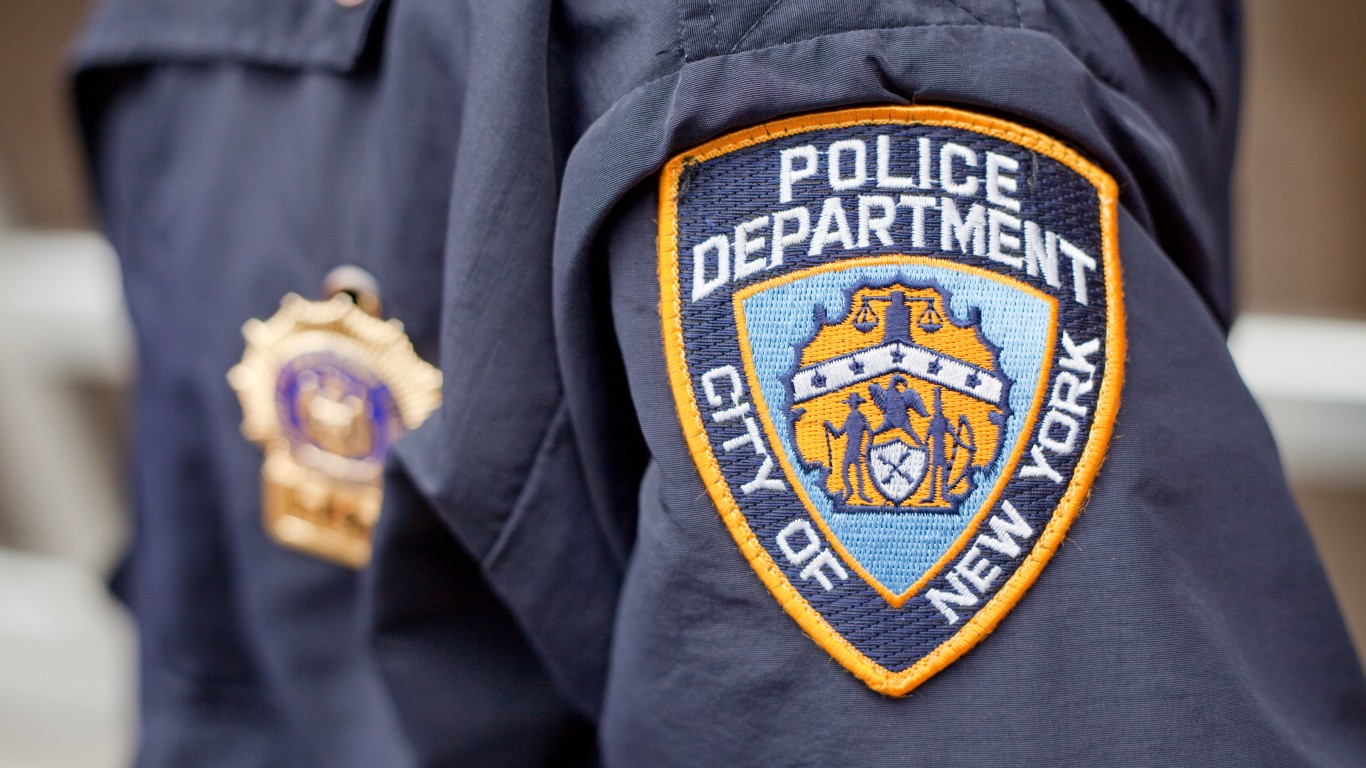
4. New York Police Department
> Documented police killings (2013-2022): 102 (43.4% of state killings)
> Worst year for documented killings (2013-2022): 2019: 14
> % of those killed who were Black: 66.3% (total: 59)
> % of those killed who did not have a gun: 57.0% (total: 57)
> % of those killed who were fleeing: 34.9% (total: 22)
> % of cases officer was disciplined or charged with a crime: 8.1% (total: 5)
The largest police department in the country suffers from similar issues other big-city law enforcement agencies do, scoring poorly on police misconduct, racial disparities, and upholding civilian complaints, especially for discrimination and excessive force.
The most high profile police killing in the nation occurred on Staten Island in 2014, when police choked out Eric Garner, 43, for selling single cigarettes on the street. Earlier this year, the city agreed to pay millions of dollars in a lawsuit brought on by protesters for the way the NYPD handled demonstrations in the summer of 2020 after the killing of George Floyd at the hands of Minneapolis police.

3. Los Angeles County Sheriff’s Department
> Documented police killings (2013-2022): 126 (7.6% of state killings)
> Worst year for documented killings (2013-2022): 2014: 20
> % of those killed who were Black: 26.2% (total: 32)
> % of those killed who did not have a gun: 55.4% (total: 67)
> % of those killed who were fleeing: 32.4% (total: 24)
> % of cases officer was disciplined or charged with a crime: 2.8% (total: 2)
The most populous county in the United States is home to 9.8 million people, including 3.8 million Los Angeles residents. Last year, the California state auditor singled out five state law enforcement agencies, including the LACSD, for insufficient efforts to prevent racial and ethnic biases in their forces.
The LACSD has the lowest ratings by the nonprofit Police Scorecard project, earning dismal scores for misconduct, racial disparities in the use of deadly force, and upholding civilian complaints. Protests erupted in September 2020 after LACSD deputies fatally shot Dijon Kizzee after stopping him for riding a bicycle “in violation of vehicle codes.”

2. Phoenix Police Department
> Documented police killings (2013-2022): 142 (28.9% of state killings)
> Worst year for documented killings (2013-2022): 2018: 23
> % of those killed who were Black: 17.4% (total: 23)
> % of those killed who did not have a gun: 47.9% (total: 67)
> % of those killed who were fleeing: 30.2% (total: 29)
> % of cases officer was disciplined or charged with a crime: 0.0% (total: 0)
The nonprofit group Mapping Police Violence ranks the Phoenix Police Department as the police agency most likely to use deadly force among the top 10 most populous cities. Phoenix cops came in second in the number of police killings from 2013 to 2022, after the Los Angeles Police Department, despite serving a population that’s 40% the size of L.A.
The PPD earns low marks for responding to civilian complaints and the use of deadly force against armed and unarmed suspects. Among the people killed in this 10-year period was J.R. Williams, 38, who was fatally shot while behaving erratically and making verbal threats to an officer following a foot chase. The officer shot Williams believing incorrectly that he was wielding a firearm.
[in-text-ad-2]
Source: anouchka / iStock Unreleased via Getty Images
1. Los Angeles Police Department
> Documented police killings (2013-2022): 167 (10.1% of state killings)
> Worst year for documented killings (2013-2022): 2015: 23
> % of those killed who were Black: 19.5% (total: 31)
> % of those killed who did not have a gun: 54.4% (total: 87)
> % of those killed who were fleeing: 35.2% (total: 37)
> % of cases officer was disciplined or charged with a crime: 2.1% (total: 2)
Like other big-city police departments, the LAPD scores poorly on misconduct, use of deadly force, and upholding civilian complaints, according to the nonprofit Police Scorecard project. People killed from 2013 to 2022 include Ezell Ford, a 25-year-old mentally ill man who was shot several times during an altercation with police in August 2014, and Dijon Kizzee, 29, who was killed by police in September 2020. Police had stopped Kizzee for riding a bicycle on the wrong side of the road. According to the L.A. Times, 999 people have been killed by city police or county deputies in L.A. County since 2000.
Methodology
To determine the police departments with the most killings, 24/7 Wall St. reviewed data from Mapping Police Violence, a research collaborative that collects data on police killings across the nation from the country’s three largest comprehensive and impartial crowdsourced databases. Data was accessed on Feb. 22, 2023 and includes all police department killings from 2013 through the end of 2022.
The percentages of incidents in which the person killed was Black, did not have a gun, was fleeing, and in which the officer was disciplined or faced criminal charges, were calculated as a percentage of incidents for which information was available in the report rather than of all incidents. For example, many of the killings on this list still have investigation pending. When calculating the share of incidents in which the officer faced criminal charges, cases that are only listed in the Mapping Police Violence database official disposition of death entry as “investigation pending,” with no commentary on whether officers were charged, were not included in the calculation.
Take This Retirement Quiz To Get Matched With An Advisor Now (Sponsored)
Are you ready for retirement? Planning for retirement can be overwhelming, that’s why it could be a good idea to speak to a fiduciary financial advisor about your goals today.
Start by taking this retirement quiz right here from SmartAsset that will match you with up to 3 financial advisors that serve your area and beyond in 5 minutes. Smart Asset is now matching over 50,000 people a month.
Click here now to get started.
Thank you for reading! Have some feedback for us?
Contact the 24/7 Wall St. editorial team.
Editors' Picks