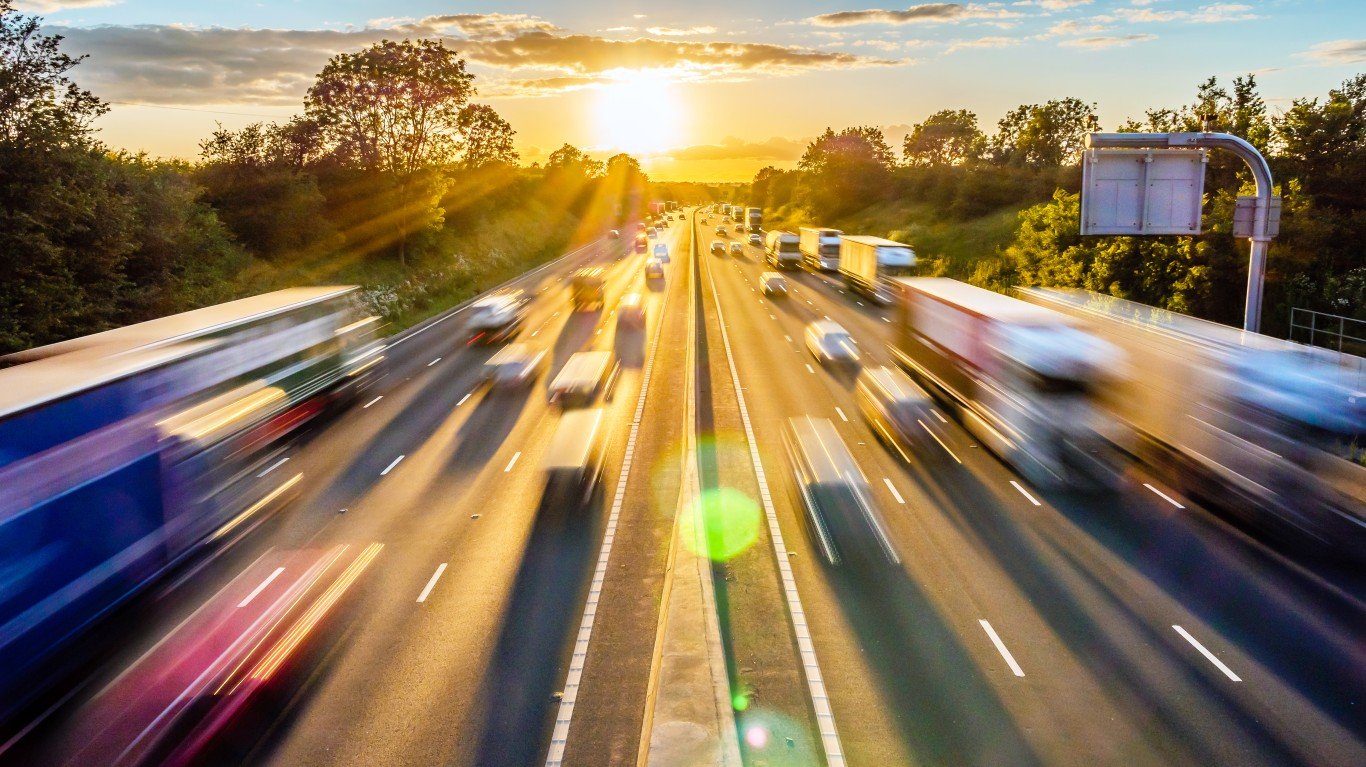
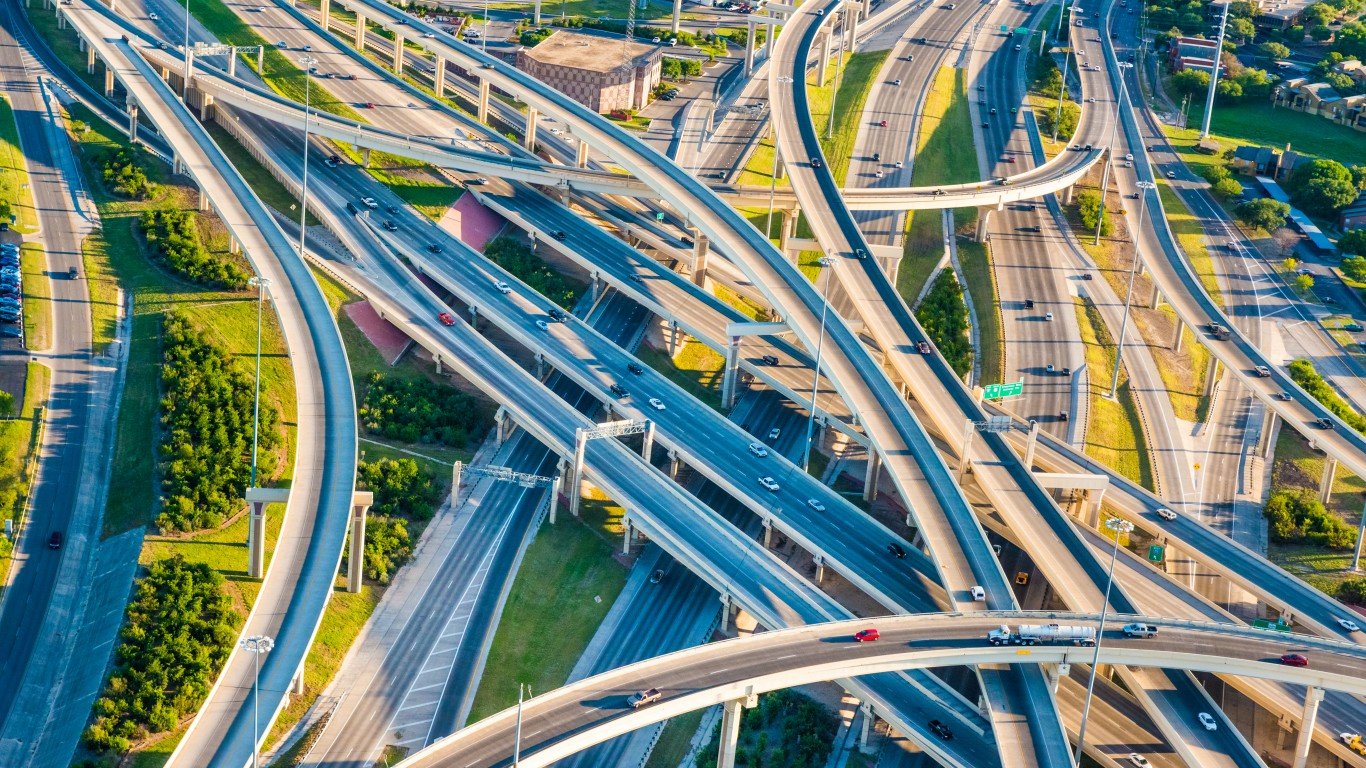
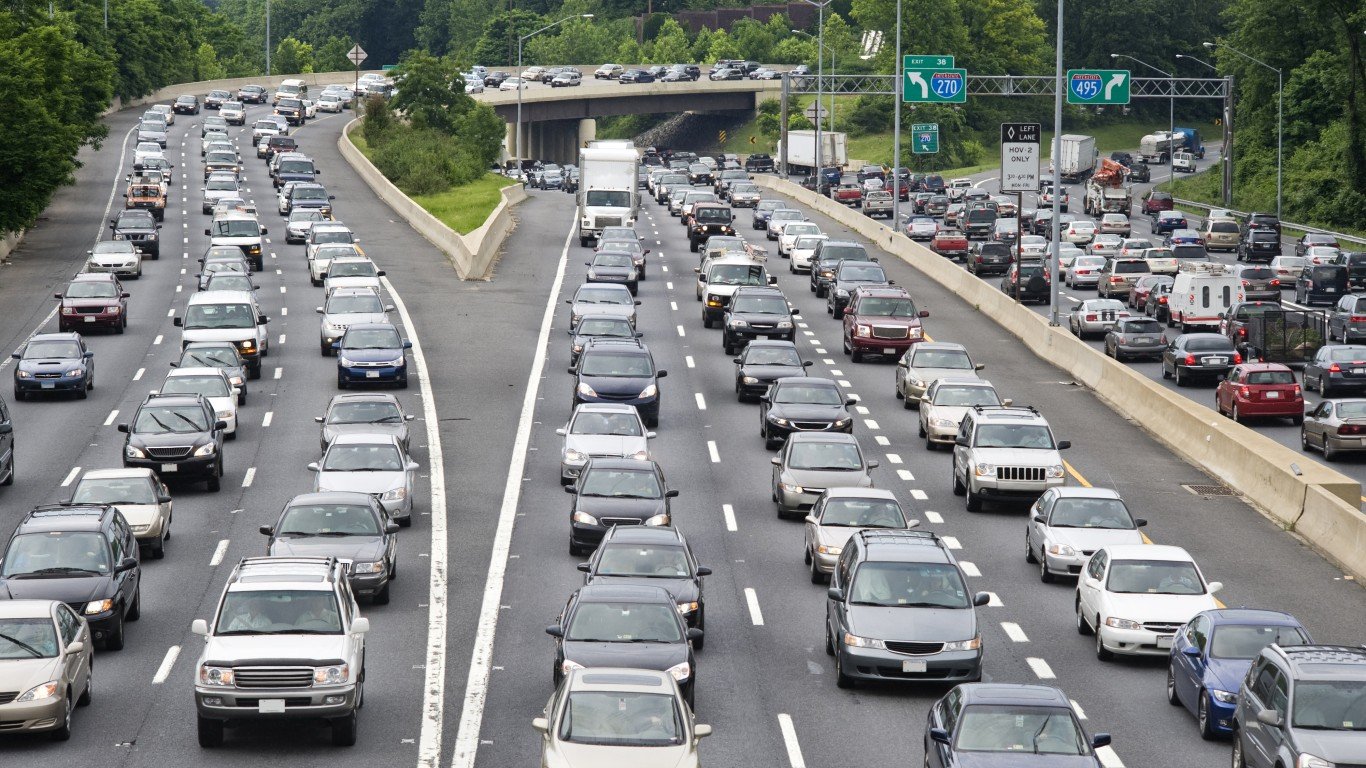
With pandemic-era restrictions largely lifted, traffic congestion is getting worse in much of the United States. As Americans return to the office, roads that were once virtually deserted are now filled with rush hour traffic.
Traffic delays are expensive, costing American drivers an estimated $100 billion annually in wasted fuel and lost time, according to Texas A&M University. Each year, in cities across the United States, the typical commuter spends hours sitting in traffic – and in some cities, the problem is far worse than in others. (Here is a look at the most fuel efficient SUVs on the market.)
Using traffic data for 292 U.S. cities from INRIX, a traffic data and analytics company, 24/7 Wall St. identified the American cities with the worst traffic. Cities are ranked by the average number of hours the typical commuter lost to traffic in 2022. In the case of a tie, the city with the longer average commute time ranks lower. In the 32 cities on this list, the average commuter lost 30 hours or to traffic in 2022.
California is home to five cities on this list, more than any other state, followed by Texas, with four of the cities with the worst traffic. In every city on this list, traffic delays increased by anywhere from 11% to 155% from 2021 to 2022.
Most of the cities on this list are densely-populated places where tens of thousands – if not hundreds of thousands – of people either drive or catch a ride to work. This list includes eight of the 10 largest U.S. cities by population – including New York, Los Angeles, Chicago, and Houston.
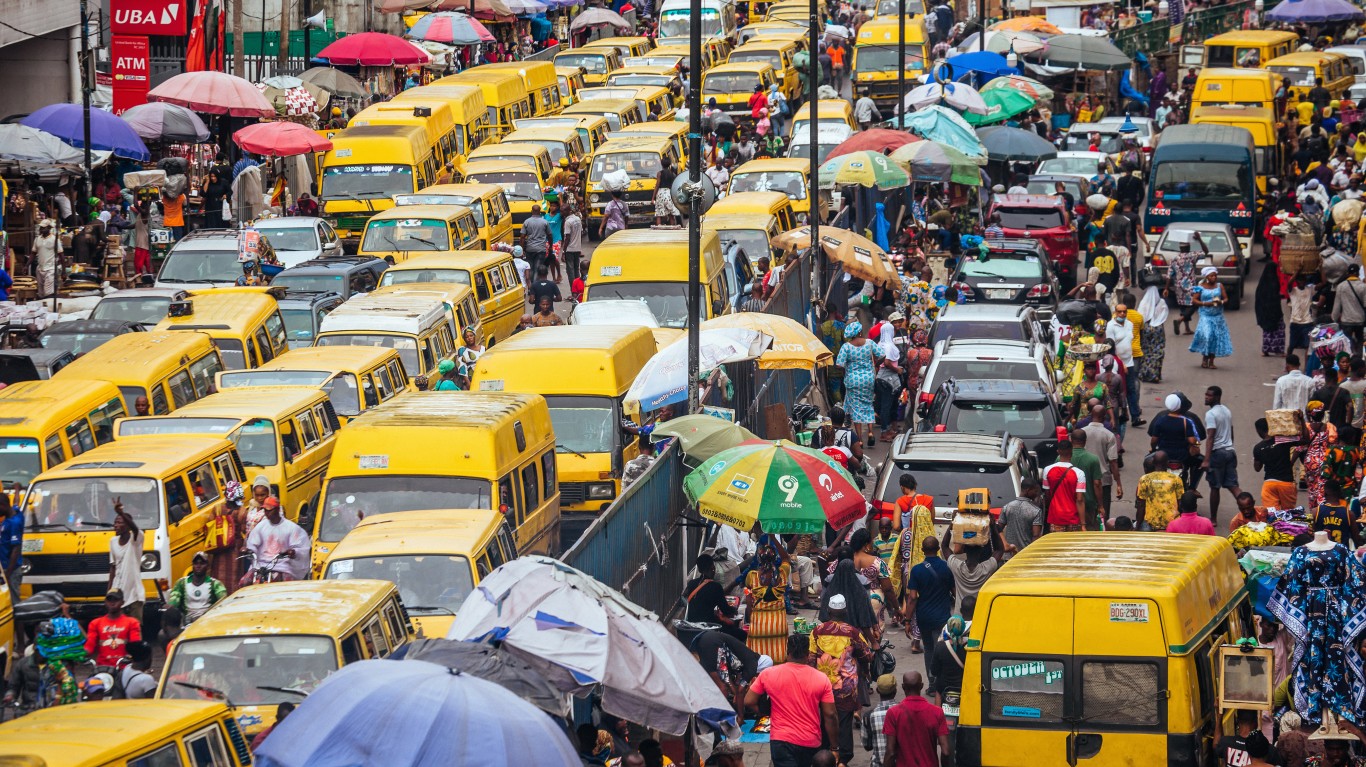
Notably, several cities on this list, like New York, San Francisco, and Washington, D.C., have reliable subway systems that most commuters use every day. Even though public transportation offsets roadway congestion, commuters who drive in these places still spent an average of more than 80 hours stuck in traffic in 2022. (Here is a look at the most congested cities in the world.)
Click here to see the U.S. cities with the worst traffic.
Click here to read our detailed methodology.
Source: Ultima_Gaina / iStock via Getty Images
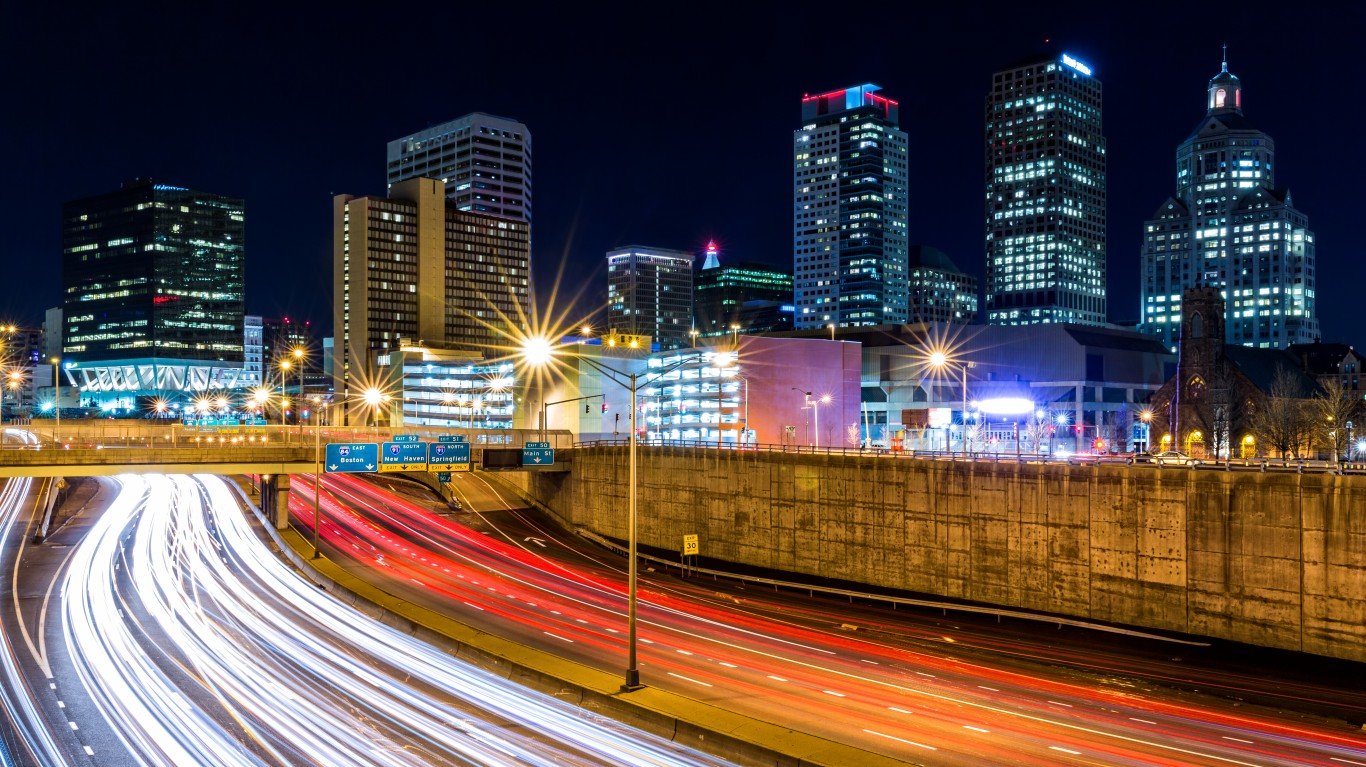
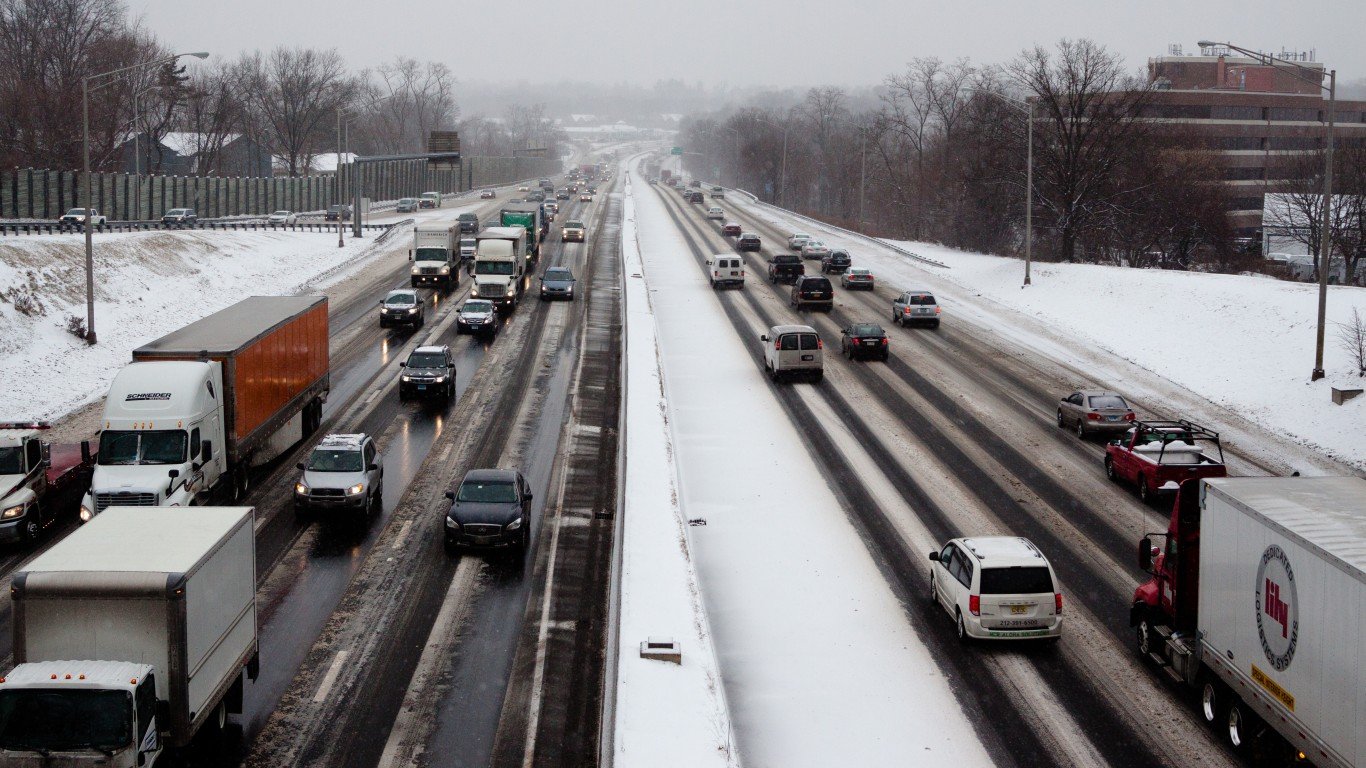
32. Hartford, CT
> Avg. commute time lost to traffic delays in 2022: 30 hours per driver
> Change in traffic delays from 2021: +43%
> Avg. commute time in city: 21.7 minutes
> Commuters who drive or carpool to work: 37,026; 78.7% of commuters
[in-text-ad]
Source: DenisTangneyJr / iStock via Getty Images
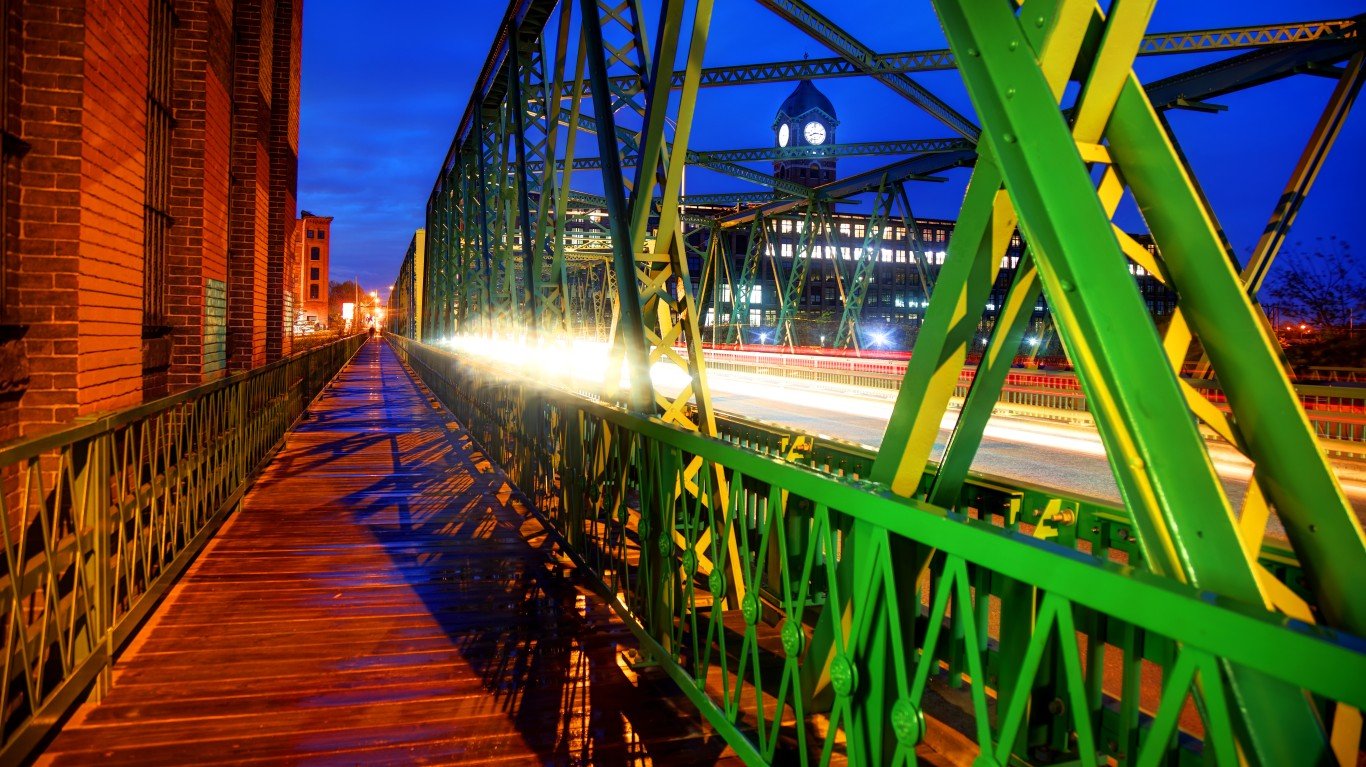
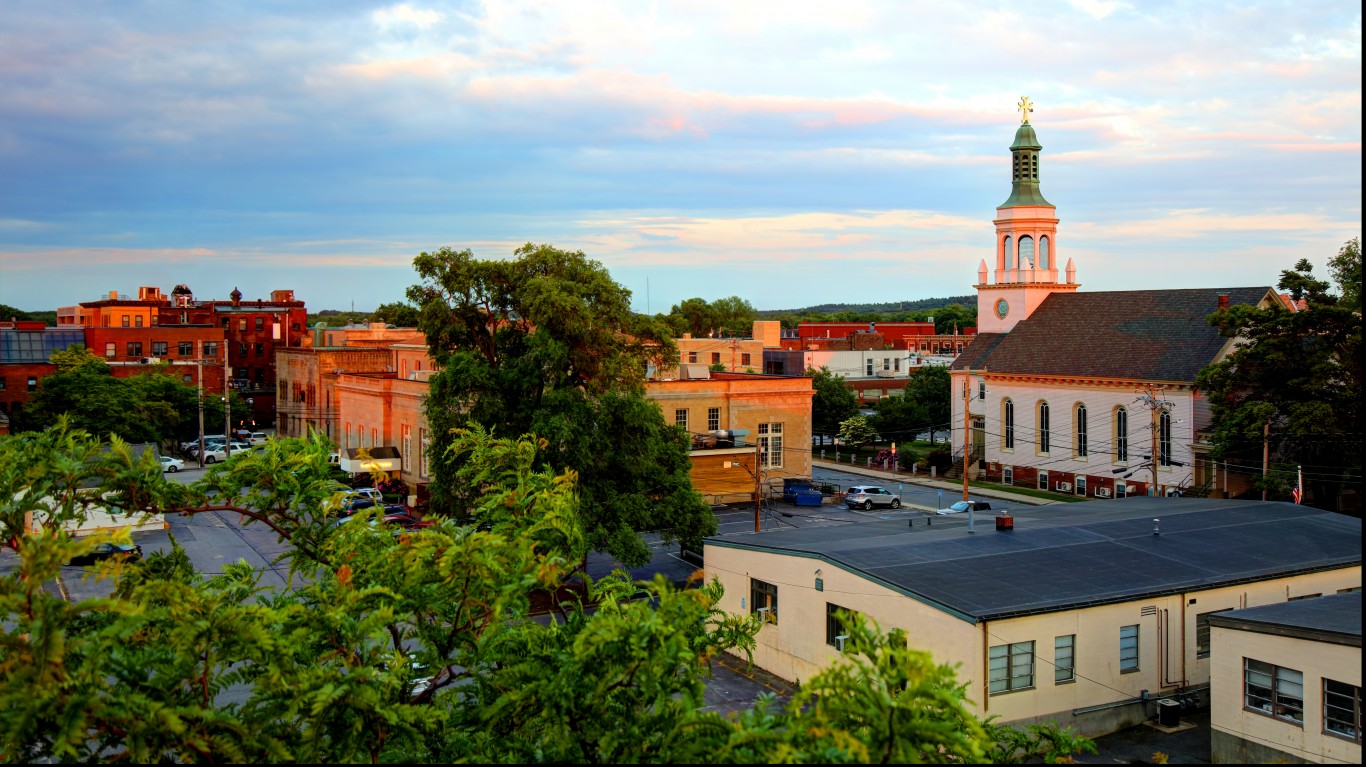
31. Lawrence, MA
> Avg. commute time lost to traffic delays in 2022: 30 hours per driver
> Change in traffic delays from 2021: +50%
> Avg. commute time in city: 22.3 minutes
> Commuters who drive or carpool to work: 33,511; 87.5% of commuters
 24/7 Wall St.
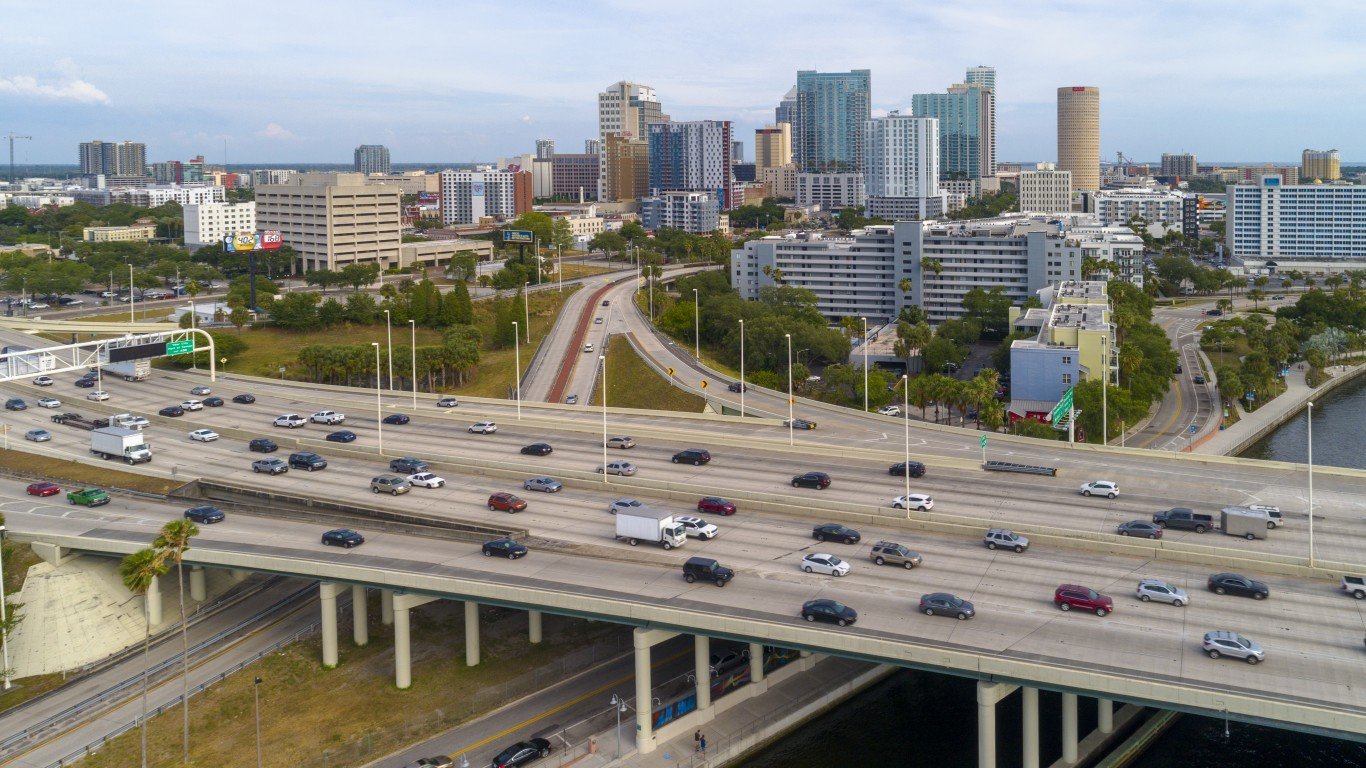
Source: Alex Potemkin / iStock via Getty Images
30. Tampa, FL
> Avg. commute time lost to traffic delays in 2022: 30 hours per driver
> Change in traffic delays from 2021: +43%
> Avg. commute time in city: 24.7 minutes
> Commuters who drive or carpool to work: 151,042; 92.3% of commuters
 E Wisconsin Av... by (vincent desjardins)")
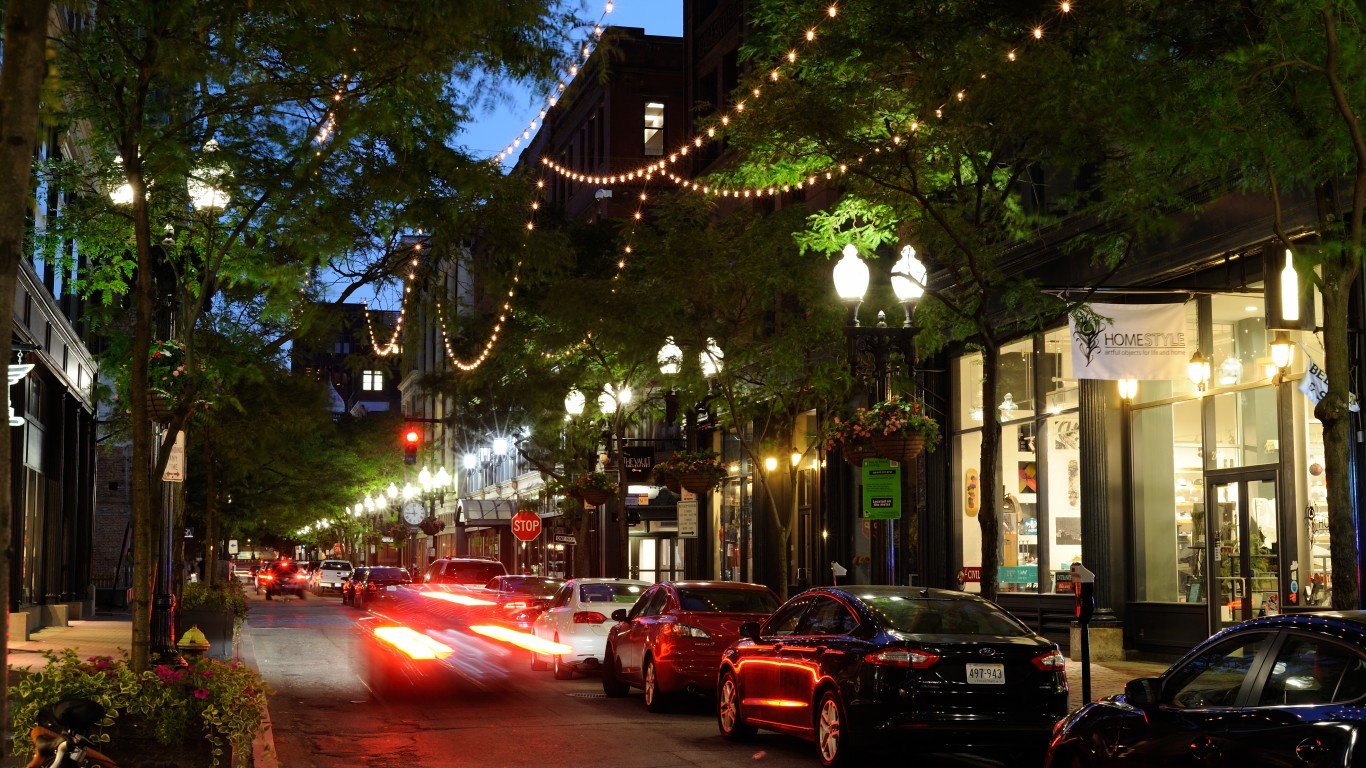
29. Milwaukee, WI
> Avg. commute time lost to traffic delays in 2022: 32 hours per driver
> Change in traffic delays from 2021: +47%
> Avg. commute time in city: 22.3 minutes
> Commuters who drive or carpool to work: 210,005; 87.5% of commuters
[in-text-ad-2]
Source: dszc / Getty Images
28. San Antonio, TX
> Avg. commute time lost to traffic delays in 2022: 32 hours per driver
> Change in traffic delays from 2021: +41%
> Avg. commute time in city: 24.3 minutes
> Commuters who drive or carpool to work: 585,727; 93.8% of commuters
Source: DenisTangneyJr / iStock via Getty Images
27. Framingham, MA
> Avg. commute time lost to traffic delays in 2022: 32 hours per driver
> Change in traffic delays from 2021: +25%
> Avg. commute time in city: 30.8 minutes
> Commuters who drive or carpool to work: 28,988; 86.4% of commuters
[in-text-ad]
Source: peeterv / E+ via Getty Images
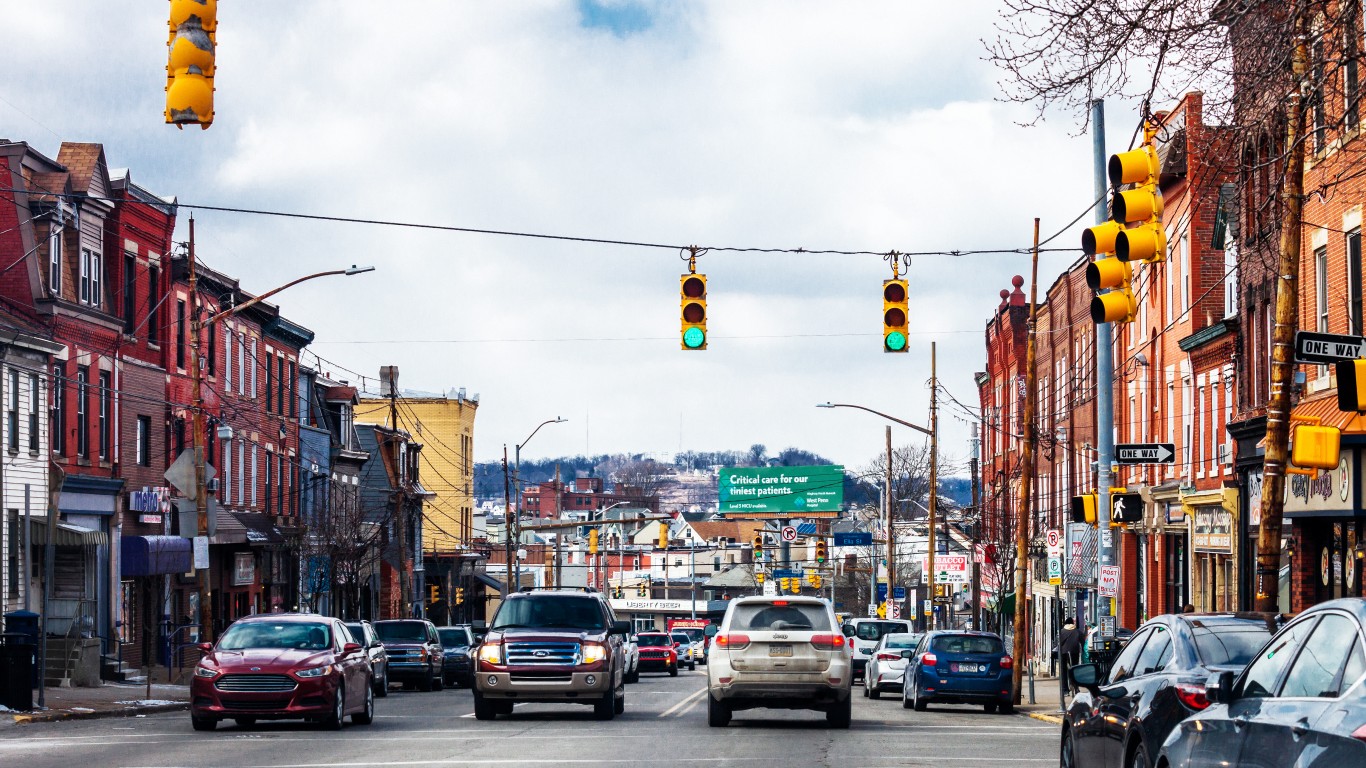
26. Pittsburgh, PA
> Avg. commute time lost to traffic delays in 2022: 34 hours per driver
> Change in traffic delays from 2021: +87%
> Avg. commute time in city: 23.9 minutes
> Commuters who drive or carpool to work: 90,784; 68.1% of commuters
 24/7 Wall St.
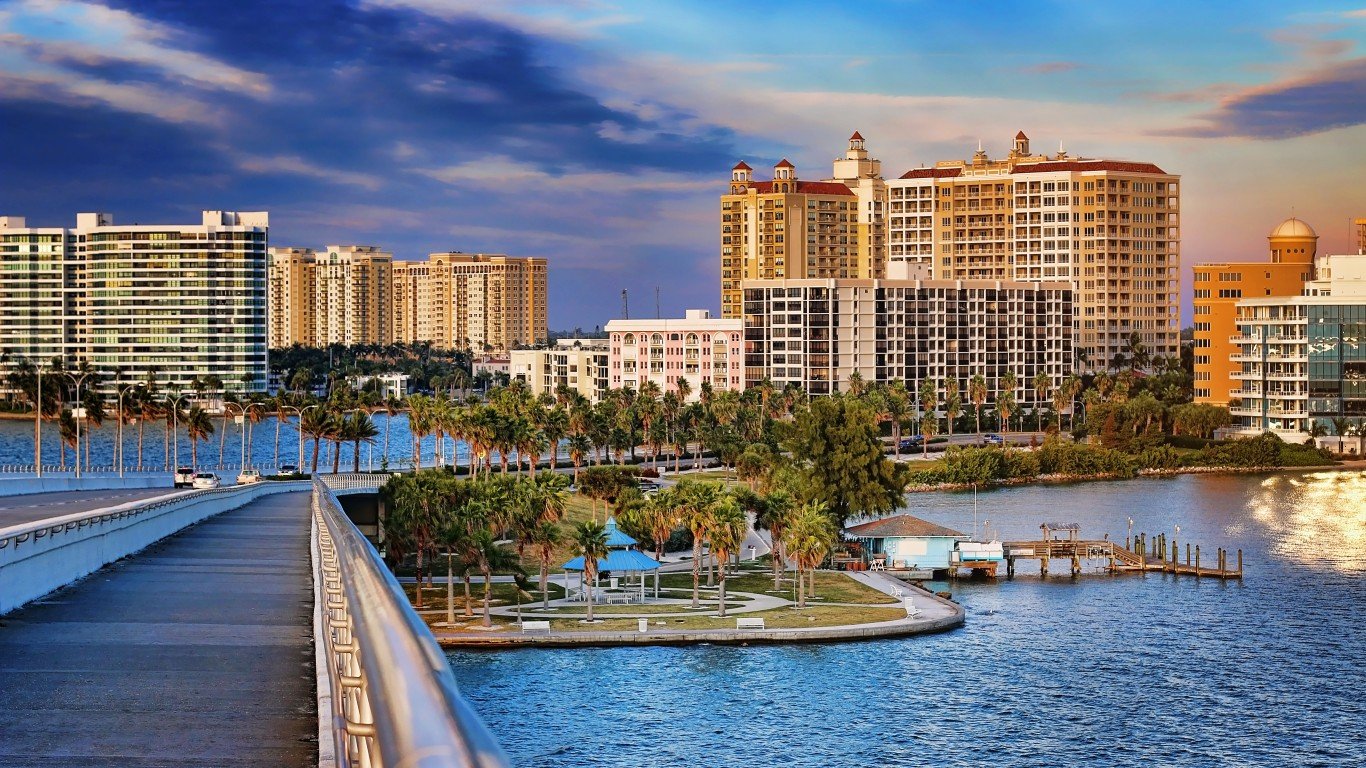
Source: KarolinaBorkowski / iStock via Getty Images
25. Sarasota-Bradenton, FL
> Avg. commute time lost to traffic delays in 2022: 36 hours per driver
> Change in traffic delays from 2021: +29%
> Avg. commute time in city: 22.3 minutes
> Commuters who drive or carpool to work: 19,751; 93.4% of commuters
Source: jmoor17 / iStock Unreleased via Getty Images
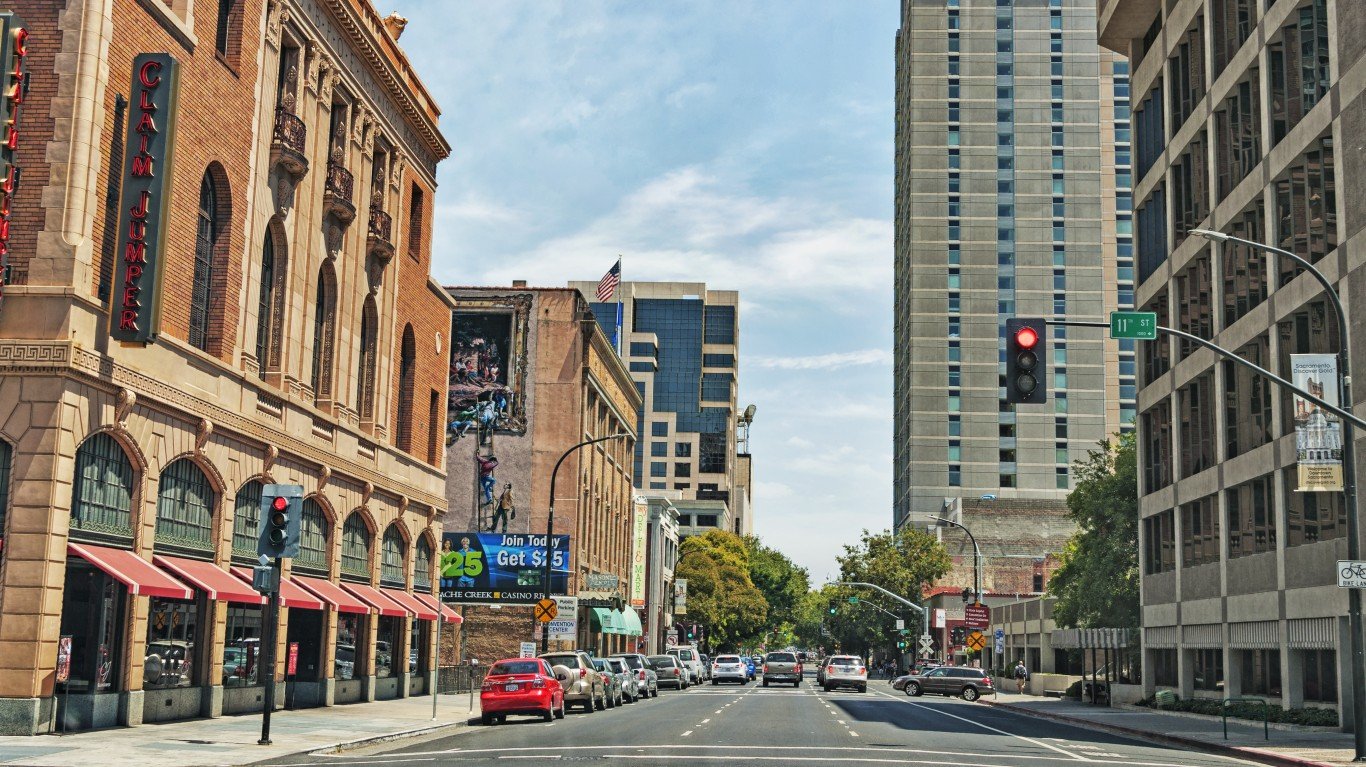
24. Sacramento, CA
> Avg. commute time lost to traffic delays in 2022: 36 hours per driver
> Change in traffic delays from 2021: +44%
> Avg. commute time in city: 26.1 minutes
> Commuters who drive or carpool to work: 190,752; 89.8% of commuters
[in-text-ad-2]
Source: FangXiaNuo / Getty Images
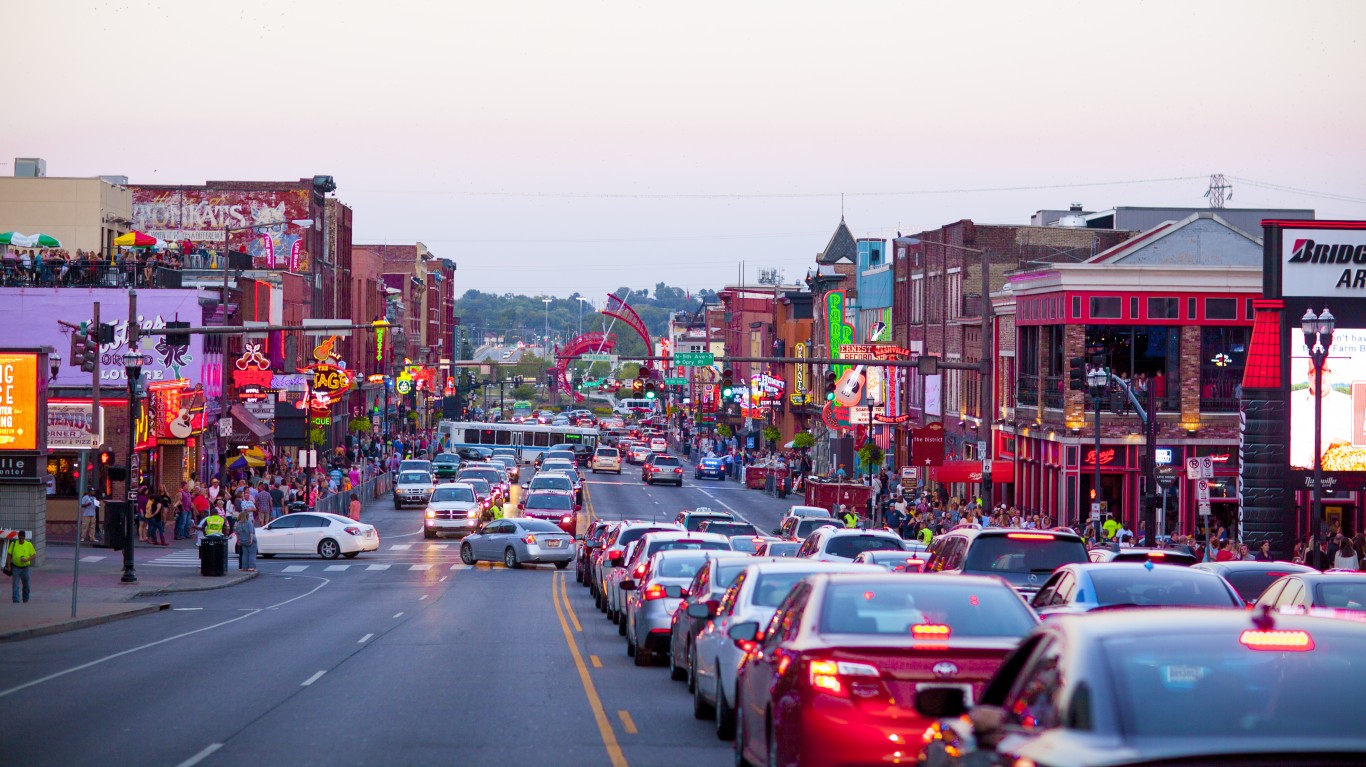
23. Nashville, TN
> Avg. commute time lost to traffic delays in 2022: 41 hours per driver
> Change in traffic delays from 2021: +155%
> Avg. commute time in city: 25.0 minutes
> Commuters who drive or carpool to work: 305,799; 93.8% of commuters
Source: franckreporter / iStock via Getty Images
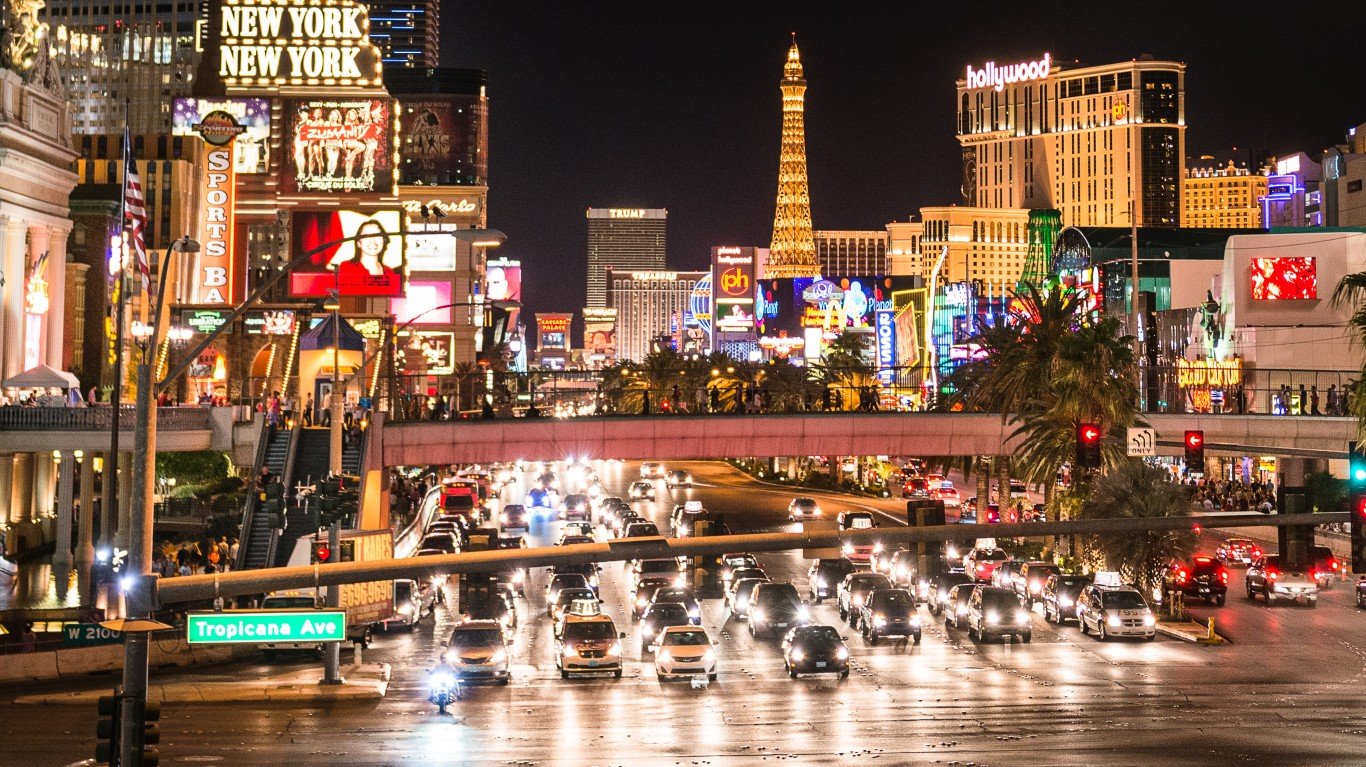
22. Las Vegas, NV
> Avg. commute time lost to traffic delays in 2022: 41 hours per driver
> Change in traffic delays from 2021: +46%
> Avg. commute time in city: 25.8 minutes
> Commuters who drive or carpool to work: 243,916; 92.2% of commuters
[in-text-ad]
Source: aimintang / iStock Unreleased via Getty Images
21. Providence, RI
> Avg. commute time lost to traffic delays in 2022: 42 hours per driver
> Change in traffic delays from 2021: +11%
> Avg. commute time in city: 24.2 minutes
> Commuters who drive or carpool to work: 65,447; 84.1% of commuters
Source: peeterv / iStock via Getty Images
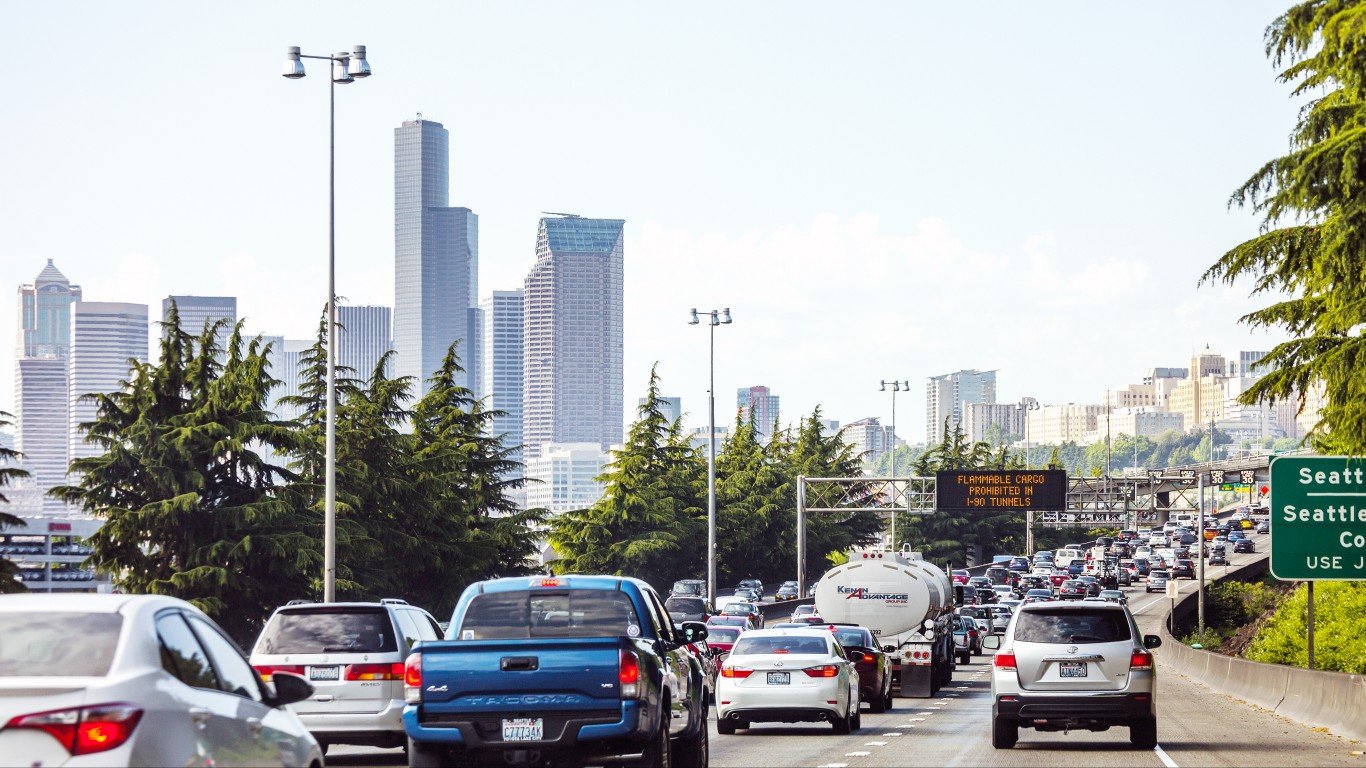
20. Seattle, WA
> Avg. commute time lost to traffic delays in 2022: 46 hours per driver
> Change in traffic delays from 2021: +52%
> Avg. commute time in city: 27.7 minutes
> Commuters who drive or carpool to work: 204,468; 59.4% of commuters
Source: typhoonski / iStock Editorial via Getty Images
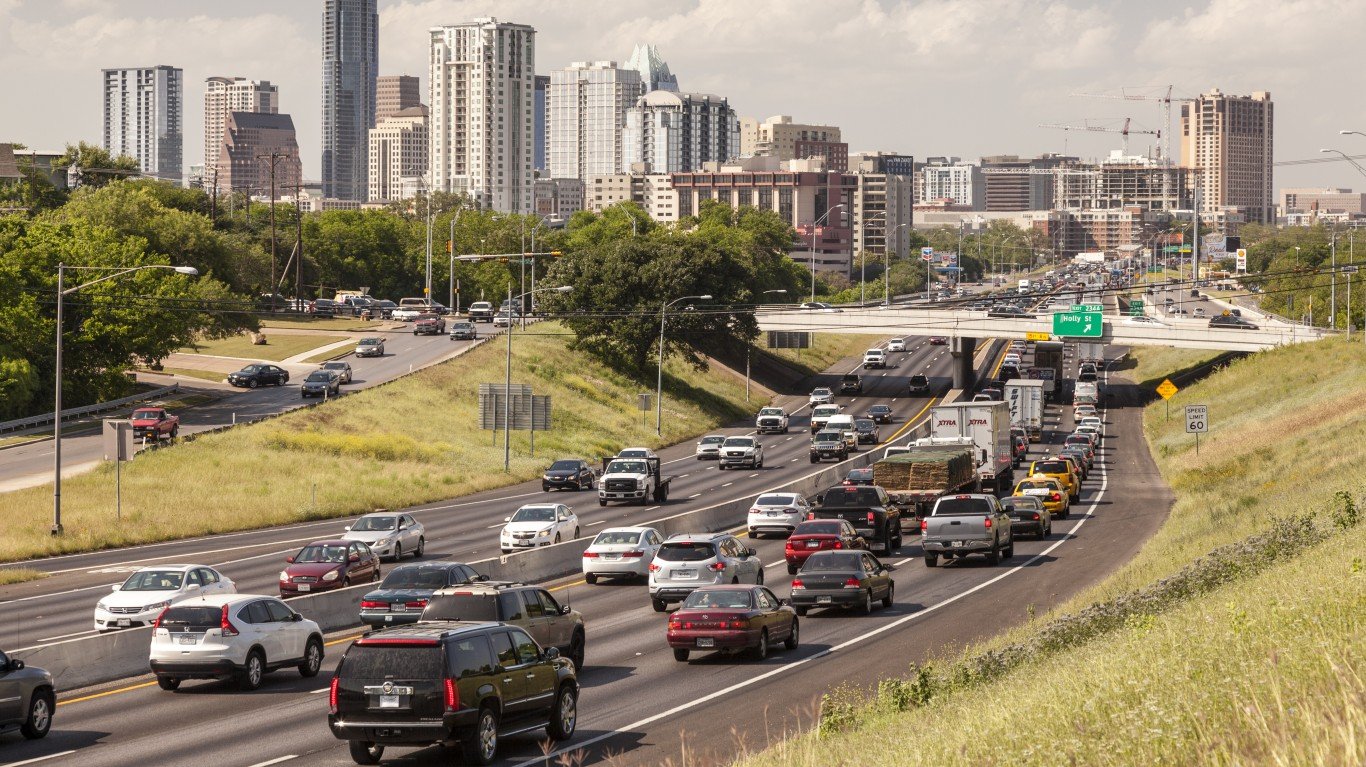
19. Austin, TX
> Avg. commute time lost to traffic delays in 2022: 53 hours per driver
> Change in traffic delays from 2021: +65%
> Avg. commute time in city: 24.5 minutes
> Commuters who drive or carpool to work: 404,386; 90.6% of commuters
[in-text-ad-2]
Source: Mindy_Nicole_Photography / iStock via Getty Images
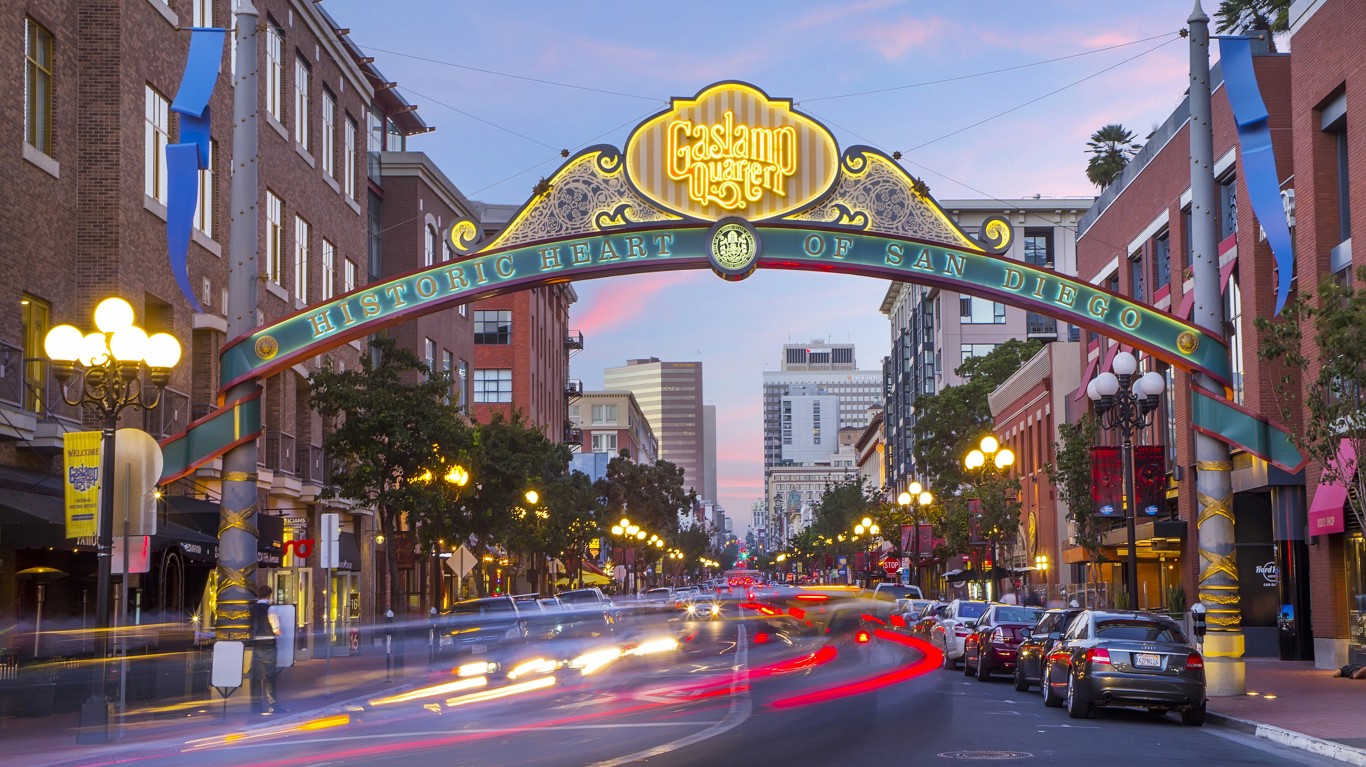
18. San Diego, CA
> Avg. commute time lost to traffic delays in 2022: 54 hours per driver
> Change in traffic delays from 2021: +69%
> Avg. commute time in city: 24.3 minutes
> Commuters who drive or carpool to work: 553,947; 89.6% of commuters
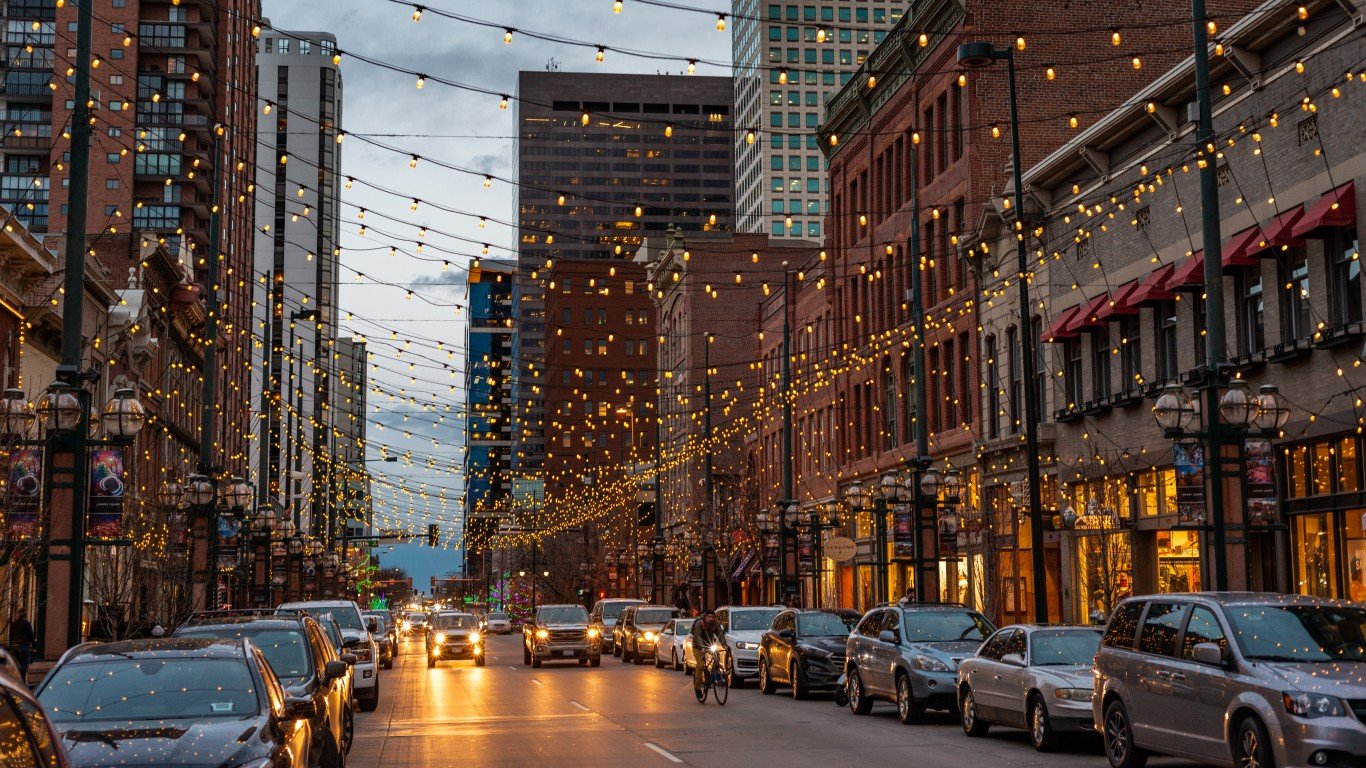
Source: pascaluehli / iStock via Getty Images
17. Denver, CO
> Avg. commute time lost to traffic delays in 2022: 54 hours per driver
> Change in traffic delays from 2021: +35%
> Avg. commute time in city: 25.5 minutes
> Commuters who drive or carpool to work: 280,340; 84.0% of commuters
[in-text-ad]
Source: Tomsmith585 / iStock Unreleased via Getty Images
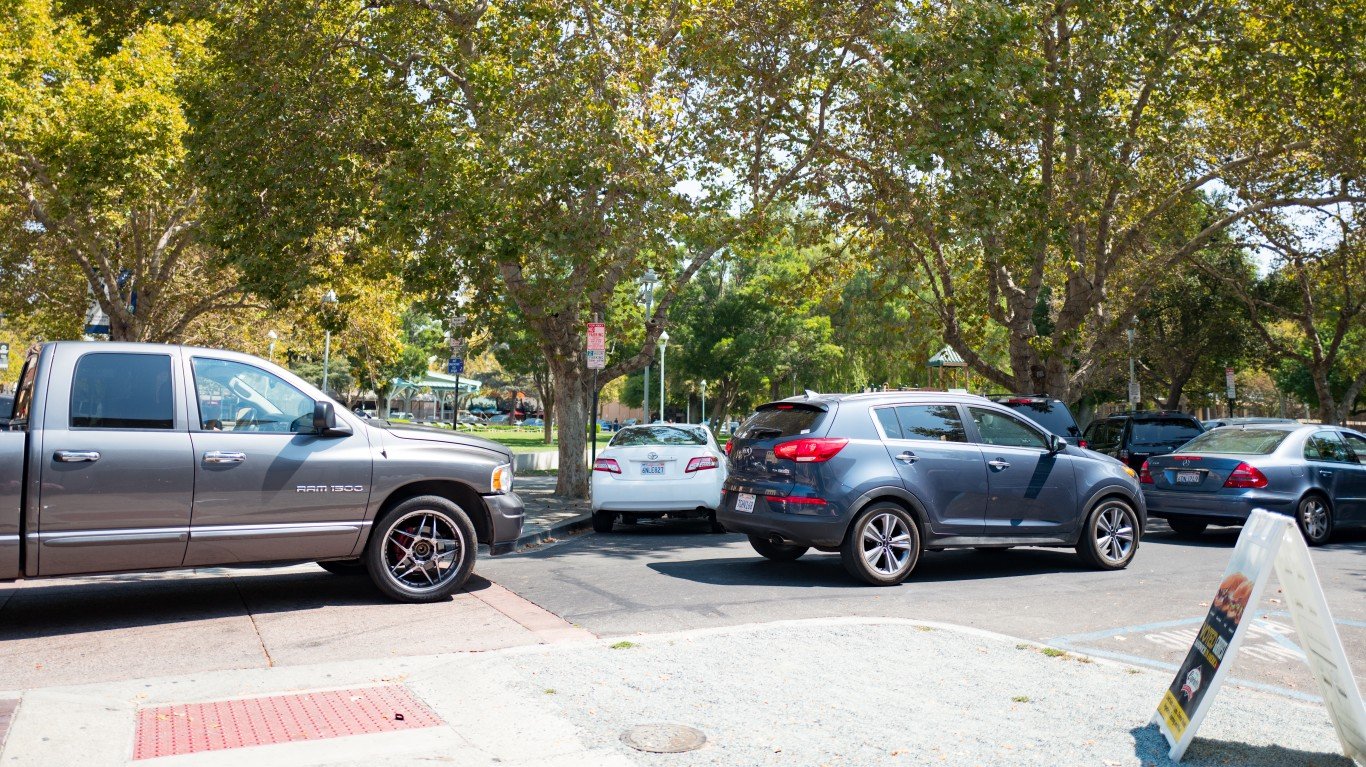
16. Concord, CA
> Avg. commute time lost to traffic delays in 2022: 54 hours per driver
> Change in traffic delays from 2021: +35%
> Avg. commute time in city: 33.9 minutes
> Commuters who drive or carpool to work: 46,887; 84.2% of commuters
 24/7 Wall St.
Source: raksyBH / iStock Editorial via Getty Images
15. Baltimore, MD
> Avg. commute time lost to traffic delays in 2022: 55 hours per driver
> Change in traffic delays from 2021: +49%
> Avg. commute time in city: 30.7 minutes
> Commuters who drive or carpool to work: 179,149; 73.9% of commuters
Source: f11photo / iStock via Getty Images
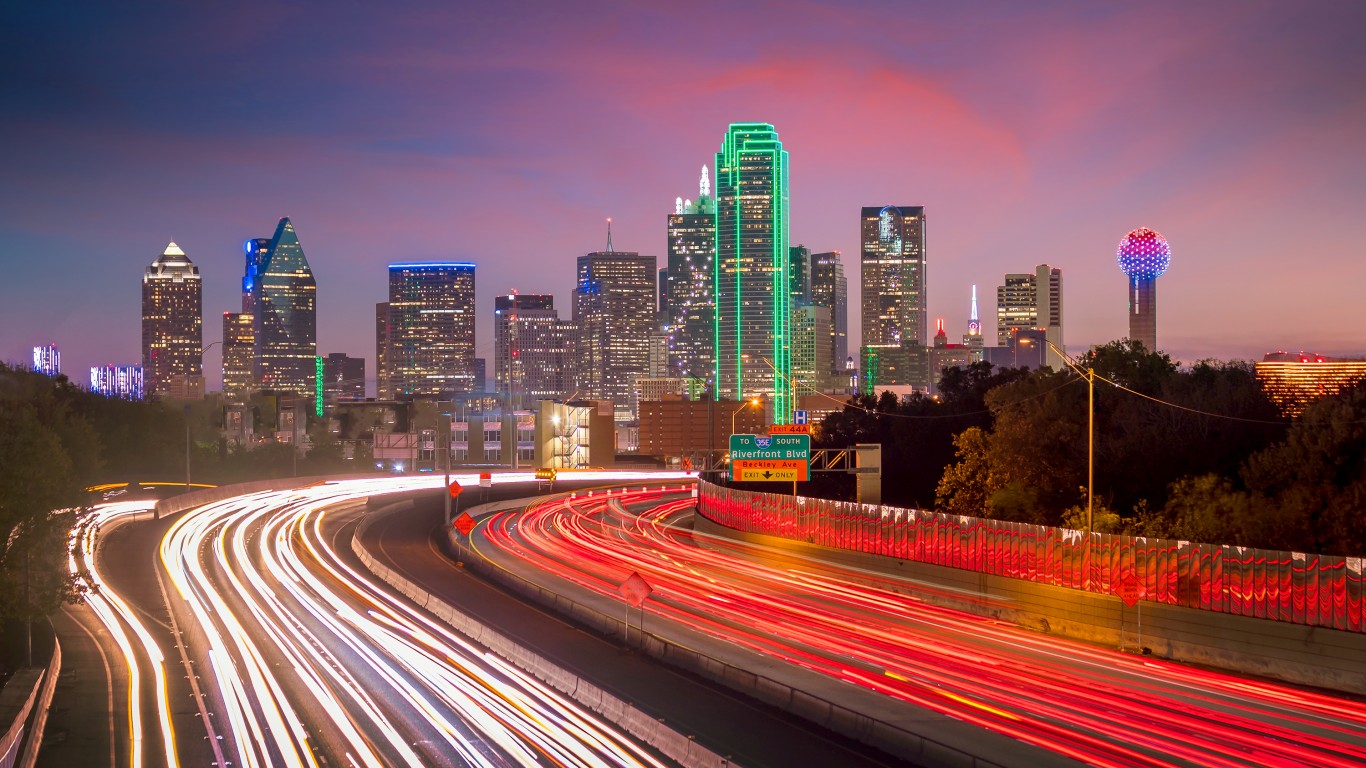
14. Dallas, TX
> Avg. commute time lost to traffic delays in 2022: 56 hours per driver
> Change in traffic delays from 2021: +28%
> Avg. commute time in city: 26.9 minutes
> Commuters who drive or carpool to work: 542,479; 92.5% of commuters
[in-text-ad-2]
Source: peeterv / iStock via Getty Images
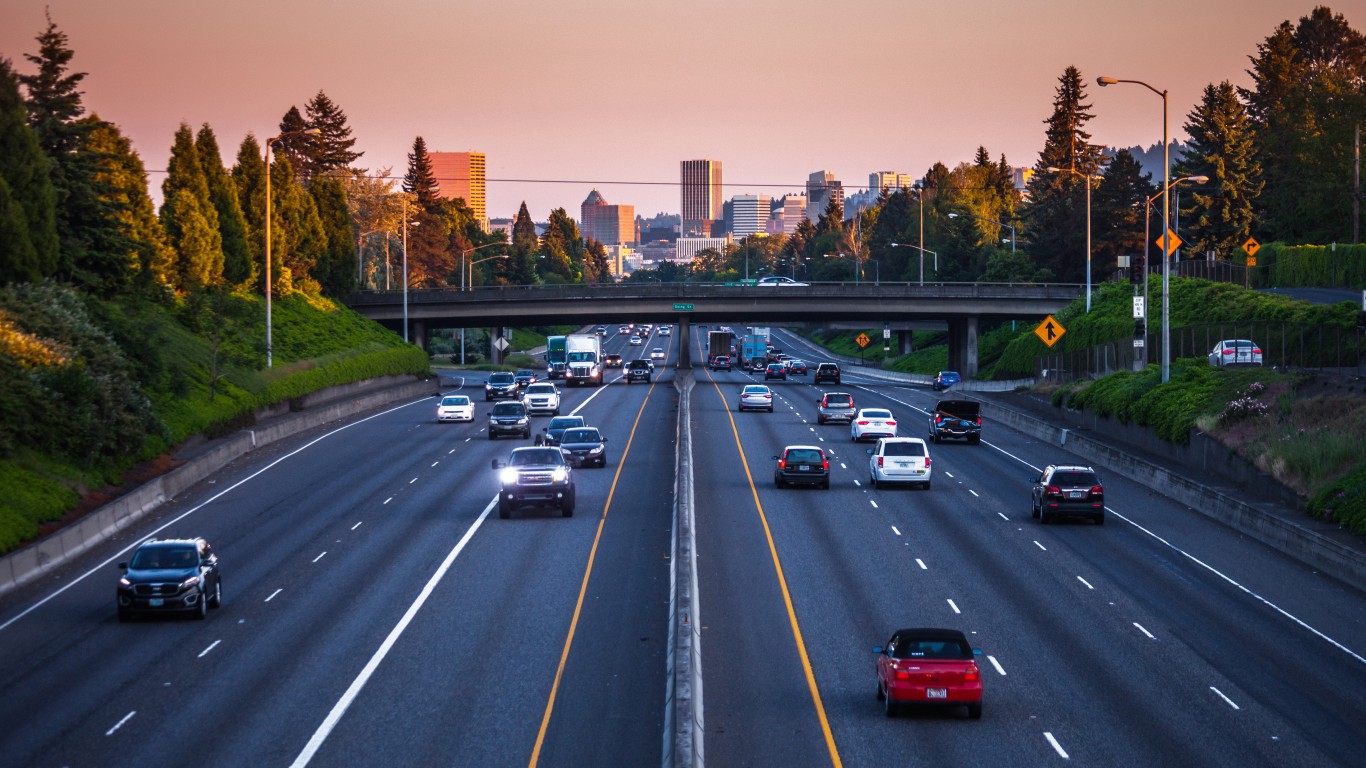
13. Portland, OR
> Avg. commute time lost to traffic delays in 2022: 72 hours per driver
> Change in traffic delays from 2021: +50%
> Avg. commute time in city: 25.5 minutes
> Commuters who drive or carpool to work: 220,404; 74.5% of commuters
Source: carminesalvatore / iStock Editorial via Getty Images
12. Stamford, CT
> Avg. commute time lost to traffic delays in 2022: 73 hours per driver
> Change in traffic delays from 2021: +59%
> Avg. commute time in city: 28.4 minutes
> Commuters who drive or carpool to work: 52,207; 80.0% of commuters
[in-text-ad]
Source: LUNAMARINA / iStock via Getty Images
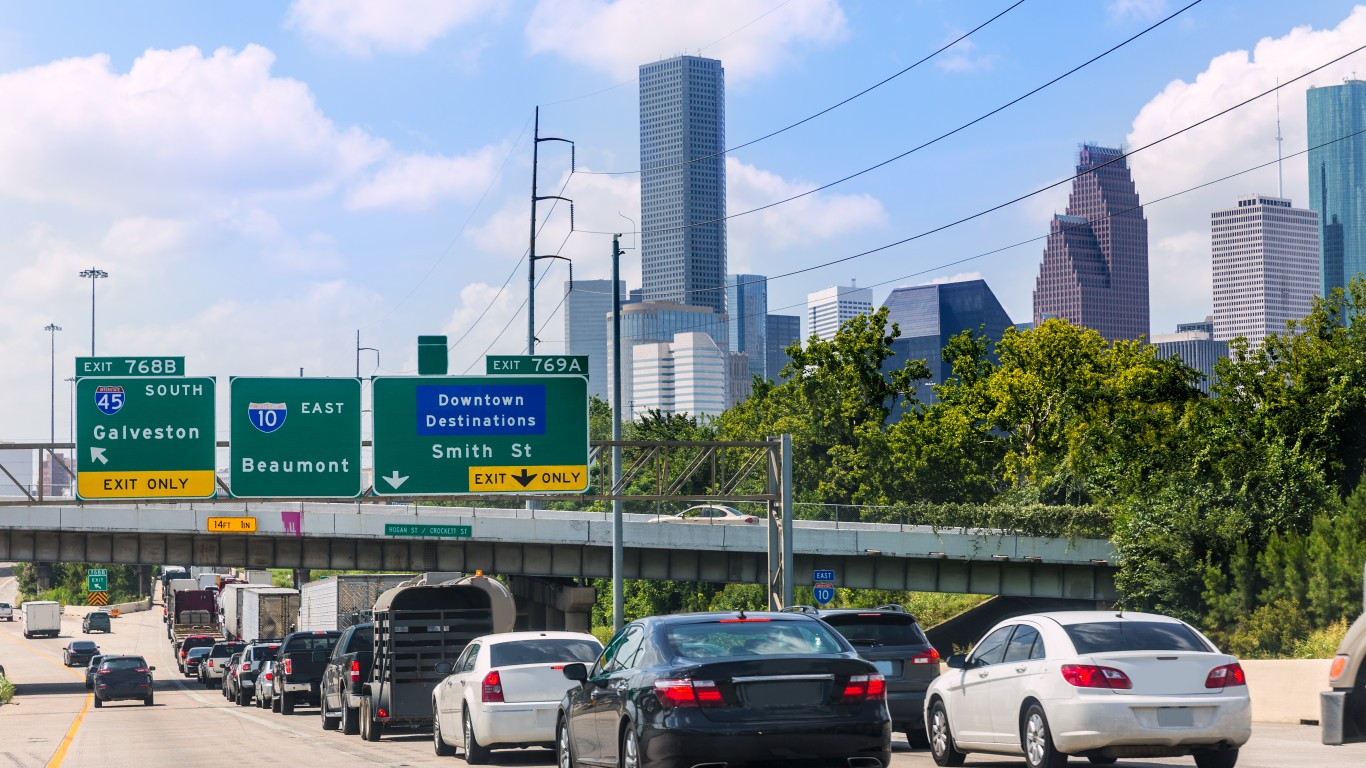
11. Houston, TX
> Avg. commute time lost to traffic delays in 2022: 74 hours per driver
> Change in traffic delays from 2021: +28%
> Avg. commute time in city: 27.5 minutes
> Commuters who drive or carpool to work: 912,664; 91.0% of commuters
 24/7 Wall St.
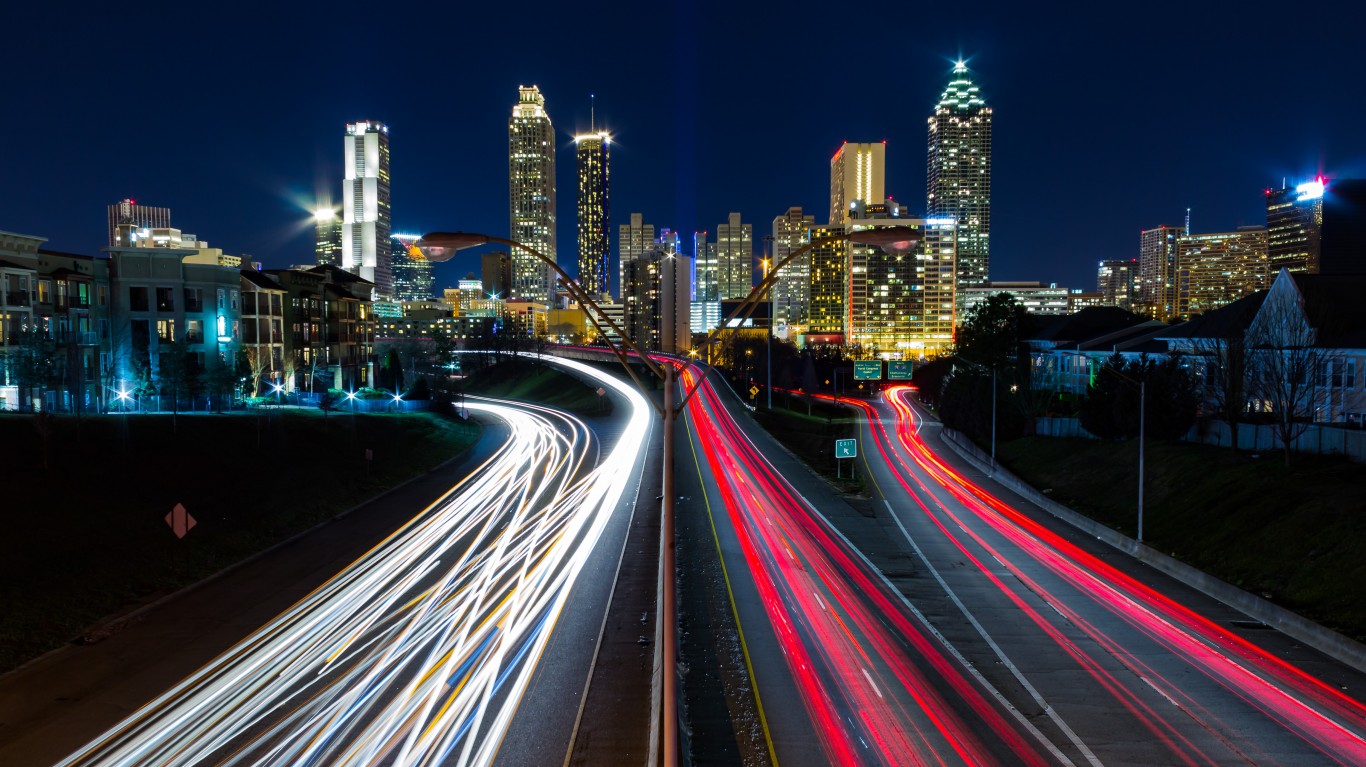
Source: red7255 / iStock via Getty Images
10. Atlanta, GA
> Avg. commute time lost to traffic delays in 2022: 74 hours per driver
> Change in traffic delays from 2021: +40%
> Avg. commute time in city: 27.8 minutes
> Commuters who drive or carpool to work: 163,636; 79.4% of commuters
Source: UWMadison / iStock via Getty Images
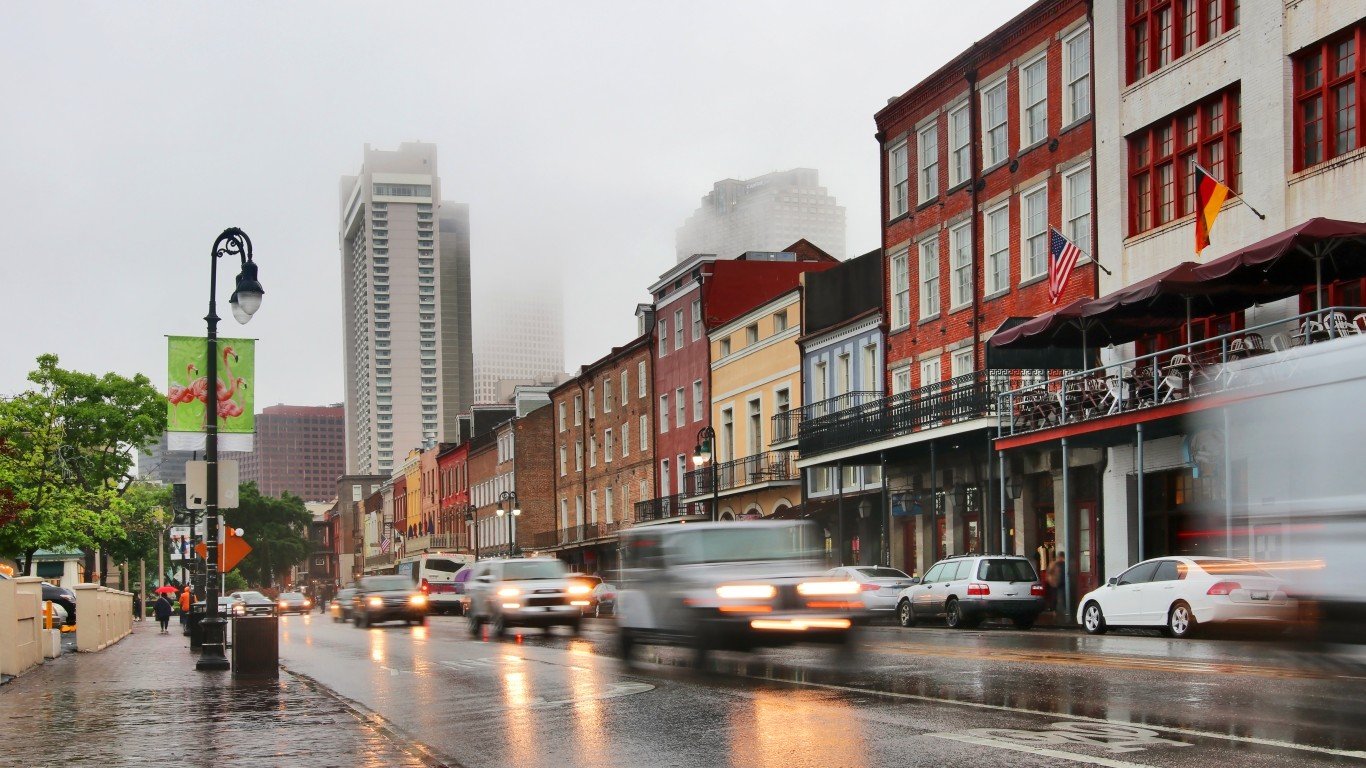
9. New Orleans, LA
> Avg. commute time lost to traffic delays in 2022: 77 hours per driver
> Change in traffic delays from 2021: +22%
> Avg. commute time in city: 23.5 minutes
> Commuters who drive or carpool to work: 128,457; 82.7% of commuters
[in-text-ad-2]
Source: burwellphotography / E+ via Getty Images
8. Washington, DC
> Avg. commute time lost to traffic delays in 2022: 83 hours per driver
> Change in traffic delays from 2021: +88%
> Avg. commute time in city: 30.4 minutes
> Commuters who drive or carpool to work: 131,329; 44.2% of commuters
Source: Ron and Patty Thomas / E+ via Getty Images
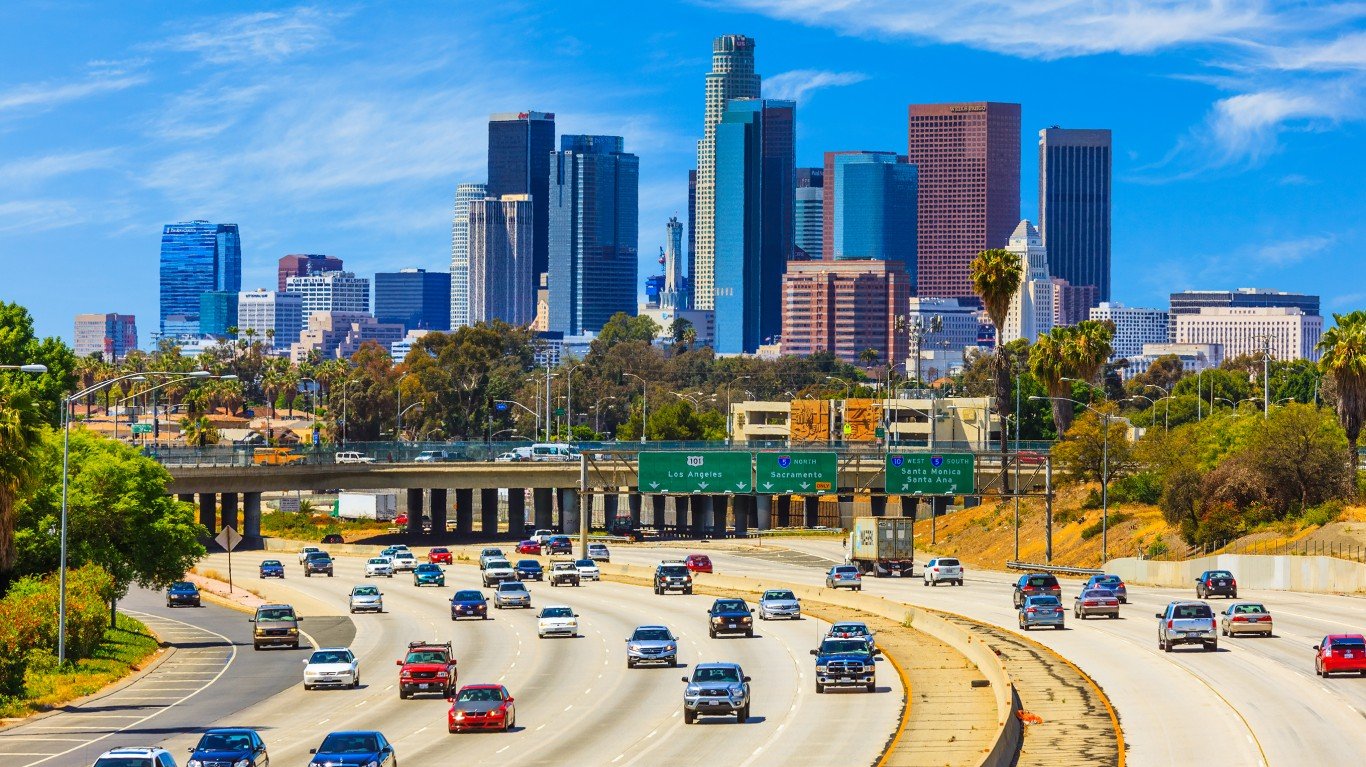
7. Los Angeles, CA
> Avg. commute time lost to traffic delays in 2022: 95 hours per driver
> Change in traffic delays from 2021: +53%
> Avg. commute time in city: 31.6 minutes
> Commuters who drive or carpool to work: 1,415,870; 84.6% of commuters
[in-text-ad]
Source: Sundry Photography / iStock Editorial via Getty Images
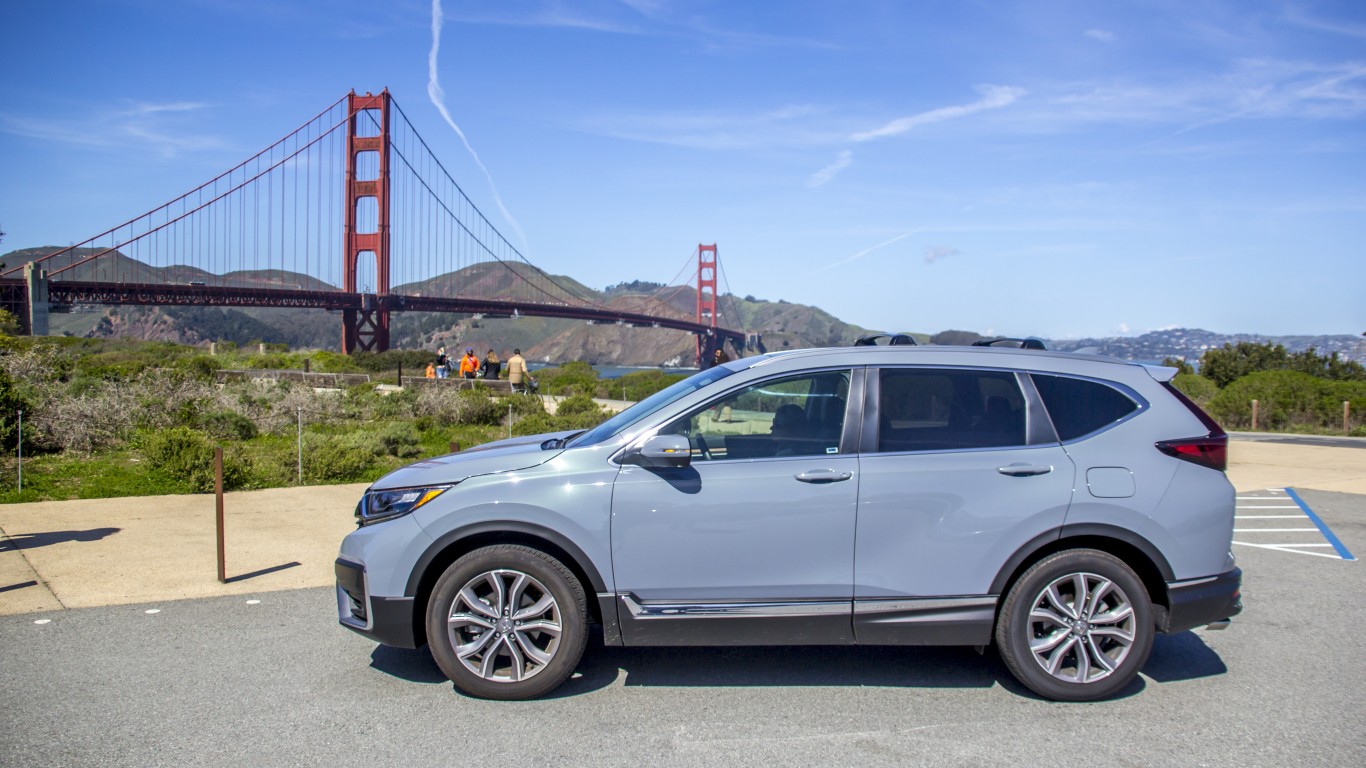
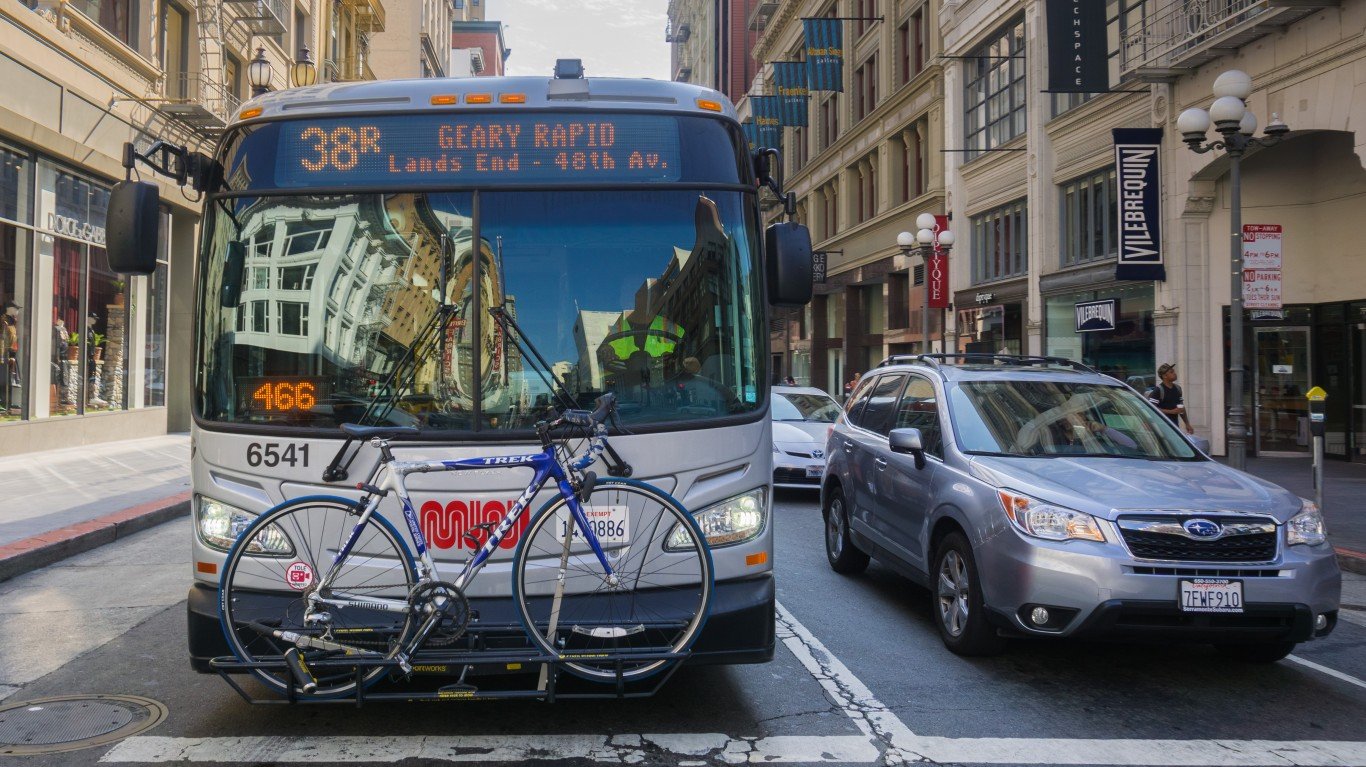
6. San Francisco, CA
> Avg. commute time lost to traffic delays in 2022: 97 hours per driver
> Change in traffic delays from 2021: +52%
> Avg. commute time in city: 32.8 minutes
> Commuters who drive or carpool to work: 179,667; 43.8% of commuters
Source: wsfurlan / iStock via Getty Images
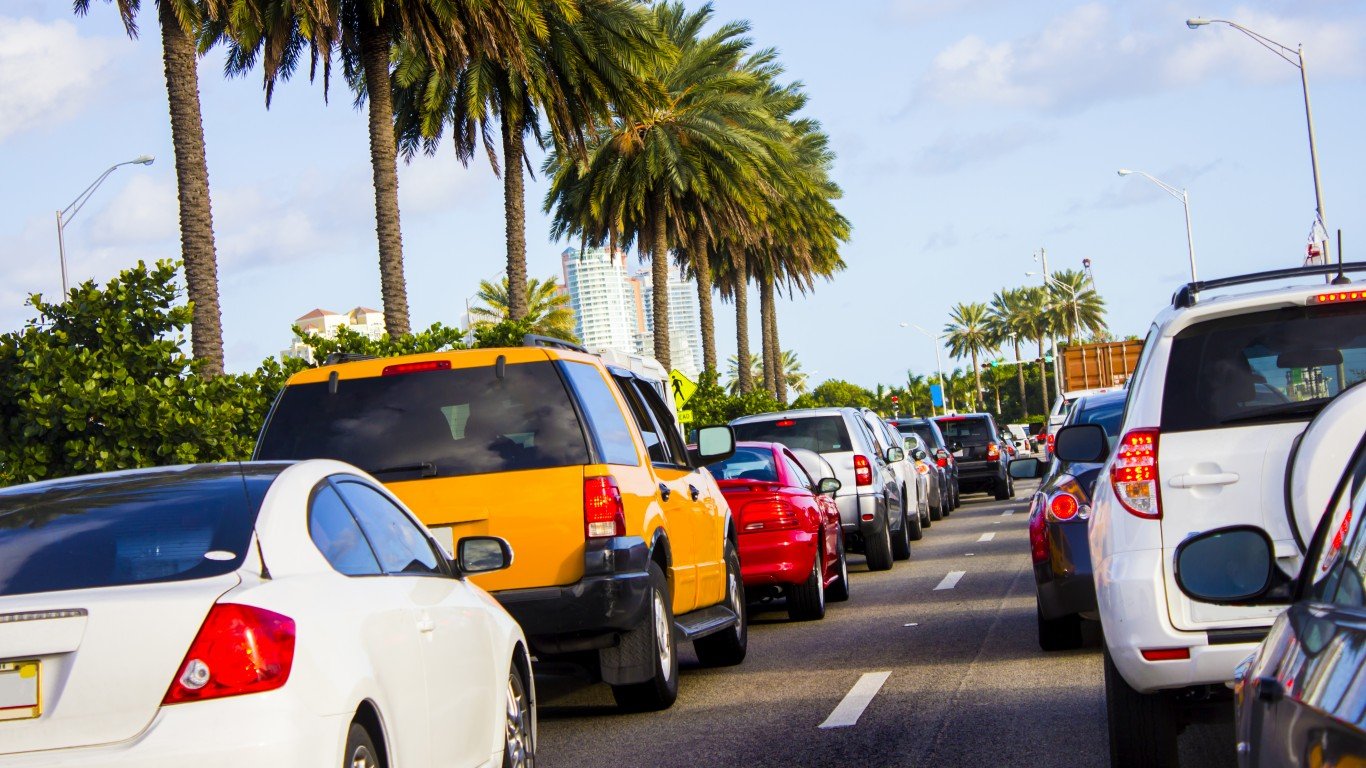
5. Miami, FL
> Avg. commute time lost to traffic delays in 2022: 105 hours per driver
> Change in traffic delays from 2021: +59%
> Avg. commute time in city: 28.0 minutes
> Commuters who drive or carpool to work: 165,042; 81.8% of commuters
Source: peeterv / iStock via Getty Images
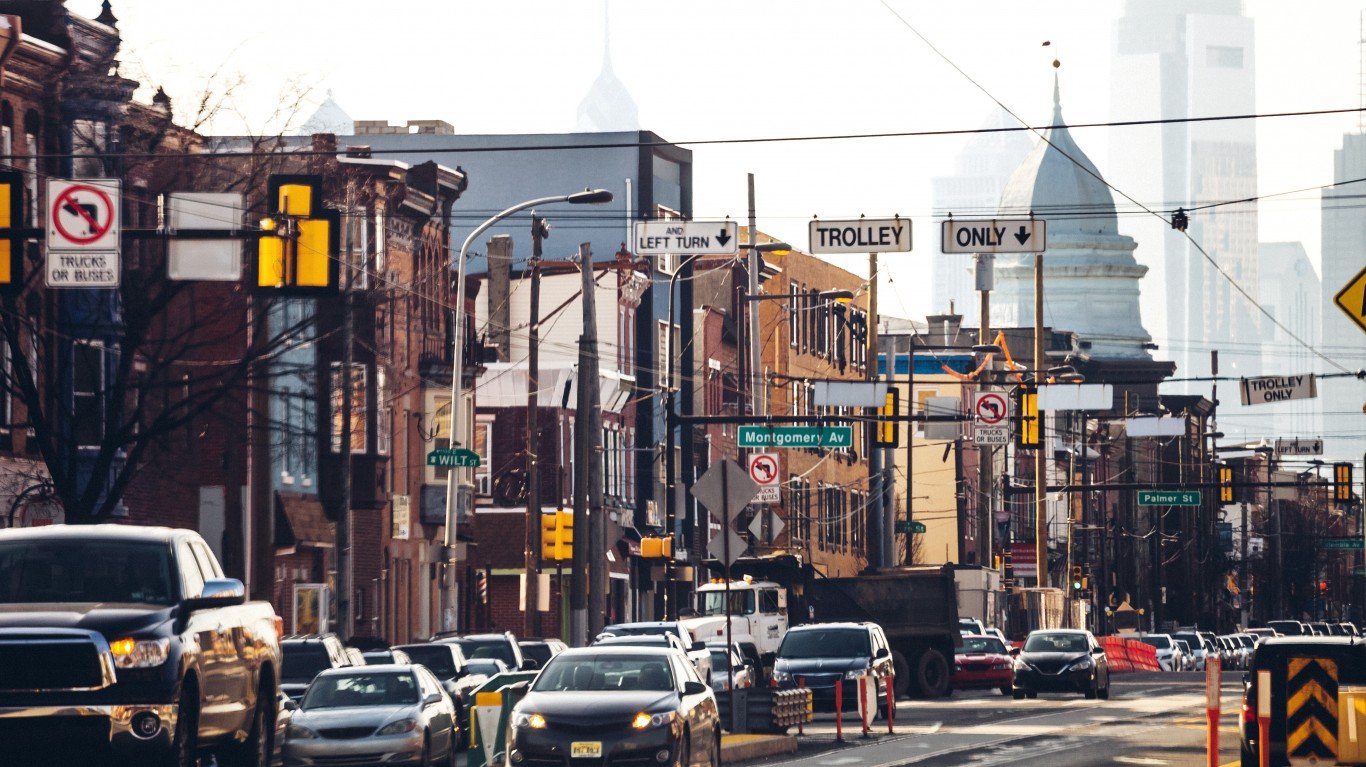
4. Philadelphia, PA
> Avg. commute time lost to traffic delays in 2022: 114 hours per driver
> Change in traffic delays from 2021: +27%
> Avg. commute time in city: 33.0 minutes
> Commuters who drive or carpool to work: 399,184; 62.9% of commuters
[in-text-ad-2]
Source: batuhanozdel / iStock via Getty Images
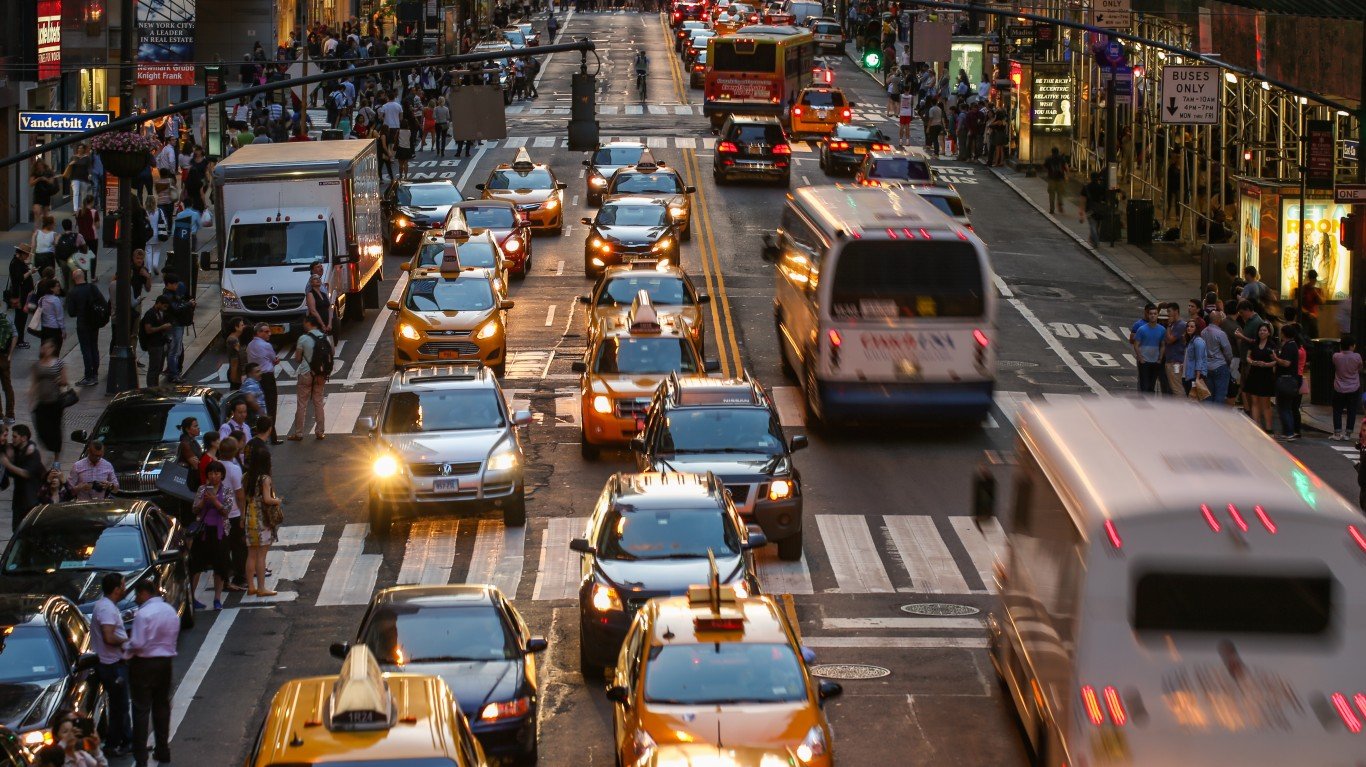
3. New York, NY
> Avg. commute time lost to traffic delays in 2022: 117 hours per driver
> Change in traffic delays from 2021: +15%
> Avg. commute time in city: 41.4 minutes
> Commuters who drive or carpool to work: 1,082,647; 30.0% of commuters
Source: DenisTangneyJr / E+ via Getty Images
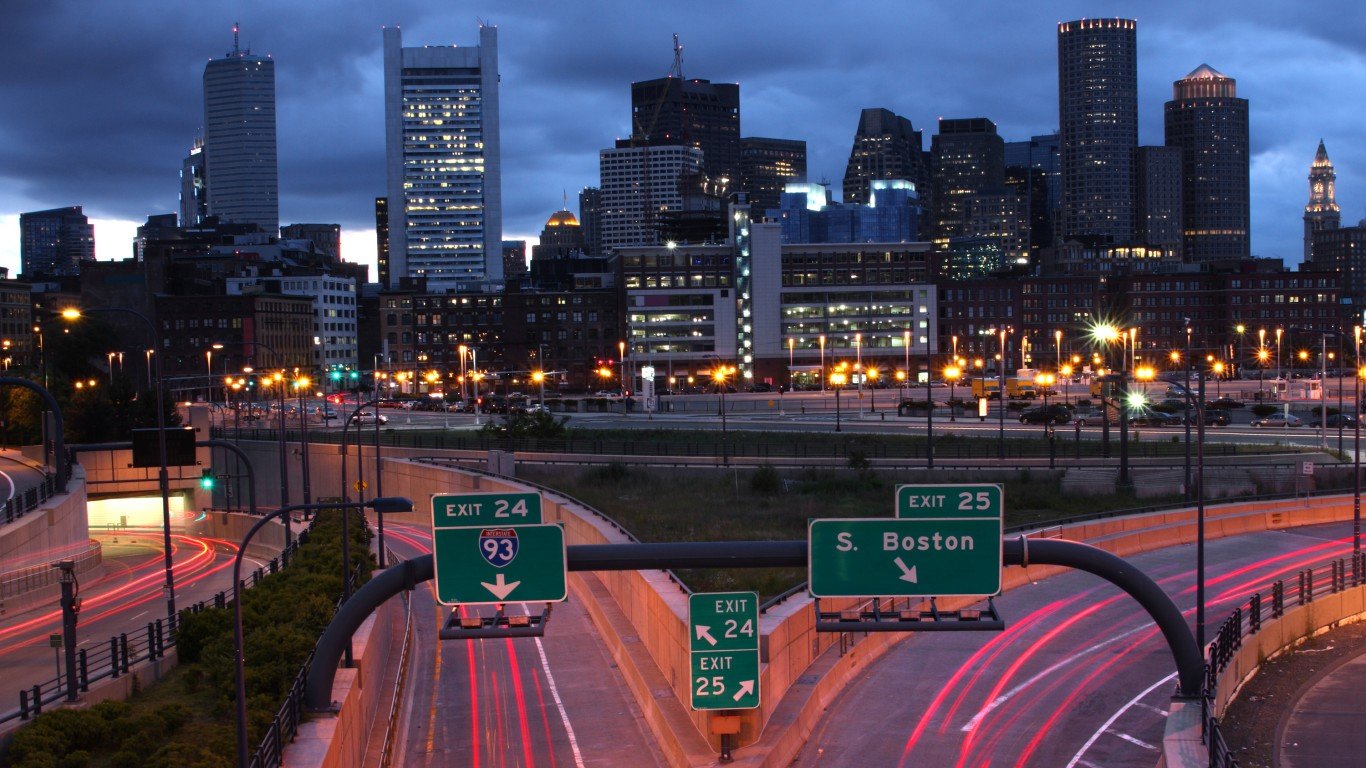
2. Boston, MA
> Avg. commute time lost to traffic delays in 2022: 134 hours per driver
> Change in traffic delays from 2021: +72%
> Avg. commute time in city: 30.6 minutes
> Commuters who drive or carpool to work: 151,856; 47.3% of commuters
[in-text-ad]
Source: chrisp0 / E+ via Getty Images
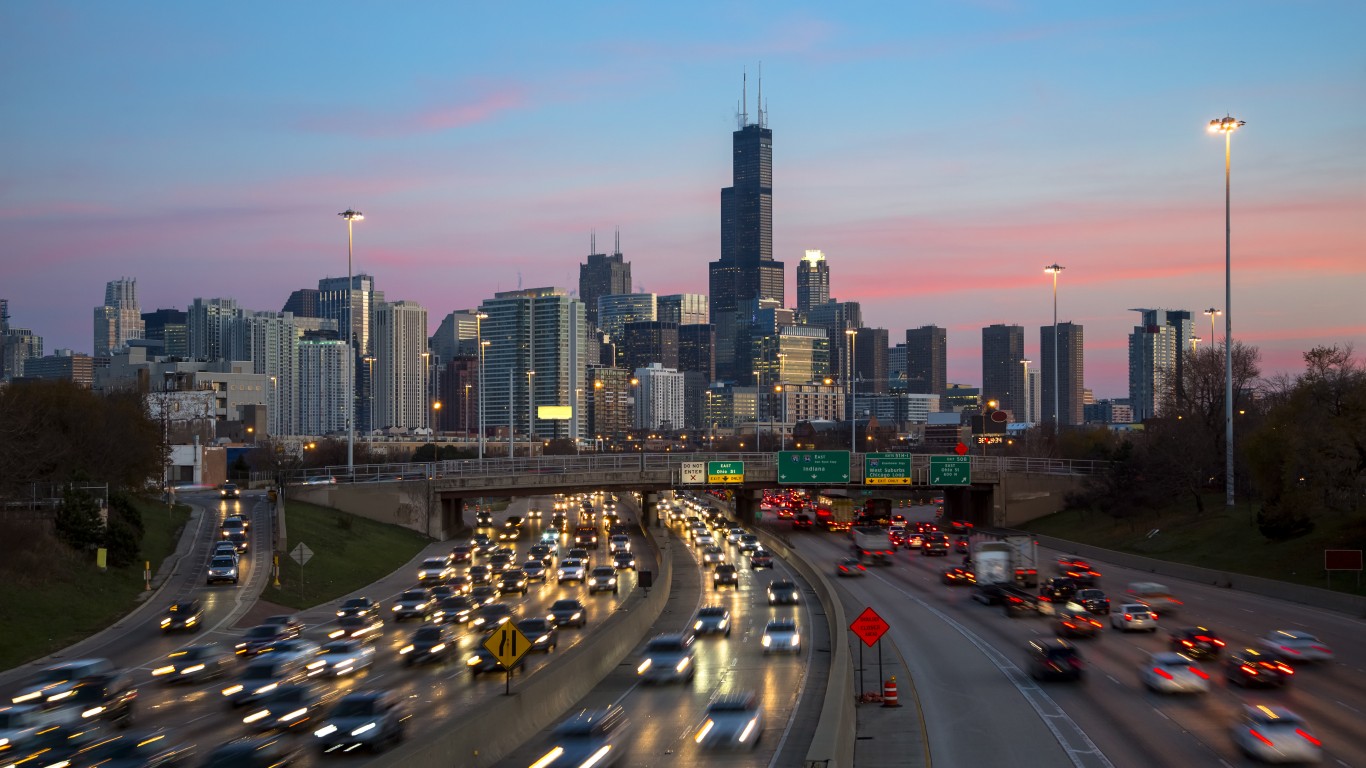
1. Chicago, IL
> Avg. commute time lost to traffic delays in 2022: 155 hours per driver
> Change in traffic delays from 2021: +49%
> Avg. commute time in city: 34.4 minutes
> Commuters who drive or carpool to work: 743,250; 62.7% of commuters
Methodology
To identify the cities with the worst traffic, 24/7 Wall St. reviewed data from the 2022 Global Traffic Scorecard, from INRIX, a traffic data and analytics company. We used the average time the typical commuter lost to traffic congestion in 2022 in the 292 U.S. cities with available data. Only the 32 U.S. cities where the typical commuter spent 30 or more hours sitting in traffic in 2022 are ranked. In the case of a tie, the city with the longer average commute time ranks lower.
Supplementary data on average commute time for those not working from home and the number and share of commuters who drive or carpool to work are five-year estimates from the U.S. Census Bureau’s 2021 American Community Survey.
Data on change in the average traffic delays from 2021 is also from INRIX.
Essential Tips for Investing: Sponsored
A financial advisor can help you understand the advantages and disadvantages of investment properties. Finding a qualified financial advisor doesn’t have to be hard. SmartAsset’s free tool matches you with up to three financial advisors who serve your area, and you can interview your advisor matches at no cost to decide which one is right for you. If you’re ready to find an advisor who can help you achieve your financial goals, get started now.
Investing in real estate can diversify your portfolio. But expanding your horizons may add additional costs. If you’re an investor looking to minimize expenses, consider checking out online brokerages. They often offer low investment fees, helping you maximize your profit.
Thank you for reading! Have some feedback for us?
Contact the 24/7 Wall St. editorial team.
Editors' Picks