
Close to 3 million people fly into and out of U.S. airports every day, according to the Federal Aviation Authority. There are 5,082 public airports in the U.S. and 5,400 airplanes over U.S. airspace at peak times. The air travel system is vast and complex, and getting travelers through the airport, onto the airplane, and safely to their destination requires many workers at different levels and many processes functioning properly. (These are the busiest airports in the world.)
While paying customers understand the complexities of air travel and are mostly familiar with the different required procedures, they also have a reasonable expectation that going through the airport will be at the very least a neutral experience rather than an aggravating one. In an ideal world, we would show up to the airport, check in our bags with minimal frustration, get through security without a lengthy wait, board the plane without too much of a hassle, and take off without too many delays. Similarly, we would expect the same when we land.
At America’s best airports, travelers not only get all of the above, but some creature comforts are thrown in, too. Dining options are good and plentiful. There are plenty of places to sit and conveniently-placed chargers. The terminals are modern and thoughtfully-designed with passenger comfort in mind. At America’s worst airports, all of that goes out the window. (Also see, these are the best and worst airlines for getting to your destination on time.)
To determine the worst airports in America, 24/7 Wall St. reviewed J.D. Power’s 2022 North America Airport Satisfaction Study, which scored U.S. and Canadian airports by air travelers satisfaction, grouping airports into three categories: mega, large, and medium. The airports listed here are those that scored below the average in their respective size category. The 10 worst mega, nine worst large, and seven worst medium U.S. airports are listed here, ranked by customer satisfaction score (out of 1,000).
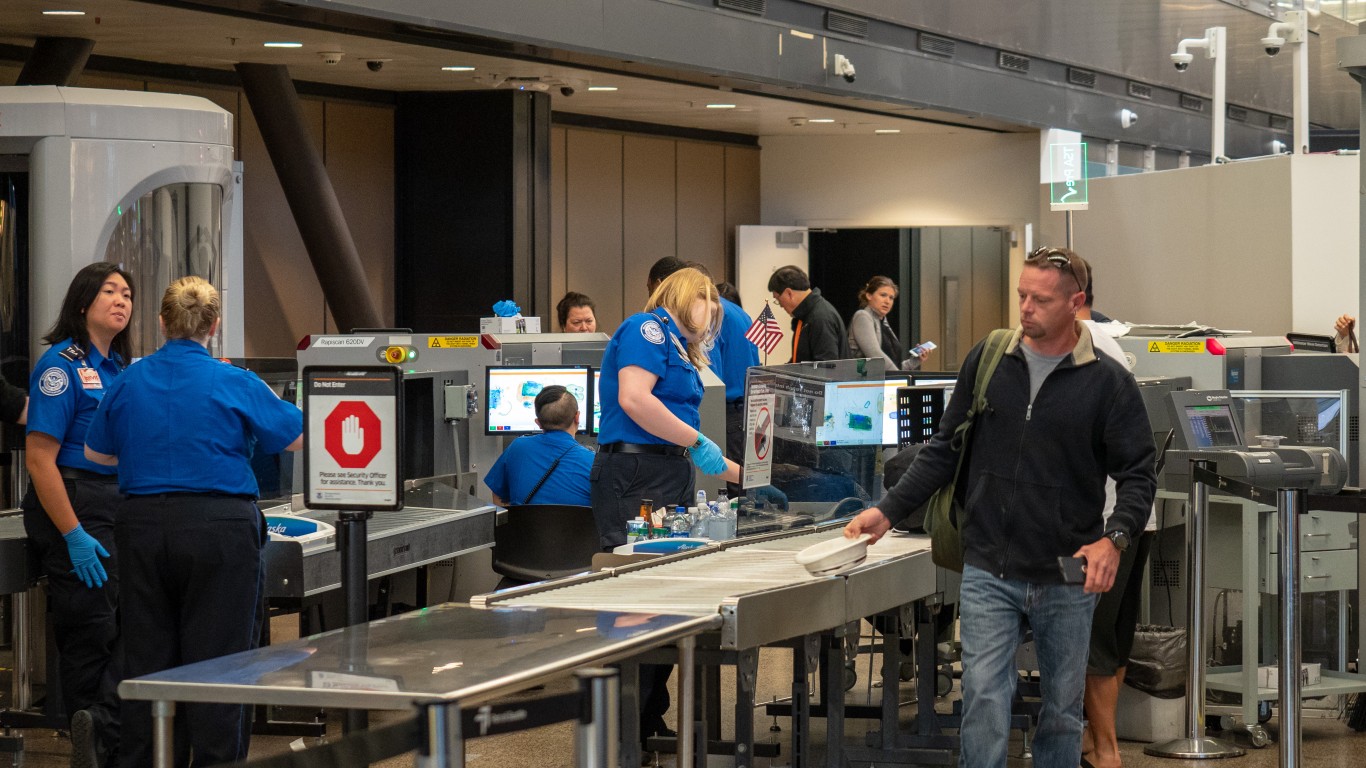
J.D. Power’s study measured terminal facilities; airport arrival/departure; baggage claim; security check; check-in/baggage check; and food, beverage and retail. Mega airports are defined as those with 33 million or more passengers per year; large airports handle 10 million to 32.9 million annual passengers; and medium airports 4.5 million to 9.9 million annual passengers.
According to the study, overall customer satisfaction declined in 2022 after reaching an all-time high in 2021, when air travel was still a fraction of pre-pandemic volumes. With volumes back to 91% of pre-pandemic norms and staff shortages causing delays and cancellations, customer satisfaction declined 25 points (on a 1,000-point scale) in 2022 compared to 2021.
From interminable security wait times to lengthy delays, these are the worst airports in America. If you happen to find yourself flying into or out of any of these, prepare yourself.
Click here to see the worst airports in America for customer satisfaction.
Click here to read our detailed methodology.
Mega Airports
Source: Philip Rozenski / iStock Editorial via Getty Images
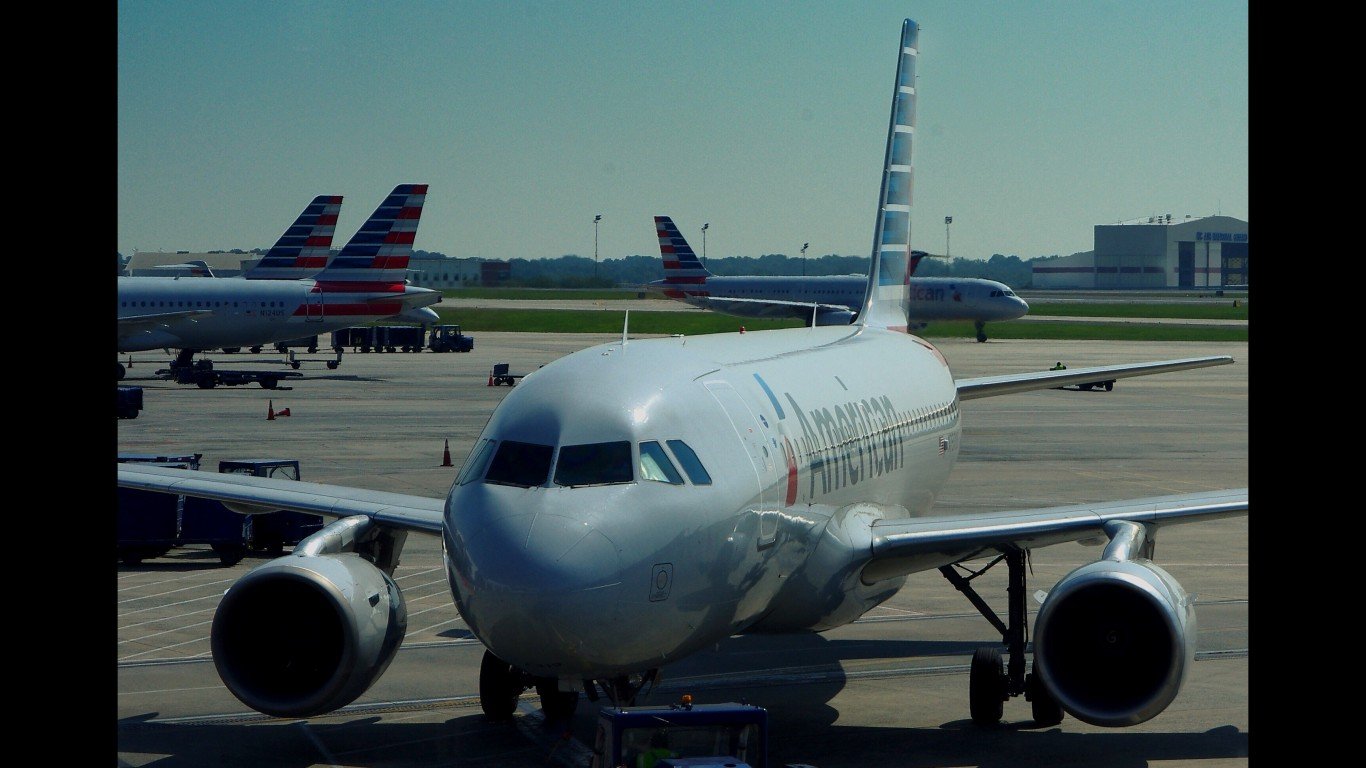
10. Charlotte Douglas International Airport
> Customer satisfaction index rating: 768 (mega airports avg.: 769)
> Avg. security wait time: 16.1 minutes
> Pct. on-time arrivals, June 2022: 71.8%
> Pct. on-time departures, June 2022: 67.6%
> Total departing passengers, 2021: 20,900,875
[in-text-ad]
Source: BCFC / iStock Editorial via Getty Images
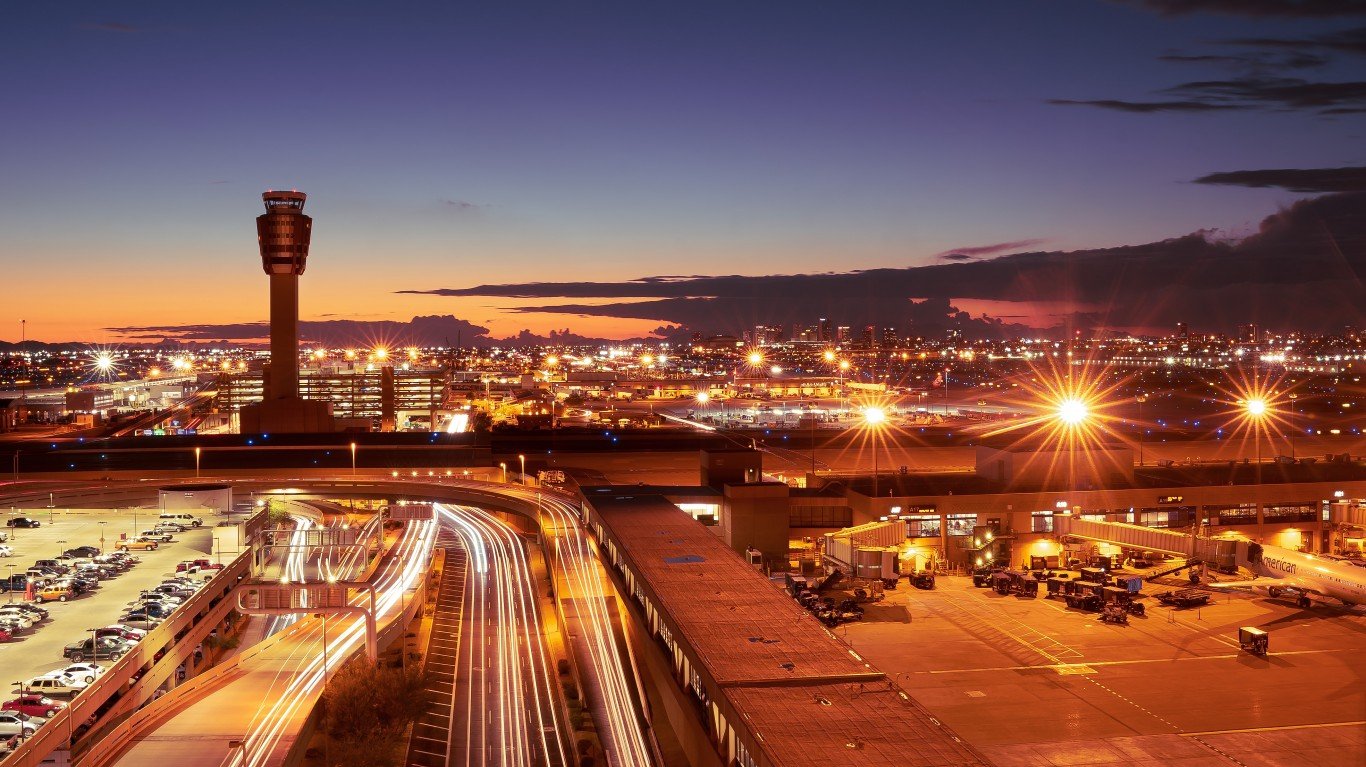
9. Phoenix Sky Harbor International Airport
> Customer satisfaction index rating: 765 (mega airports avg.: 769)
> Avg. security wait time: 7.7 minutes
> Pct. on-time arrivals, June 2022: 73.2%
> Pct. on-time departures, June 2022: 69.4%
> Total departing passengers, 2021: 18,940,287
 24/7 Wall St.
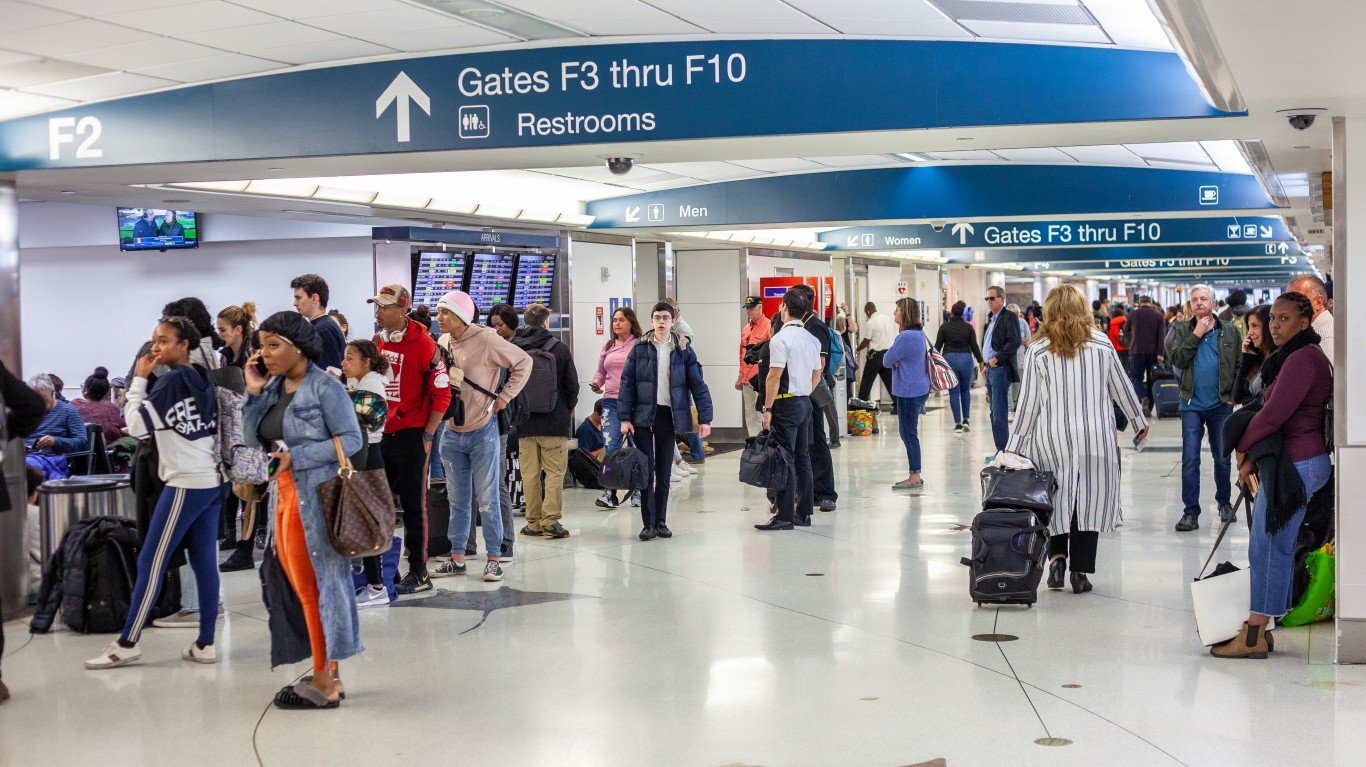
Source: Daxus / iStock Unreleased via Getty Images
8. Fort Lauderdale-Hollywood International Airport
> Customer satisfaction index rating: 764 (mega airports avg.: 769)
> Avg. security wait time: 10.5 minutes
> Pct. on-time arrivals, June 2022: 67.8%
> Pct. on-time departures, June 2022: 65.8%
> Total departing passengers, 2021: 13,598,994
Source: David Tran / Getty Images
7. Seattle-Tacoma International Airport
> Customer satisfaction index rating: 764 (mega airports avg.: 769)
> Avg. security wait time: 14.0 minutes
> Pct. on-time arrivals, June 2022: 79.3%
> Pct. on-time departures, June 2022: 80.7%
> Total departing passengers, 2021: 17,430,195
[in-text-ad-2]
Source: IMNATURE / iStock via Getty Images
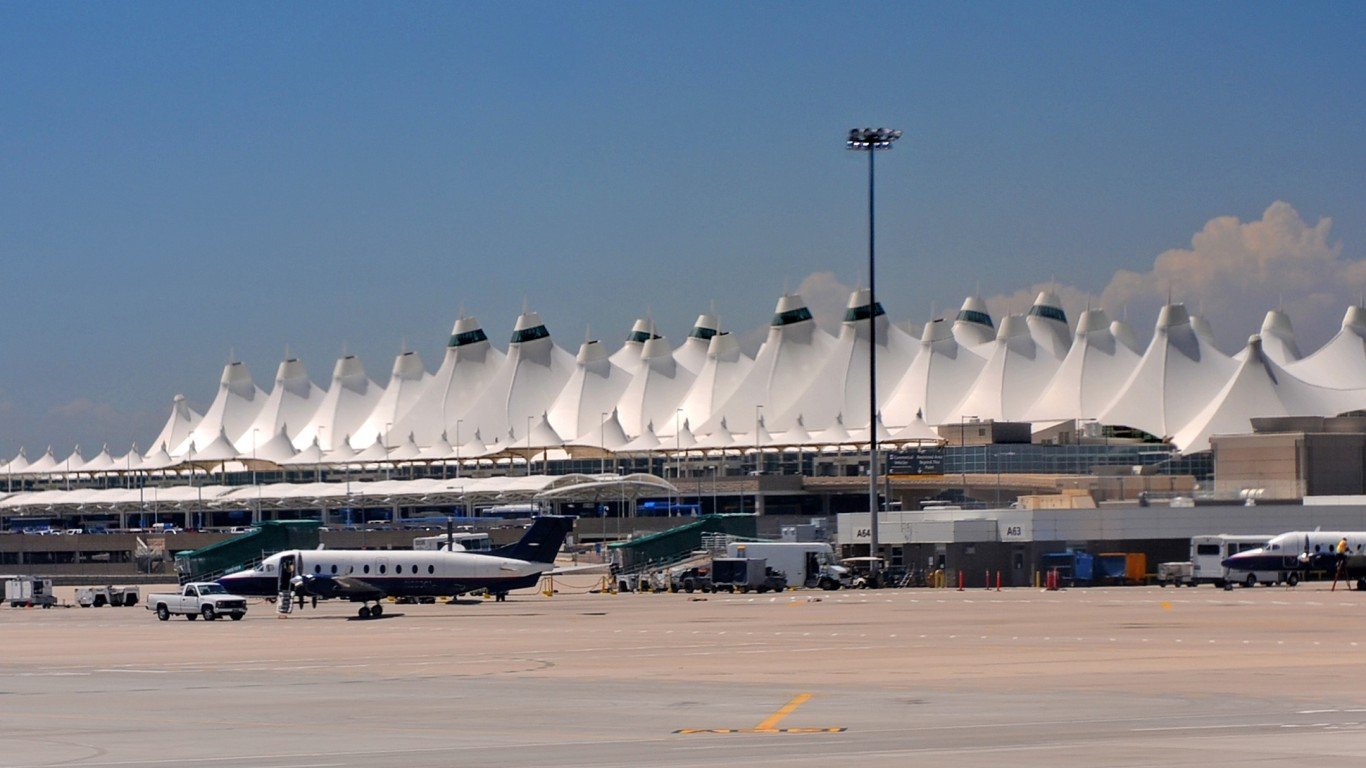
6. Denver International Airport
> Customer satisfaction index rating: 759 (mega airports avg.: 769)
> Avg. security wait time: 11.3 minutes
> Pct. on-time arrivals, June 2022: 76.4%
> Pct. on-time departures, June 2022: 68.6%
> Total departing passengers, 2021: 28,645,527
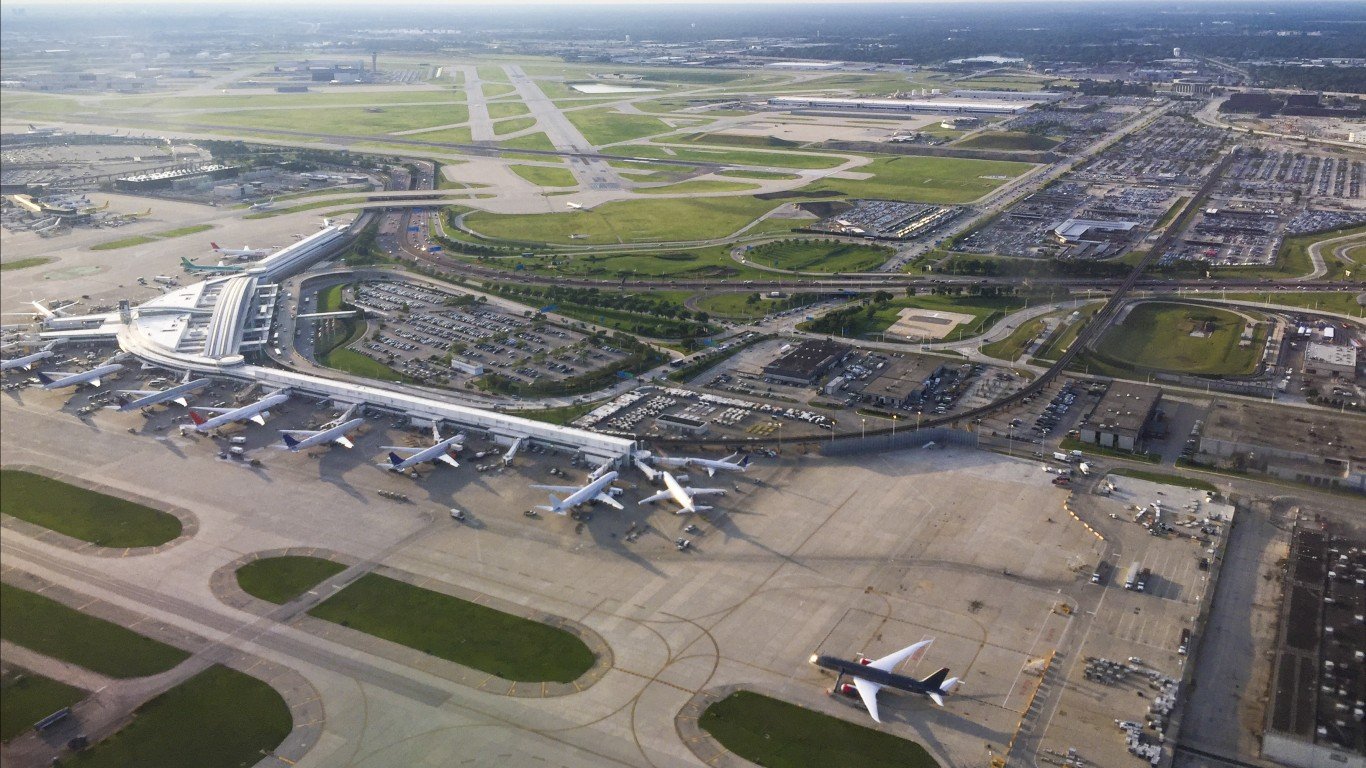
Source: photovs / iStock Editorial via Getty Images
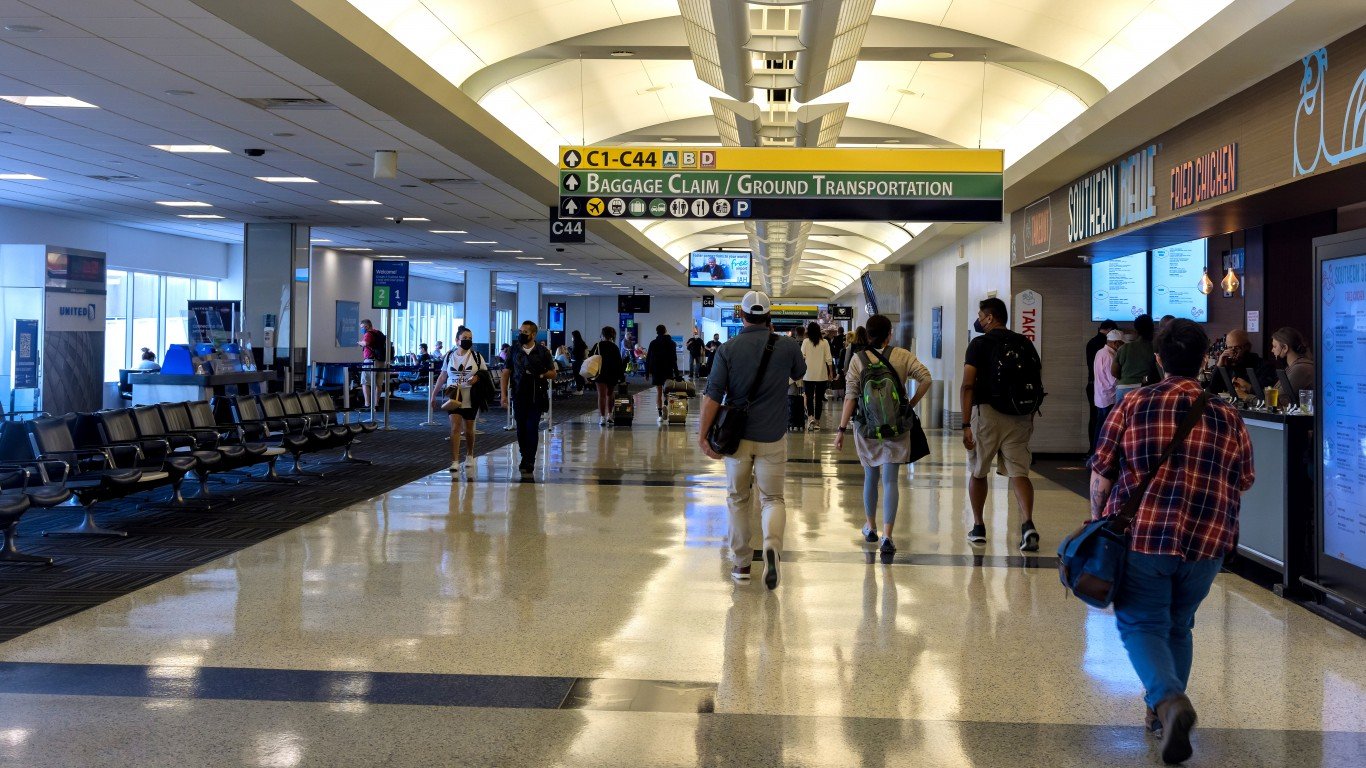
5. George Bush International Airport (Houston, Texas)
> Customer satisfaction index rating: 758 (mega airports avg.: 769)
> Avg. security wait time: 12.4 minutes
> Pct. on-time arrivals, June 2022: 81.1%
> Pct. on-time departures, June 2022: 77.2%
> Total departing passengers, 2021: 16,242,821
[in-text-ad]
Source: DenisTangneyJr / iStock via Getty Images
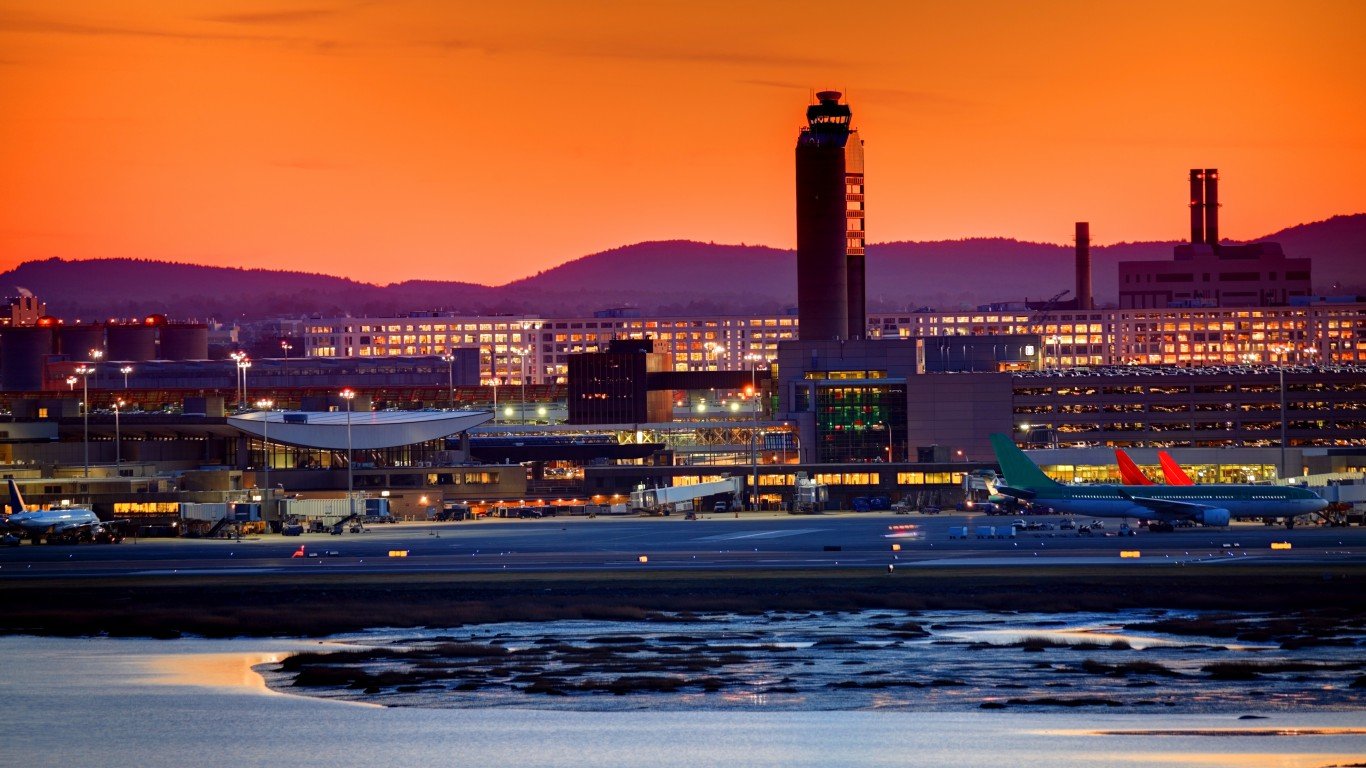
4. Boston Logan International Airport
> Customer satisfaction index rating: 754 (mega airports avg.: 769)
> Avg. security wait time: 13.2 minutes
> Pct. on-time arrivals, June 2022: 68.2%
> Pct. on-time departures, June 2022: 70.9%
> Total departing passengers, 2021: 10,909,817
 24/7 Wall St.
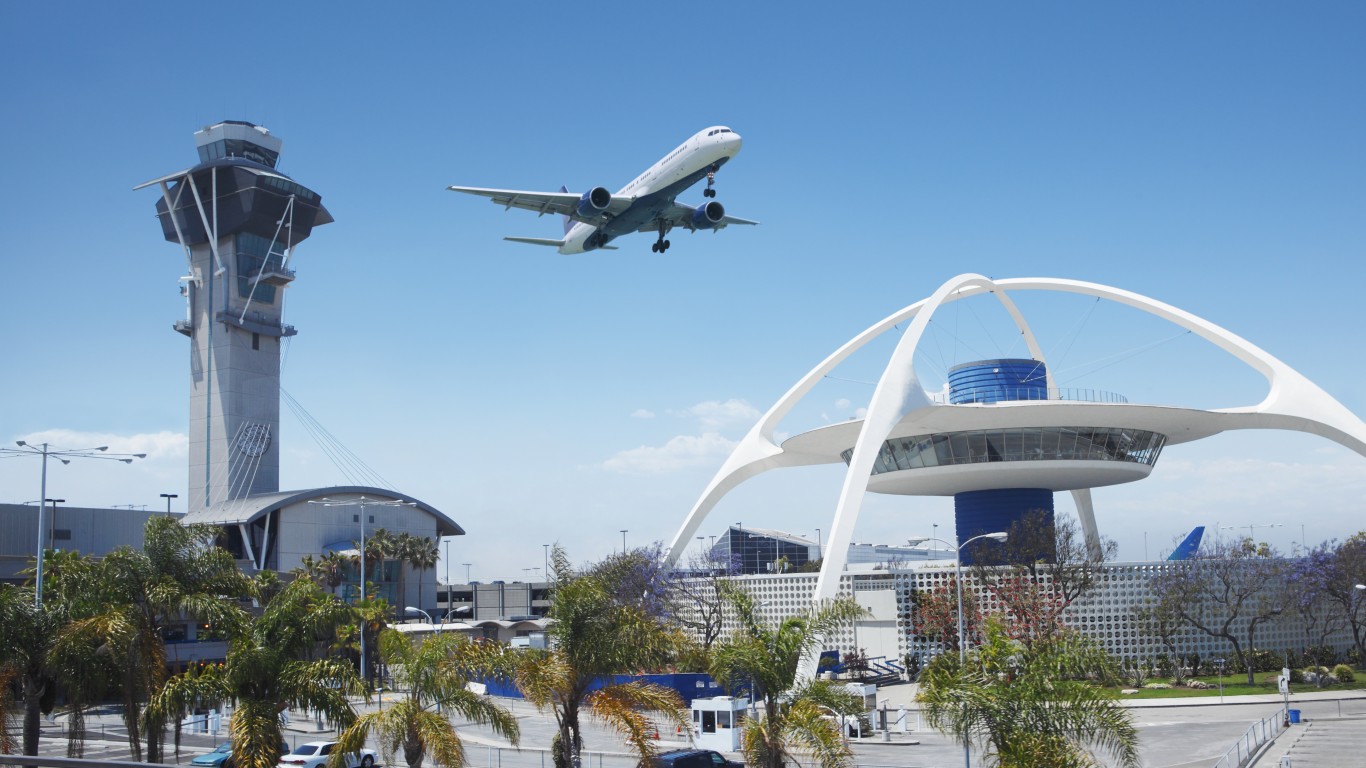
Source: narvikk / iStock via Getty Images
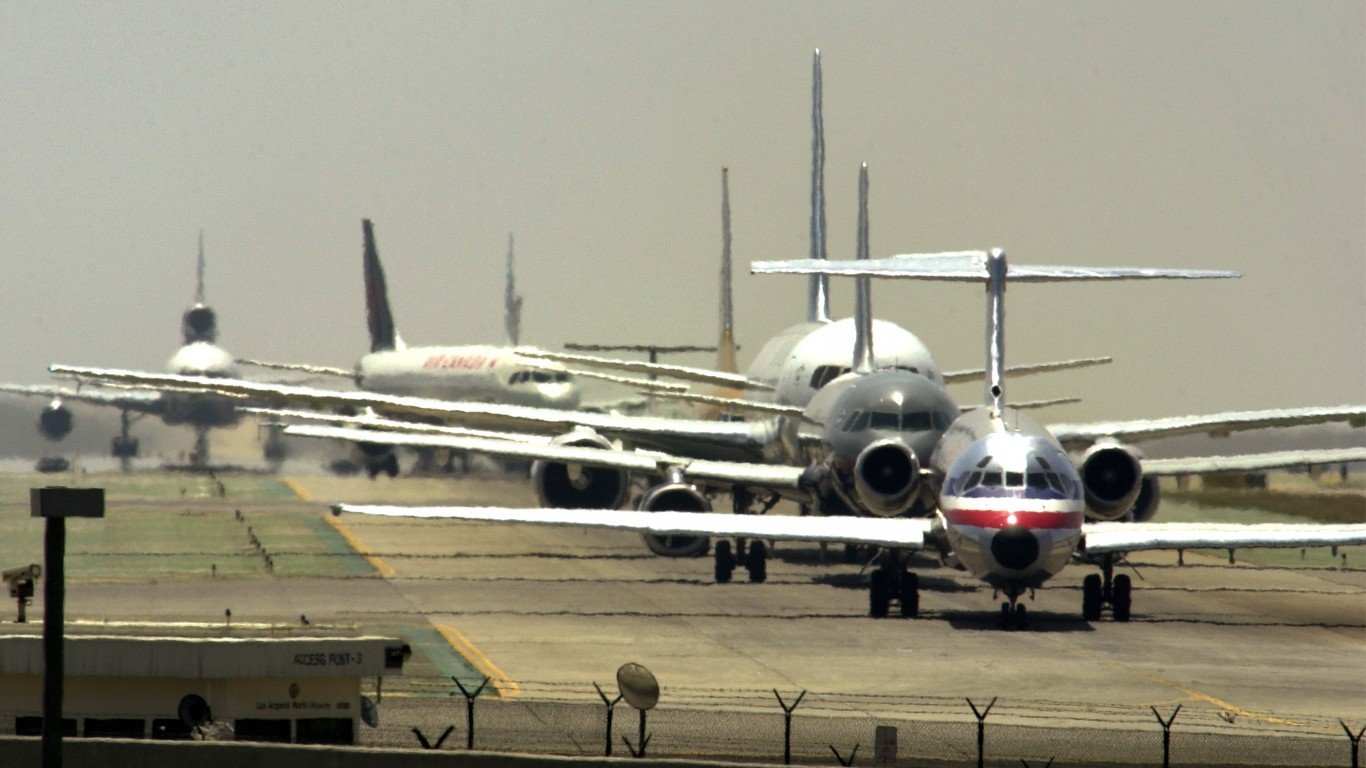
3. Los Angeles International Airport
> Customer satisfaction index rating: 753 (mega airports avg.: 769)
> Avg. security wait time: 10.7 minutes
> Pct. on-time arrivals, June 2022: 74.7%
> Pct. on-time departures, June 2022: 75.7%
> Total departing passengers, 2021: 23,663,410
Source: jmsilva / iStock via Getty Images
2. O’Hare International Airport (Chicago, Illinois)
> Customer satisfaction index rating: 751 (mega airports avg.: 769)
> Avg. security wait time: 16.7 minutes
> Pct. on-time arrivals, June 2022: 78.8%
> Pct. on-time departures, June 2022: 75.3%
> Total departing passengers, 2021: 26,350,976
[in-text-ad-2]
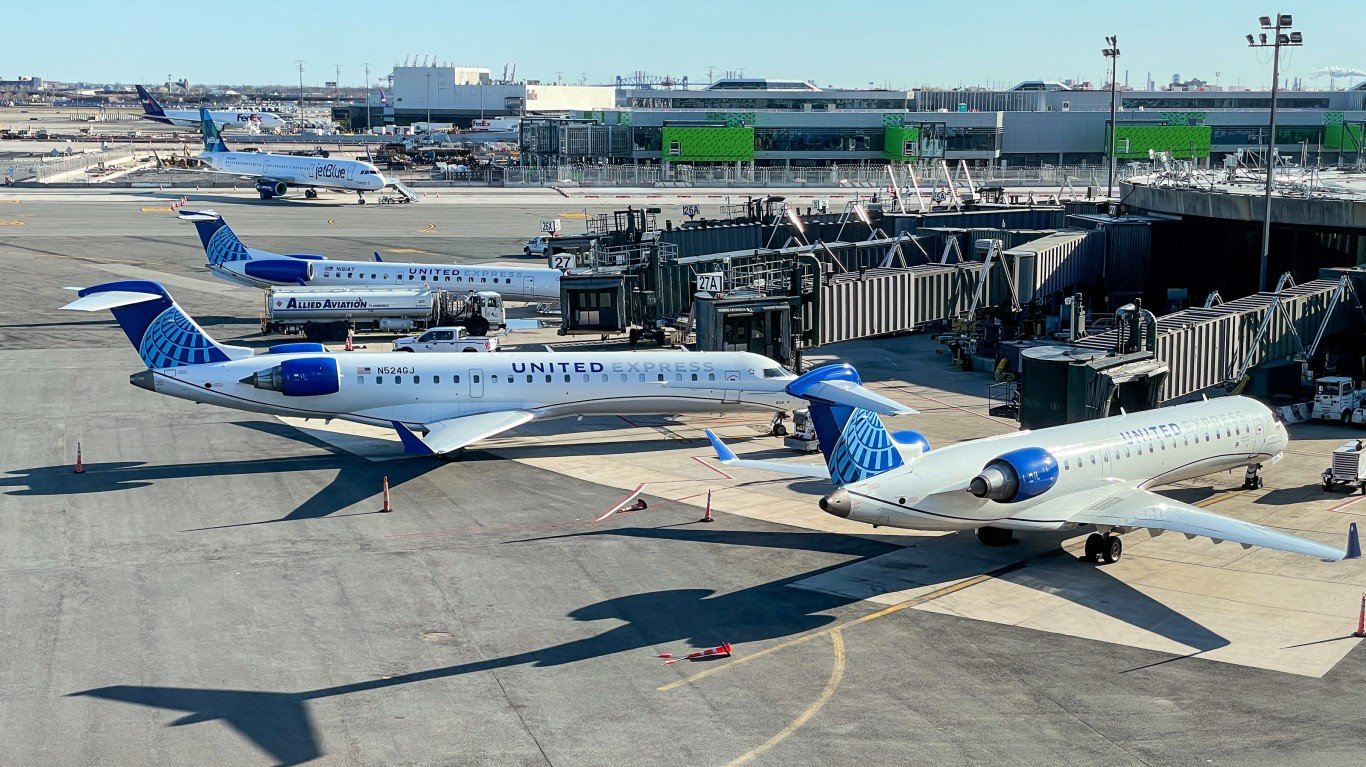
Source: Roman Tiraspolsky / iStock Editorial via Getty Images
1. Newark Liberty International Airport
> Customer satisfaction index rating: 719 (mega airports avg.: 769)
> Avg. security wait time: 17.6 minutes
> Pct. on-time arrivals, June 2022: 59.5%
> Pct. on-time departures, June 2022: 58.5%
> Total departing passengers, 2021: 14,514,049
Large Airports
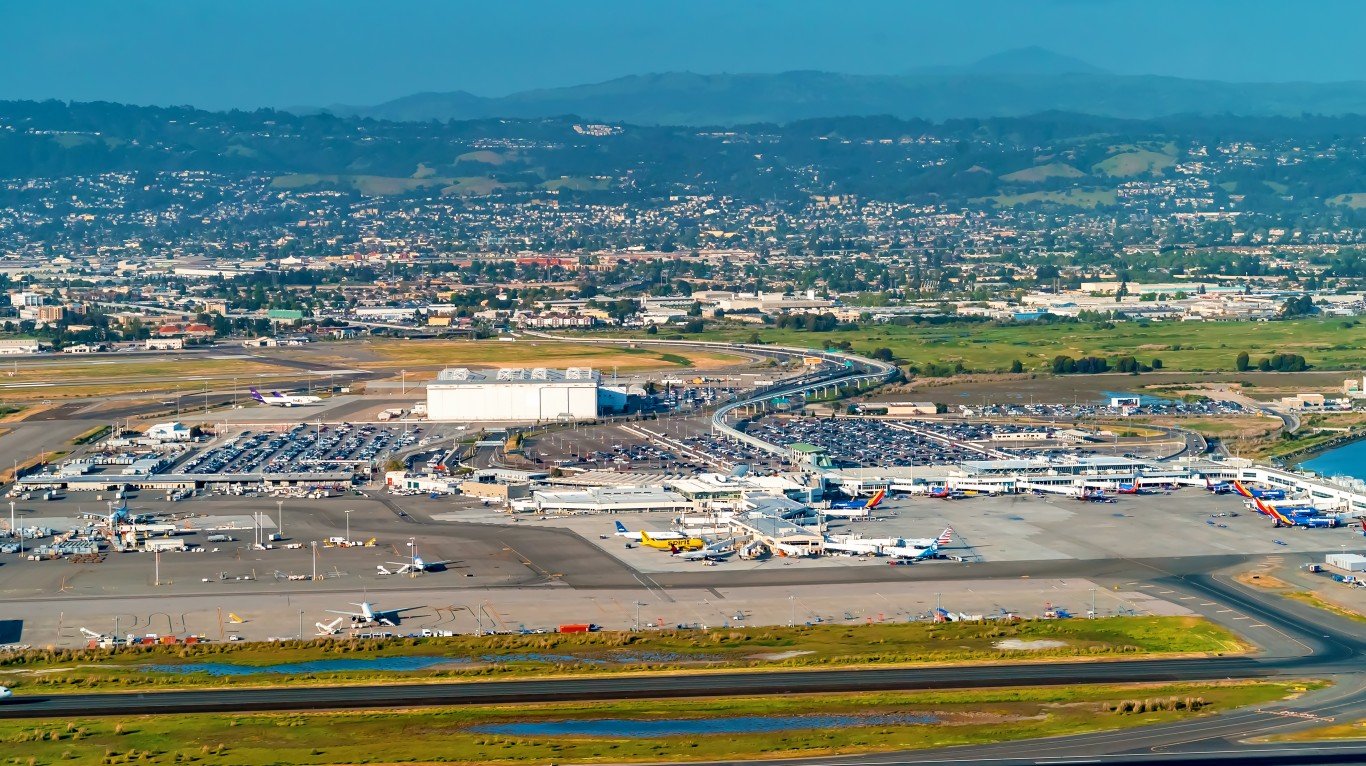
Source: Melpomenem / iStock via Getty Images
9. Oakland International Airport
> Customer satisfaction index rating: 773 (large airports avg.: 784)
> Avg. security wait time: 8.1 minutes
> Pct. on-time arrivals, June 2022: 75.8%
> Pct. on-time departures, June 2022: 72.8%
> Total departing passengers, 2021: 4,011,953
[in-text-ad]
Source: Win McNamee / Getty Images News via Getty Images
8. Ronald Reagan Washington National Airport
> Customer satisfaction index rating: 771 (large airports avg.: 784)
> Avg. security wait time: 11.0 minutes
> Pct. on-time arrivals, June 2022: 69.7%
> Pct. on-time departures, June 2022: 69.7%
> Total departing passengers, 2021: 6,731,737
 24/7 Wall St.
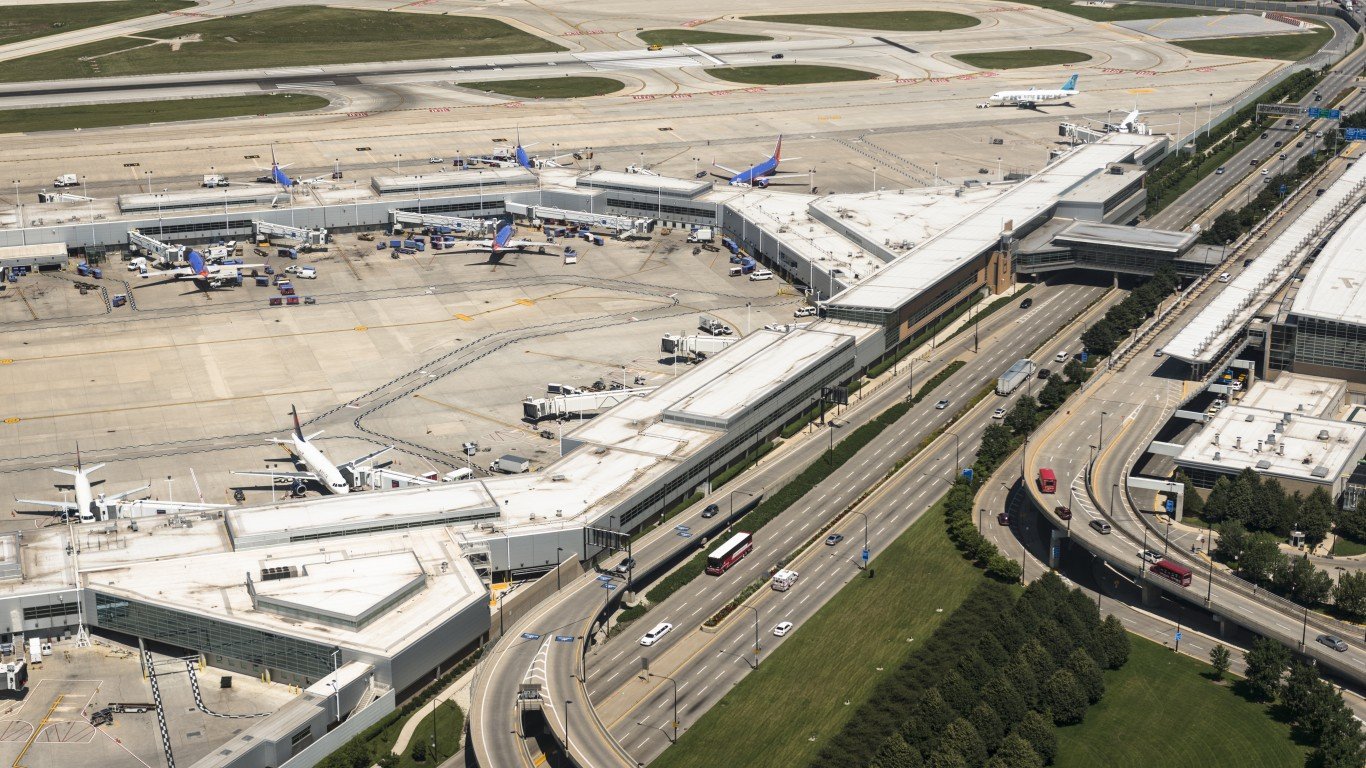
Source: franckreporter / Getty Images
7. Chicago Midway International Airport
> Customer satisfaction index rating: 770 (large airports avg.: 784)
> Avg. security wait time: 16.6 minutes
> Pct. on-time arrivals, June 2022: 70.7%
> Pct. on-time departures, June 2022: 52.4%
> Total departing passengers, 2021: 7,680,617
Source: Sundry Photography / iStock Editorial via Getty Images
6. San Jose International Airport
> Customer satisfaction index rating: 768 (large airports avg.: 784)
> Avg. security wait time: 13.1 minutes
> Pct. on-time arrivals, June 2022: 76.7%
> Pct. on-time departures, June 2022: 75.6%
> Total departing passengers, 2021: 3,619,690
[in-text-ad-2]

5. St. Louis Lambert International Airport
> Customer satisfaction index rating: 765 (large airports avg.: 784)
> Avg. security wait time: 13.5 minutes
> Pct. on-time arrivals, June 2022: 71.7%
> Pct. on-time departures, June 2022: 69.3%
> Total departing passengers, 2021: 5,070,471
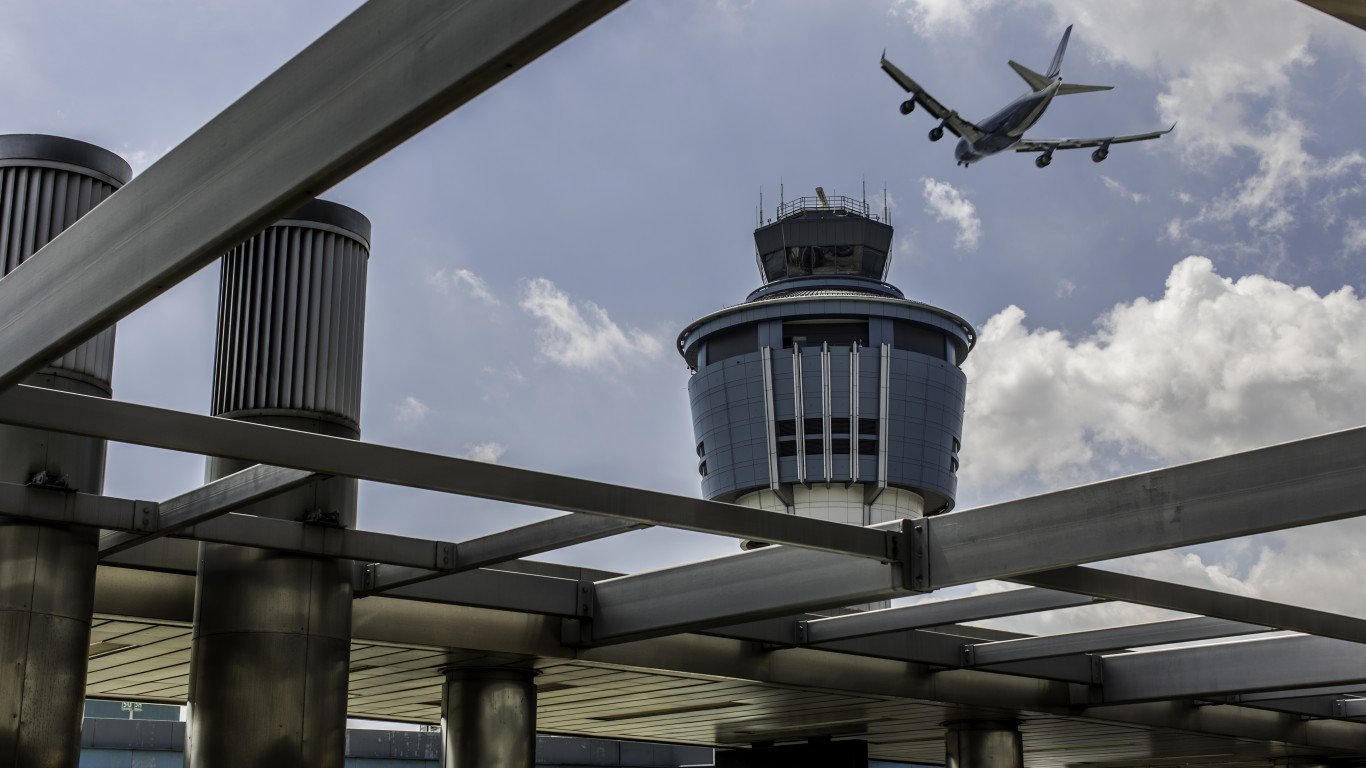
Source: JasonDoiy / iStock via Getty Images
4. LaGuardia Airport
> Customer satisfaction index rating: 761 (large airports avg.: 784)
> Avg. security wait time: 14.1 minutes
> Pct. on-time arrivals, June 2022: 67.4%
> Pct. on-time departures, June 2022: 67.4%
> Total departing passengers, 2021: 7,827,307
[in-text-ad]
Source: TriggerPhoto / iStock via Getty Images
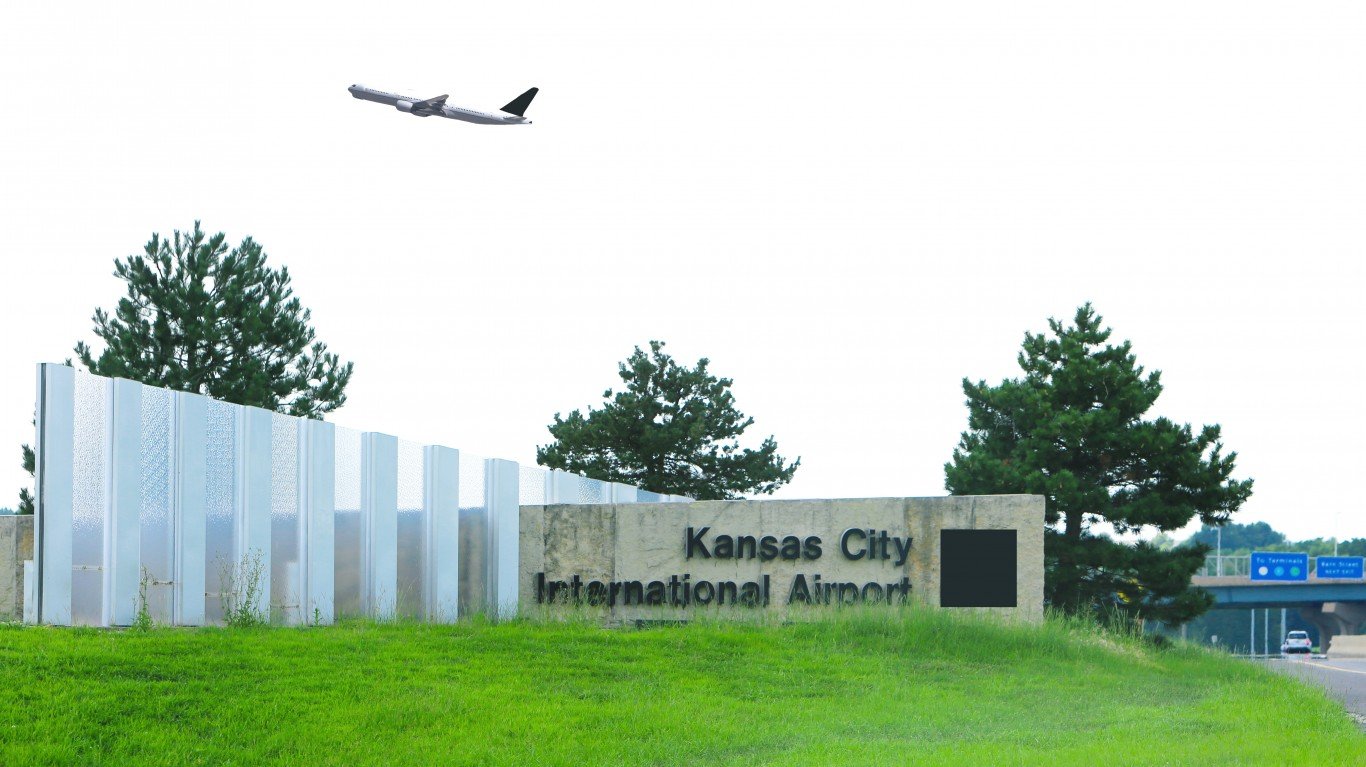
3. Kansas City International Airport
> Customer satisfaction index rating: 760 (large airports avg.: 784)
> Avg. security wait time: 4.8 minutes
> Pct. on-time arrivals, June 2022: 70.6%
> Pct. on-time departures, June 2022: 75.7%
> Total departing passengers, 2021: 3,795,290
 24/7 Wall St.
2. Honolulu International Airport
> Customer satisfaction index rating: 758 (large airports avg.: 784)
> Avg. security wait time: 10.9 minutes
> Pct. on-time arrivals, June 2022: 78.1%
> Pct. on-time departures, June 2022: 80.6%
> Total departing passengers, 2021: 5,830,928
Source: Laser1987 / iStock Editorial via Getty Images
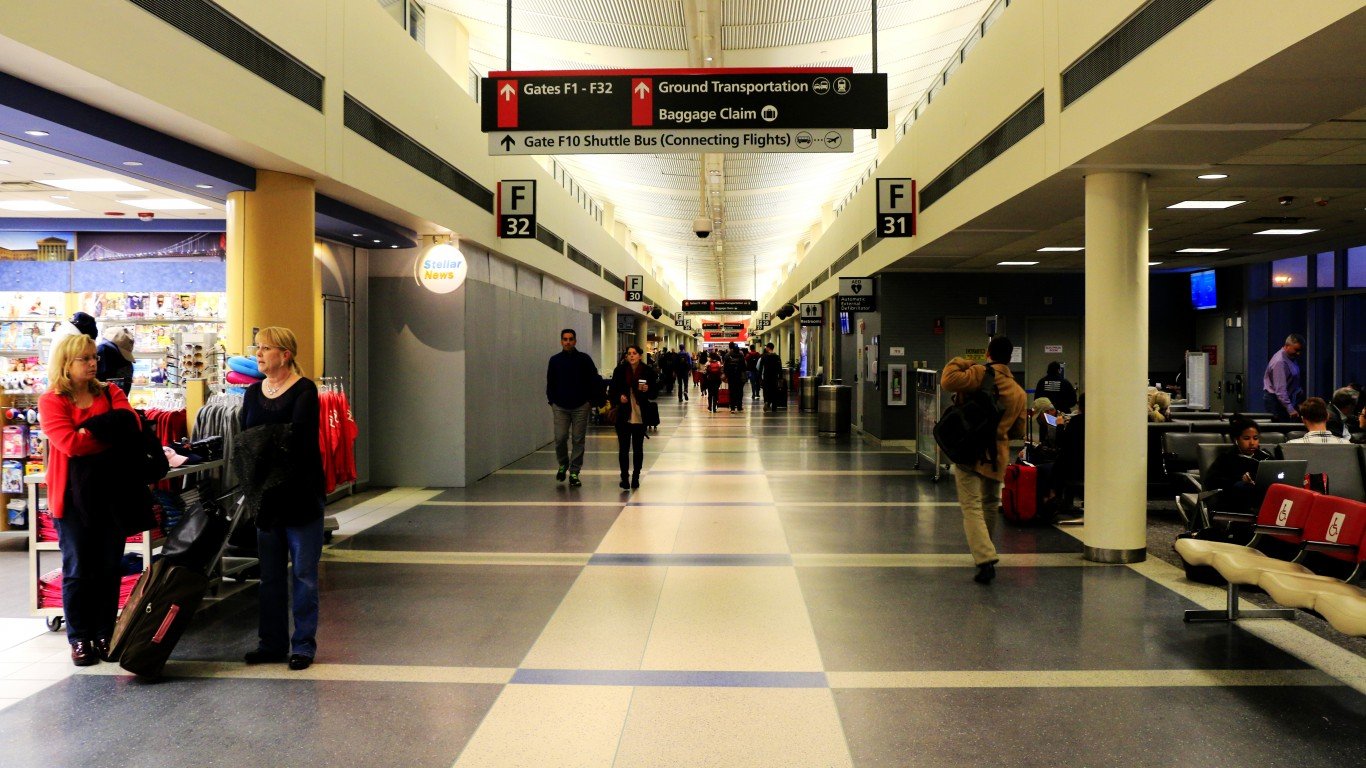
1. Philadelphia International Airport
> Customer satisfaction index rating: 729 (large airports avg.: 784)
> Avg. security wait time: 15.7 minutes
> Pct. on-time arrivals, June 2022: 71.1%
> Pct. on-time departures, June 2022: 71.6%
> Total departing passengers, 2021: 9,820,222
[in-text-ad-2]
Medium Airports

7. John Glenn Columbus
> Customer satisfaction index rating: 803 (medium airports avg.: 807)
> Avg. security wait time: 9.6 minutes
> Pct. on-time arrivals, June 2022: 68.7%
> Pct. on-time departures, June 2022: 74.4%
> Total departing passengers, 2021: 2,825,259

6. Cincinnati/Northern Kentucky International Airport
> Customer satisfaction index rating: 793 (medium airports avg.: 807)
> Avg. security wait time: 6.6 minutes
> Pct. on-time arrivals, June 2022: 69.2%
> Pct. on-time departures, June 2022: 74.8%
> Total departing passengers, 2021: 3,050,597
[in-text-ad]

5. Eppley Airfield (Omaha, Nebraska)
> Customer satisfaction index rating: 791 (medium airports avg.: 807)
> Avg. security wait time: 12.4 minutes
> Pct. on-time arrivals, June 2022: 70.3%
> Pct. on-time departures, June 2022: 75.9%
> Total departing passengers, 2021: 1,829,912

4. Bradley International Airport (Hartford, Connecticut)
> Customer satisfaction index rating: 789 (medium airports avg.: 807)
> Avg. security wait time: 10.0 minutes
> Pct. on-time arrivals, June 2022: 65.3%
> Pct. on-time departures, June 2022: 74.8%
> Total departing passengers, 2021: 2,273,259
Source: Laser1987 / iStock Editorial via Getty Images
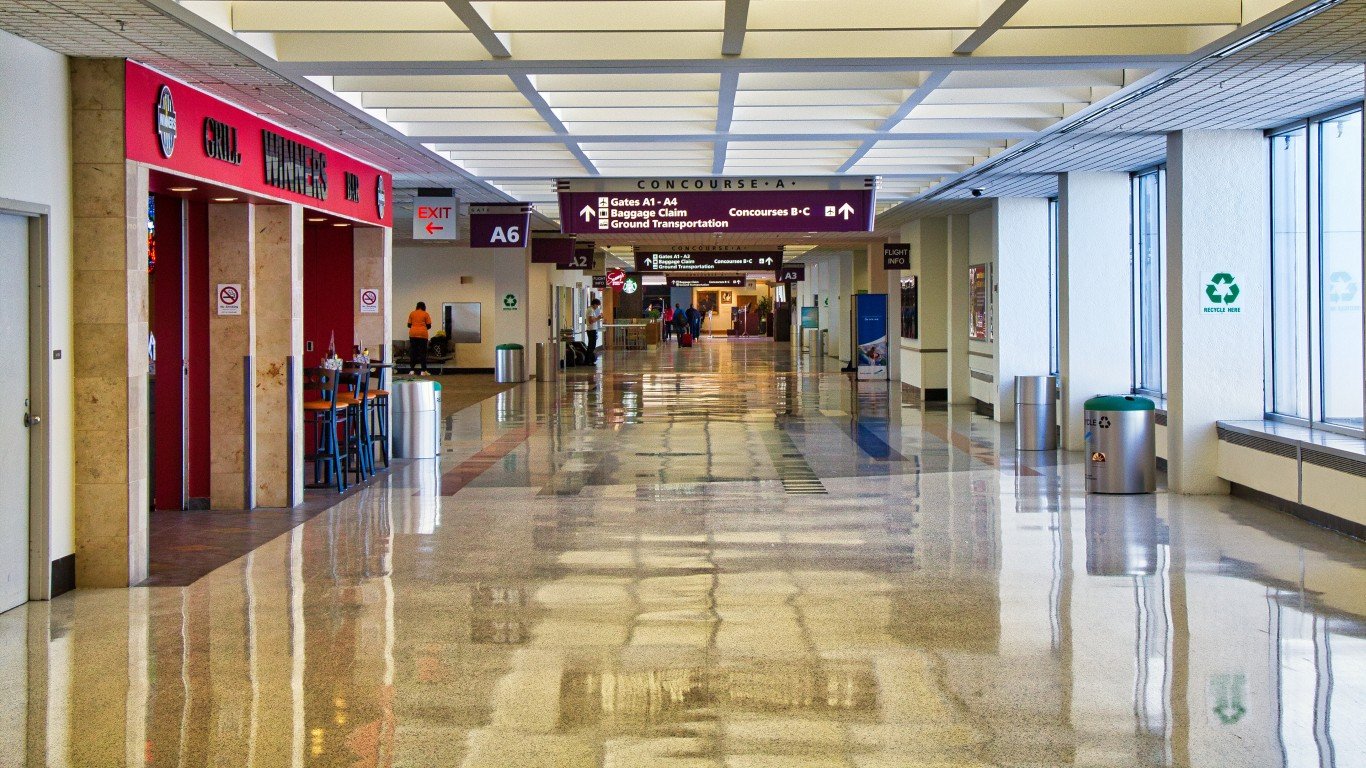
3. Cleveland Hopkins International Airport
> Customer satisfaction index rating: 780 (medium airports avg.: 807)
> Avg. security wait time: 7.1 minutes
> Pct. on-time arrivals, June 2022: 72.3%
> Pct. on-time departures, June 2022: 78.2%
> Total departing passengers, 2021: 3,552,402
[in-text-ad-2]
Source: eddygaleotti / iStock Editorial via Getty Images
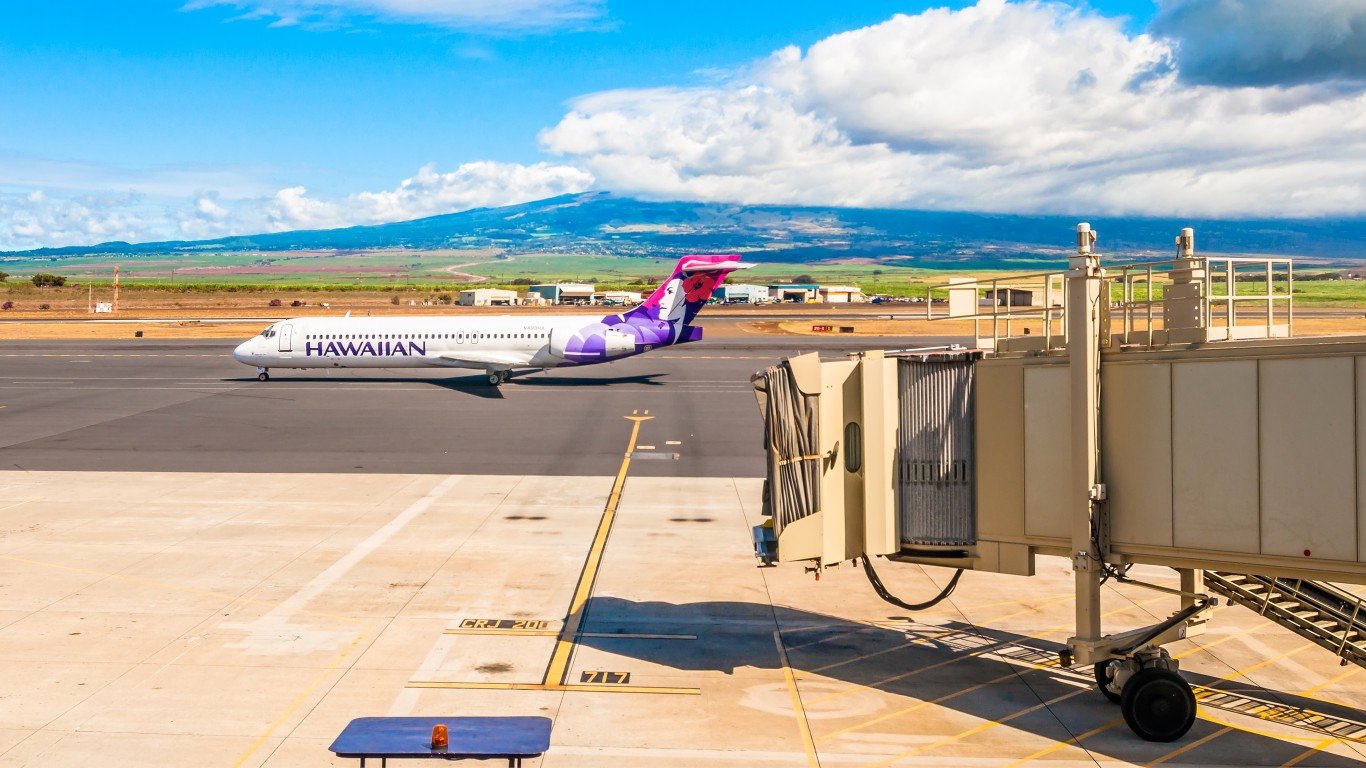
2. Kahului Airport
> Customer satisfaction index rating: 767 (medium airports avg.: 807)
> Avg. security wait time: 12.0 minutes
> Pct. on-time arrivals, June 2022: 78.5%
> Pct. on-time departures, June 2022: 71.4%
> Total departing passengers, 2021: 2,933,315
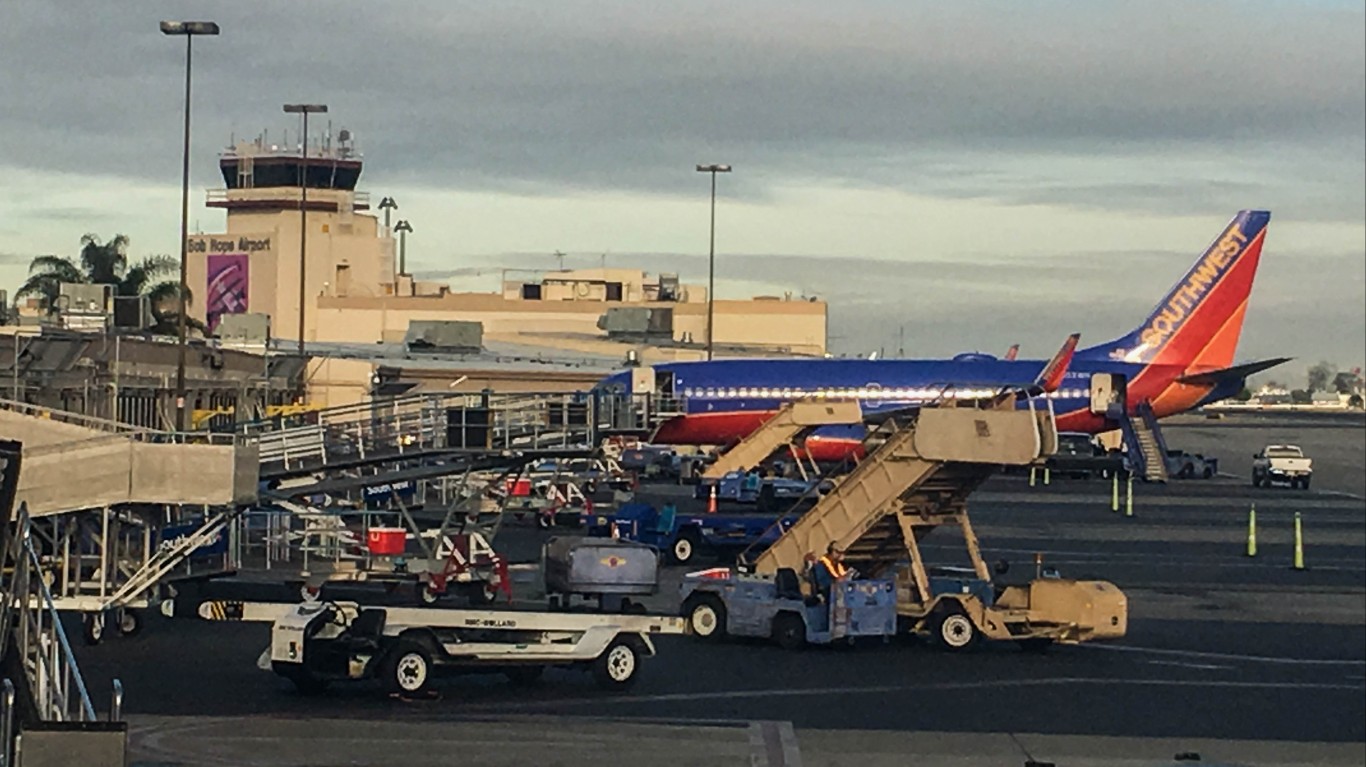
Source: Lisa Bronitt / iStock Editorial via Getty Images
1. Hollywood Burbank Airport
> Customer satisfaction index rating: 763 (medium airports avg.: 807)
> Avg. security wait time: 4.3 minutes
> Pct. on-time arrivals, June 2022: 76.9%
> Pct. on-time departures, June 2022: 78.1%
> Total departing passengers, 2021: 1,942,417
Methodology
To determine the worst airports in America, 24/7 Wall St. reviewed J.D. Power’s 2022 North America Airport Satisfaction Study, which scored U.S. and Canadian airports by air travelers satisfaction, grouping airports into three categories: mega, large, and medium. The airports listed here are those that scored below the average in their respective size category. The 10 worst mega, nine worst large, and seven worst medium U.S. airports are listed here, ranked by customer satisfaction score (out of 1,000).
J.D. Power’s study is based on more than 26,000 completed surveys from August 2021 to July 2022. Respondents were asked to evaluate a departing or arriving airport based on terminal facilities; airport arrival/departure; baggage claim; security check; check-in/baggage check; and food, beverage and retail. Mega airports are defined as those with 33 million or more passengers per year; large airports handle 10 million to 32.9 million annual passengers; and medium airports 4.5 million to 9.9 million annual passengers.
Mega airports are defined as those with 33 million or more passengers per year; large airports with 10 to 32.9 million passengers per year; and medium airports with 4.5 to 9.9 million passengers per year.
24/7 Wall St. added data on average airport security wait time from tsa.report retrieved in September, 2022; the percentage of on-time arrival and departure from the U.S. Office of Aviation Protection’s August 2022 Air Travel Consumer report, covering data from June 2022; and the number of enplanements (departing passengers) in 2021, also from the Office of Aviation Protection.
Sponsored: Find a Qualified Financial Advisor
Finding a qualified financial advisor doesn’t have to be hard. SmartAsset’s free tool matches you with up to 3 fiduciary financial advisors in your area in 5 minutes. Each advisor has been vetted by SmartAsset and is held to a fiduciary standard to act in your best interests. If you’re ready to be matched with local advisors that can help you achieve your financial goals, get started now.
Thank you for reading! Have some feedback for us?
Contact the 24/7 Wall St. editorial team.
Editors' Picks


