
The latest census data shows some meaningful changes that have taken place within the U.S. population over the past 10 years. The U.S. population grew by about 20 million, a 7% increase, from 2010 to 2020. During that same time, more than four of every five U.S. metropolitan areas grew in population, as did many of America’s most highly populated places. For example, each of Dallas, Houston, Phoenix, and San Antonio, reported more than 10% population increase.
Large cities and major metropolitan areas were not the only places to report significant population growth, however. Over the last decade, small towns across the country have seen population booms — some have more than doubled in size.
Using data from the U.S. Census Bureau’s Population and Housing Unit Estimates Program, 24/7 Wall St. identified America’s fastest growing towns. Places are ranked by the percent change in population from 2010 to 2020. We only considered incorporated places with populations between 1,000 and 25,000 on July 1, 2010.
Population change is the end result of two factors: migration and natural change. Migration is the net change of people moving to and from an area, while natural change is the number of births less the number of deaths.
The majority of towns on this list are in the South – including 21 in Texas alone. Positive net migration in many of these places may be explained, at least in part, by favorable job markets. Economic opportunity is one of the most common reasons people move within the United States, and in the majority of the 50 fastest growing towns, the five-year average unemployment rate is below the 5.3% national average. (Here is a look at the states with the most job openings right now.)
These places also tend to be relatively wealthy. In all but four of these towns, the typical household earns more per year than the national median household income of $64,994. High incomes, in addition to job security, can offer stability for new families and may contribute to higher than average birth rates. In most of the towns on this list, the share of the population under age 10 exceeds the 12.1% national share. (Here is a look at the best states to raise a family.)
Click here to see America’s fastest growing towns.
Click here to read our detailed methodology.

Source: Courtesy of the cityofbrookland.com
50. Brookland, AR
> Pop. change; 2010-2020: +93.9% (+1,871 people)
> Total population: 1,992 in 2010; 3,863 in 2020
> Median household income: N/A
> Households earning over $200,000 annually: N/A
> 2020 5-yr. avg. unemployment: N/A
[in-text-ad]

Source: Jason Finn / iStock via Getty Images
49. Saratoga Springs, UT
> Pop. change; 2010-2020: +96.3% (+17,416 people)
> Total population: 18,085 in 2010; 35,501 in 2020
> Median household income: $101,592
> Households earning over $200,000 annually: 7.6%
> 2020 5-yr. avg. unemployment: 2.5%

48. Aledo, TX
> Pop. change; 2010-2020: +96.5% (+2,620 people)
> Total population: 2,715 in 2010; 5,335 in 2020
> Median household income: N/A
> Households earning over $200,000 annually: N/A
> 2020 5-yr. avg. unemployment: N/A

Source: Chester Leeds / iStock via Getty Images
47. Jarrell, TX
> Pop. change; 2010-2020: +99.9% (+1,038 people)
> Total population: 1,039 in 2010; 2,077 in 2020
> Median household income: $90,469
> Households earning over $200,000 annually: 2.6%
> 2020 5-yr. avg. unemployment: 4.9%
[in-text-ad-2]

Source: snikeltrut / iStock via Getty Images
46. Volo, IL
> Pop. change; 2010-2020: +102.2% (+3,054 people)
> Total population: 2,988 in 2010; 6,042 in 2020
> Median household income: $103,264
> Households earning over $200,000 annually: 15.2%
> 2020 5-yr. avg. unemployment: 1.7%

Source: Jim Muise / iStock via Getty Images
45. Anna, TX
> Pop. change; 2010-2020: +104.7% (+8,666 people)
> Total population: 8,279 in 2010; 16,945 in 2020
> Median household income: N/A
> Households earning over $200,000 annually: N/A
> 2020 5-yr. avg. unemployment: N/A
[in-text-ad]

44. Groveland, FL
> Pop. change; 2010-2020: +105.4% (+9,215 people)
> Total population: 8,746 in 2010; 17,961 in 2020
> Median household income: $65,482
> Households earning over $200,000 annually: 6.0%
> 2020 5-yr. avg. unemployment: 6.7%

43. St. James, NC
> Pop. change; 2010-2020: +106.7% (+3,411 people)
> Total population: 3,196 in 2010; 6,607 in 2020
> Median household income: $110,814
> Households earning over $200,000 annually: 19.0%
> 2020 5-yr. avg. unemployment: 2.5%

Source: Courtesy of cityofmillersburg.org
42. Millersburg, OR
> Pop. change; 2010-2020: +106.8% (+1,424 people)
> Total population: 1,333 in 2010; 2,757 in 2020
> Median household income: $101,458
> Households earning over $200,000 annually: 4.0%
> 2020 5-yr. avg. unemployment: 4.5%
[in-text-ad-2]

41. Berthoud, CO
> Pop. change; 2010-2020: +107.2% (+5,591 people)
> Total population: 5,215 in 2010; 10,806 in 2020
> Median household income: N/A
> Households earning over $200,000 annually: N/A
> 2020 5-yr. avg. unemployment: N/A

Source: via Facebook / courtesy of City of Hudson Oaks, Texas
40. Hudson Oaks, TX
> Pop. change; 2010-2020: +109.3% (+1,861 people)
> Total population: 1,703 in 2010; 3,564 in 2020
> Median household income: $115,938
> Households earning over $200,000 annually: 17.6%
> 2020 5-yr. avg. unemployment: 6.3%
[in-text-ad]

39. Forney, TX
> Pop. change; 2010-2020: +109.7% (+15,300 people)
> Total population: 13,946 in 2010; 29,246 in 2020
> Median household income: $93,792
> Households earning over $200,000 annually: 3.0%
> 2020 5-yr. avg. unemployment: 5.9%

Source: bauhaus1000 / iStock Unreleased via Getty Images
38. Fort Mill, SC
> Pop. change; 2010-2020: +113.6% (+13,258 people)
> Total population: 11,671 in 2010; 24,929 in 2020
> Median household income: $101,699
> Households earning over $200,000 annually: 13.8%
> 2020 5-yr. avg. unemployment: 2.6%

Source: NathanJoelPhotography / iStock via Getty Images
37. Bluffton, SC
> Pop. change; 2010-2020: +116.3% (+15,177 people)
> Total population: 13,053 in 2010; 28,230 in 2020
> Median household income: N/A
> Households earning over $200,000 annually: N/A
> 2020 5-yr. avg. unemployment: N/A
[in-text-ad-2]
 , California, USA")
36. Maricopa, CA
> Pop. change; 2010-2020: +116.5% (+1,345 people)
> Total population: 1,155 in 2010; 2,500 in 2020
> Median household income: $40,208
> Households earning over $200,000 annually: 1.7%
> 2020 5-yr. avg. unemployment: 11.5%

Source: Courtesy of villageofpingreegrove.org
35. Pingree Grove, IL
> Pop. change; 2010-2020: +117.8% (+5,401 people)
> Total population: 4,585 in 2010; 9,986 in 2020
> Median household income: $89,683
> Households earning over $200,000 annually: 11.0%
> 2020 5-yr. avg. unemployment: 1.1%
[in-text-ad]

34. Austin, AR
> Pop. change; 2010-2020: +119.5% (+2,452 people)
> Total population: 2,052 in 2010; 4,504 in 2020
> Median household income: N/A
> Households earning over $200,000 annually: N/A
> 2020 5-yr. avg. unemployment: N/A
 24/7 Wall St.
33. Blythewood, SC
> Pop. change; 2010-2020: +120.4% (+2,475 people)
> Total population: 2,056 in 2010; 4,531 in 2020
> Median household income: N/A
> Households earning over $200,000 annually: N/A
> 2020 5-yr. avg. unemployment: N/A

Source: Courtesy of City of Fate via Facebook
32. Fate, TX
> Pop. change; 2010-2020: +124.4% (+9,666 people)
> Total population: 7,768 in 2010; 17,434 in 2020
> Median household income: $109,481
> Households earning over $200,000 annually: 11.7%
> 2020 5-yr. avg. unemployment: 6.1%
[in-text-ad-2]

Source: Courtesy of City of Princeton Tx via Facebook
31. Princeton, TX
> Pop. change; 2010-2020: +127.0% (+8,784 people)
> Total population: 6,915 in 2010; 15,699 in 2020
> Median household income: $80,323
> Households earning over $200,000 annually: 3.9%
> 2020 5-yr. avg. unemployment: 3.1%

30. Lincolnville, SC
> Pop. change; 2010-2020: +129.2% (+1,479 people)
> Total population: 1,145 in 2010; 2,624 in 2020
> Median household income: $24,028
> Households earning over $200,000 annually: 0.6%
> 2020 5-yr. avg. unemployment: 15.7%
[in-text-ad]

Source: Courtesy of ci.selma.tx.us
29. Selma, TX
> Pop. change; 2010-2020: +132.2% (+7,475 people)
> Total population: 5,655 in 2010; 13,130 in 2020
> Median household income: $84,712
> Households earning over $200,000 annually: 2.6%
> 2020 5-yr. avg. unemployment: 4.6%

Source: Courtesy of town.northlake.tx.us
28. Northlake, TX
> Pop. change; 2010-2020: +132.7% (+2,483 people)
> Total population: 1,871 in 2010; 4,354 in 2020
> Median household income: $92,750
> Households earning over $200,000 annually: 17.4%
> 2020 5-yr. avg. unemployment: 3.1%

Source: via Facebook / courtesy of Holly Ridge, North Carolina
27. Holly Ridge, NC
> Pop. change; 2010-2020: +132.8% (+1,764 people)
> Total population: 1,328 in 2010; 3,092 in 2020
> Median household income: $79,167
> Households earning over $200,000 annually: 7.2%
> 2020 5-yr. avg. unemployment: 2.4%
[in-text-ad-2]

26. Rolesville, NC
> Pop. change; 2010-2020: +133.4% (+5,076 people)
> Total population: 3,806 in 2010; 8,882 in 2020
> Median household income: $126,793
> Households earning over $200,000 annually: 21.3%
> 2020 5-yr. avg. unemployment: 4.5%

25. Bluffdale, UT
> Pop. change; 2010-2020: +134.0% (+10,209 people)
> Total population: 7,619 in 2010; 17,828 in 2020
> Median household income: N/A
> Households earning over $200,000 annually: N/A
> 2020 5-yr. avg. unemployment: N/A
[in-text-ad]

24. Ridgefield, WA
> Pop. change; 2010-2020: +134.5% (+6,469 people)
> Total population: 4,809 in 2010; 11,278 in 2020
> Median household income: $95,344
> Households earning over $200,000 annually: 10.2%
> 2020 5-yr. avg. unemployment: 4.6%
 24/7 Wall St.
Source: PaaschPhotography / iStock via Getty Images
23. Buda, TX
> Pop. change; 2010-2020: +134.9% (+10,074 people)
> Total population: 7,470 in 2010; 17,544 in 2020
> Median household income: $84,074
> Households earning over $200,000 annually: 7.1%
> 2020 5-yr. avg. unemployment: 3.0%
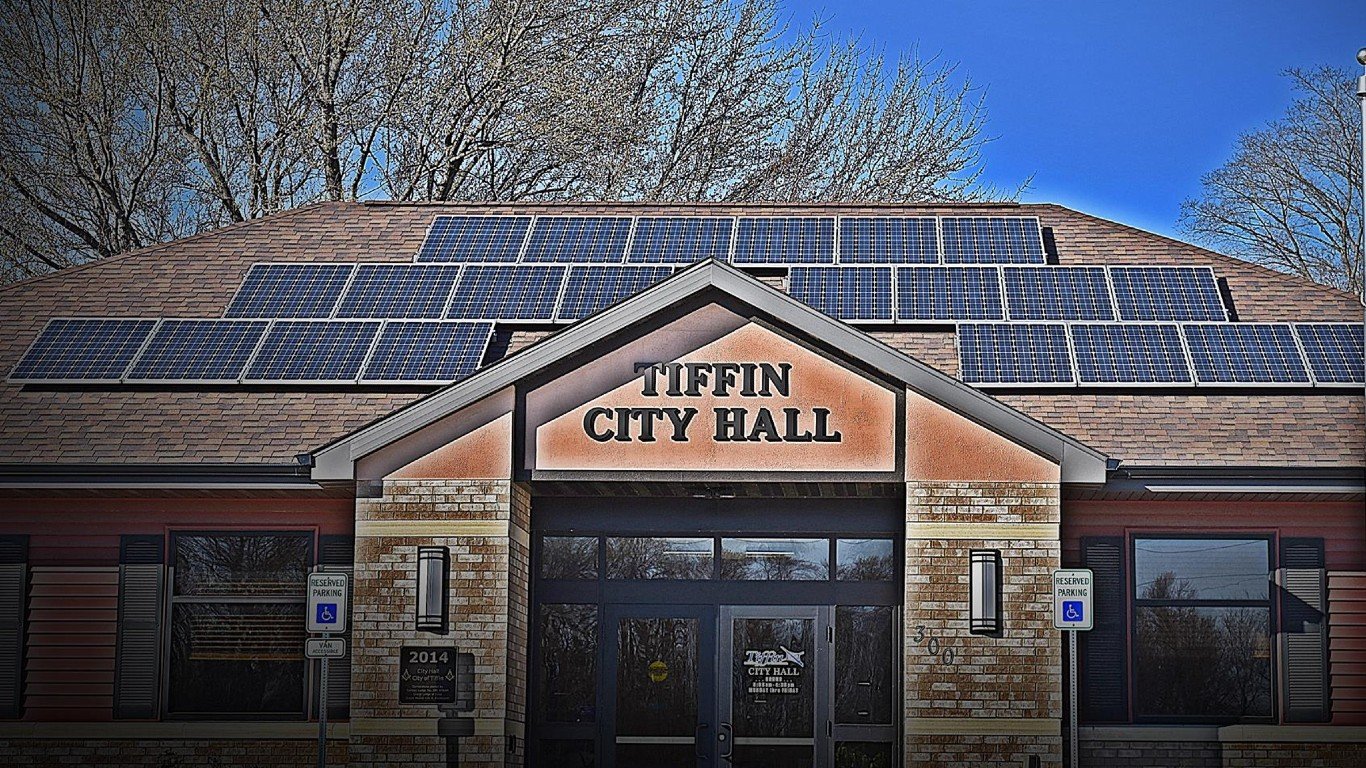
Source: Courtesy of tiffin-iowa.org
22. Tiffin, IA
> Pop. change; 2010-2020: +135.2% (+2,661 people)
> Total population: 1,968 in 2010; 4,629 in 2020
> Median household income: $77,634
> Households earning over $200,000 annually: 2.2%
> 2020 5-yr. avg. unemployment: 2.2%
[in-text-ad-2]
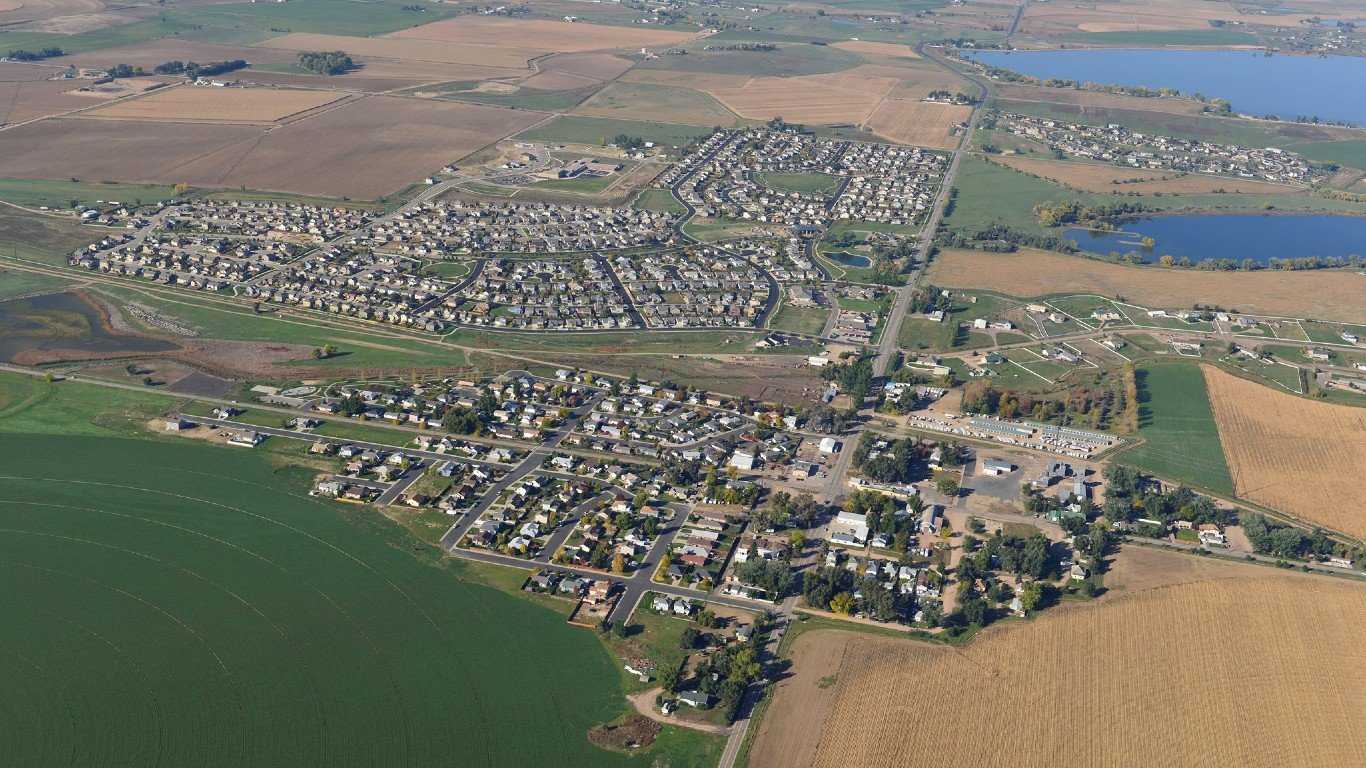
Source: Courtesy of townofseverance.org
21. Severance, CO
> Pop. change; 2010-2020: +138.3% (+4,430 people)
> Total population: 3,204 in 2010; 7,634 in 2020
> Median household income: $109,207
> Households earning over $200,000 annually: 8.5%
> 2020 5-yr. avg. unemployment: 1.9%

Source: Gary Fink / iStock via Getty Images
20. Oak Point, TX
> Pop. change; 2010-2020: +140.2% (+3,981 people)
> Total population: 2,839 in 2010; 6,820 in 2020
> Median household income: $102,946
> Households earning over $200,000 annually: 13.3%
> 2020 5-yr. avg. unemployment: 2.3%
[in-text-ad]

19. Aubrey, TX
> Pop. change; 2010-2020: +144.9% (+3,806 people)
> Total population: 2,627 in 2010; 6,433 in 2020
> Median household income: N/A
> Households earning over $200,000 annually: N/A
> 2020 5-yr. avg. unemployment: N/A
 24/7 Wall St.
18. Herriman, UT
> Pop. change; 2010-2020: +147.6% (+33,239 people)
> Total population: 22,517 in 2010; 55,756 in 2020
> Median household income: $102,096
> Households earning over $200,000 annually: 9.4%
> 2020 5-yr. avg. unemployment: 4.3%

Source: Courtesy of tontitown.com
17. Tontitown, AR
> Pop. change; 2010-2020: +148.2% (+3,621 people)
> Total population: 2,444 in 2010; 6,065 in 2020
> Median household income: $69,310
> Households earning over $200,000 annually: 11.3%
> 2020 5-yr. avg. unemployment: 2.0%
[in-text-ad-2]

Source: rustycanuck / iStock Editorial via Getty Images
16. Davenport, FL
> Pop. change; 2010-2020: +152.5% (+4,410 people)
> Total population: 2,891 in 2010; 7,301 in 2020
> Median household income: $53,586
> Households earning over $200,000 annually: 2.2%
> 2020 5-yr. avg. unemployment: 6.0%

15. Manvel, TX
> Pop. change; 2010-2020: +160.2% (+8,538 people)
> Total population: 5,329 in 2010; 13,867 in 2020
> Median household income: $84,711
> Households earning over $200,000 annually: 8.0%
> 2020 5-yr. avg. unemployment: 4.3%
[in-text-ad]

Source: Courtesy of fruitlandpark.org
14. Fruitland Park, FL
> Pop. change; 2010-2020: +164.3% (+6,845 people)
> Total population: 4,166 in 2010; 11,011 in 2020
> Median household income: $58,566
> Households earning over $200,000 annually: 5.1%
> 2020 5-yr. avg. unemployment: 8.0%

Source: Courtesy of mclendon-chisholm.com
13. McLendon-Chisholm, TX
> Pop. change; 2010-2020: +171.5% (+2,410 people)
> Total population: 1,405 in 2010; 3,815 in 2020
> Median household income: $155,667
> Households earning over $200,000 annually: 34.2%
> 2020 5-yr. avg. unemployment: 1.1%

Source: Norm Lane / iStock via Getty Images
12. Hardeeville, SC
> Pop. change; 2010-2020: +173.1% (+5,356 people)
> Total population: 3,095 in 2010; 8,451 in 2020
> Median household income: $65,245
> Households earning over $200,000 annually: 4.0%
> 2020 5-yr. avg. unemployment: 5.1%
[in-text-ad-2]

Source: Courtesy of Town of Prosper, Texas Government
11. Prosper, TX
> Pop. change; 2010-2020: +176.7% (+17,213 people)
> Total population: 9,744 in 2010; 26,957 in 2020
> Median household income: $153,777
> Households earning over $200,000 annually: 32.3%
> 2020 5-yr. avg. unemployment: 3.1%

Source: Courtesy of cityofmelissa.com
10. Melissa, TX
> Pop. change; 2010-2020: +184.7% (+8,949 people)
> Total population: 4,844 in 2010; 13,793 in 2020
> Median household income: $117,750
> Households earning over $200,000 annually: 10.3%
> 2020 5-yr. avg. unemployment: 4.7%
[in-text-ad]

Source: Courtesy of City of Cave Springs Arkansas via Facebook
9. Cave Springs, AR
> Pop. change; 2010-2020: +189.9% (+3,758 people)
> Total population: 1,979 in 2010; 5,737 in 2020
> Median household income: $133,981
> Households earning over $200,000 annually: 24.2%
> 2020 5-yr. avg. unemployment: 1.0%

8. Dripping Springs, TX
> Pop. change; 2010-2020: +198.2% (+4,378 people)
> Total population: 2,209 in 2010; 6,587 in 2020
> Median household income: $87,646
> Households earning over $200,000 annually: 16.5%
> 2020 5-yr. avg. unemployment: 3.0%

Source: invets / Flickr
7. Whitestown, IN
> Pop. change; 2010-2020: +205.2% (+6,445 people)
> Total population: 3,141 in 2010; 9,586 in 2020
> Median household income: $96,024
> Households earning over $200,000 annually: 4.9%
> 2020 5-yr. avg. unemployment: 2.8%
[in-text-ad-2]

6. Celina, TX
> Pop. change; 2010-2020: +215.0% (+13,728 people)
> Total population: 6,386 in 2010; 20,114 in 2020
> Median household income: $114,807
> Households earning over $200,000 annually: 17.2%
> 2020 5-yr. avg. unemployment: 0.1%

5. Thompson’s Station, TN
> Pop. change; 2010-2020: +216.2% (+4,768 people)
> Total population: 2,205 in 2010; 6,973 in 2020
> Median household income: $95,386
> Households earning over $200,000 annually: 15.2%
> 2020 5-yr. avg. unemployment: 5.3%
[in-text-ad]

4. Manor, TX
> Pop. change; 2010-2020: +218.5% (+10,817 people)
> Total population: 4,950 in 2010; 15,767 in 2020
> Median household income: $87,500
> Households earning over $200,000 annually: 2.5%
> 2020 5-yr. avg. unemployment: 3.1%

3. Iowa Colony, TX
> Pop. change; 2010-2020: +329.5% (+3,750 people)
> Total population: 1,138 in 2010; 4,888 in 2020
> Median household income: $95,144
> Households earning over $200,000 annually: 15.5%
> 2020 5-yr. avg. unemployment: 7.0%

2. Watford City, ND
> Pop. change; 2010-2020: +336.0% (+6,122 people)
> Total population: 1,822 in 2010; 7,944 in 2020
> Median household income: $75,000
> Households earning over $200,000 annually: 7.0%
> 2020 5-yr. avg. unemployment: 1.5%
[in-text-ad-2]

1. Fulshear, TX
> Pop. change; 2010-2020: +1364.6% (+15,966 people)
> Total population: 1,170 in 2010; 17,136 in 2020
> Median household income: $162,826
> Households earning over $200,000 annually: 33.8%
> 2020 5-yr. avg. unemployment: 5.4%
Methodology
To identify the 50 fastest growing towns in America, 24/7 Wall St. reviewed population data from the U.S. Census Bureau’s Population and Housing Unit Estimates Program. Places are ranked by the percent population change from July 1, 2010 to July 1, 2020. =
For the purposes of this story, towns are defined by their population. Only incorporated places with populations between 1,000 and 25,000 on July 1, 2010 were considered.
We also considered median household income, the share of households earning over $200,000 annually, and unemployment. Each of these supplemental measures is a five-year estimate from the U.S. Census Bureau’s 2020 American Community Survey.
Take This Retirement Quiz To Get Matched With A Financial Advisor (Sponsored)
Take the quiz below to get matched with a financial advisor today.
Each advisor has been vetted by SmartAsset and is held to a fiduciary standard to act in your best interests.
Here’s how it works:
1. Answer SmartAsset advisor match quiz
2. Review your pre-screened matches at your leisure. Check out the
advisors’ profiles.
3. Speak with advisors at no cost to you. Have an introductory call on the phone or introduction in person and choose whom to work with in the future
Take the retirement quiz right here.
Thank you for reading! Have some feedback for us?
Contact the 24/7 Wall St. editorial team.
Editors' Picks