According to the CDC, motor vehicle accidents were the second-leading cause of accidental death in the United States in 2020. The National Highway Safety Administration estimates that nearly 43,000 Americans died from motor vehicle accidents in 2021, a 10.5% increase from 2020. (Here are the deadliest states to drive.)
The number of road fatalities continues to trend in the wrong direction in 2022, with estimated fatalities in the first quarter of 2022 up 7% from the same period in 2021. Motor vehicle deaths have seen a steady decrease from 1975 until the past few years. (Here are the worst car accidents in America since the 1990s.)
Certain cities can be especially dangerous for driving. Some have poorly designed roads and traffic layouts that increase the likelihoods of accidents. Others are regularly affected by inclement weather, like snow and ice, that makes driving more perilous. Others are highly congested or have roads in poor conditions, while drunk driving is more prevalent in some cities.
Dangerous driving cities are not unique to any certain part of the country. To identify the worst cities to drive in, 24/7 Wall St. created a weighted index to measure driving and road conditions in 376 metropolitan statistical areas. The index consists six measures: the shares of deadly vehicle accidents caused by weather and by poor roadway conditions; the number of deadly accidents for every 100,000 people; the share of driving deaths involving alcohol; the average annual time lost to traffic congestion; and the average price of a regular gallon of gas at the state level on Nov. 28, 2022.
Click here to see America’s worst cities to drive in.
Click here to read our detailed methodology.

Source: DenisTangneyJr / iStock via Getty Images
25. Charlottesville, VA
> Avg. traffic delays per commuter in 2020: 19 hours (middle 50% of 376 metro areas)
> Deadly crashes per 100,000 people, 2011-2020: 101 per 100,000 people (middle 50% of 376 metro areas)
> Share of deadly crashes caused by weather or road design/conditions: 53.6% (top 10% of 376 metro areas)
> Share of driving deaths involving alcohol: 26.4% (middle 50% of 376 metro areas)
[in-text-ad]
Source: MattGush / iStock via Getty Images
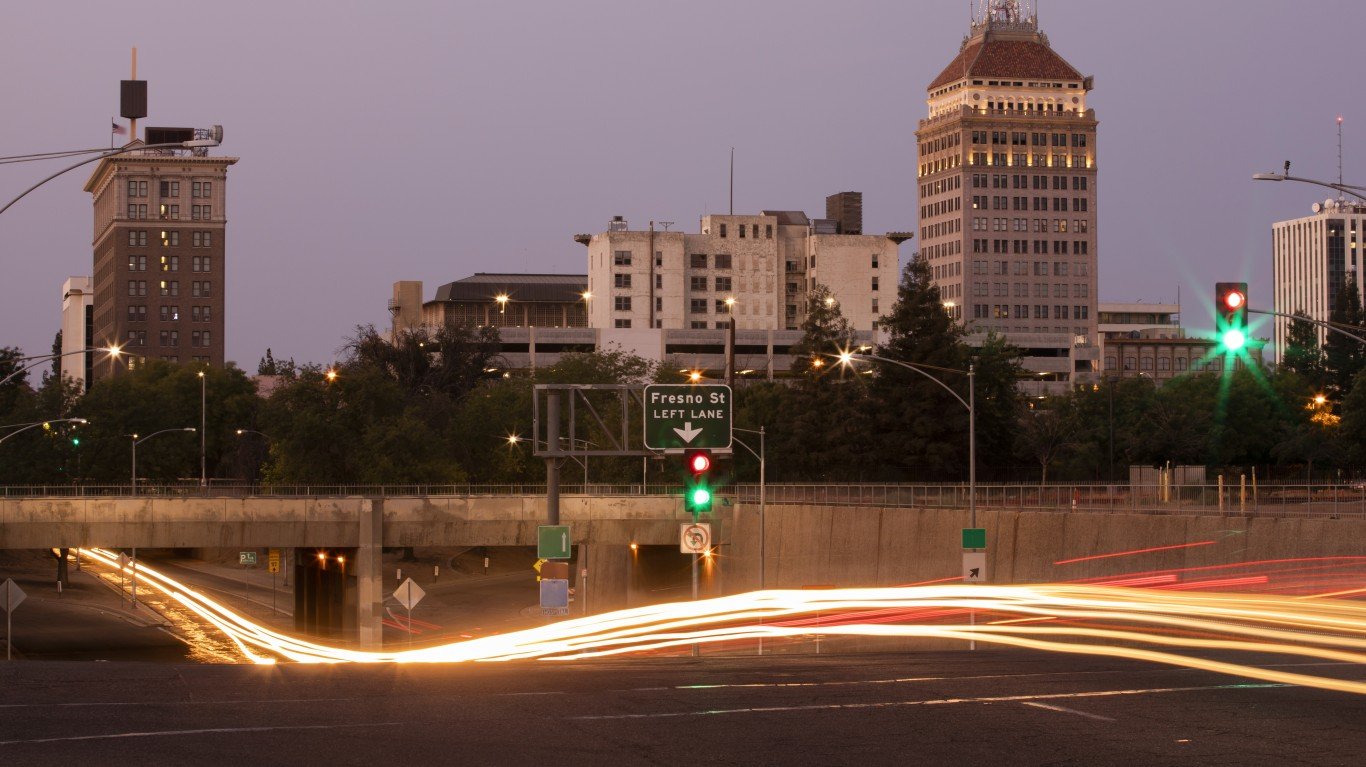
24. Fresno, CA
> Avg. traffic delays per commuter in 2020: 29 hours (top 10% of 376 metro areas)
> Deadly crashes per 100,000 people, 2011-2020: 117 per 100,000 people (middle 50% of 376 metro areas)
> Share of deadly crashes caused by weather or road design/conditions: 14.8% (bottom 25% of 376 metro areas)
> Share of driving deaths involving alcohol: 26.0% (middle 50% of 376 metro areas)
Source: chrisp0 / E+ via Getty Images
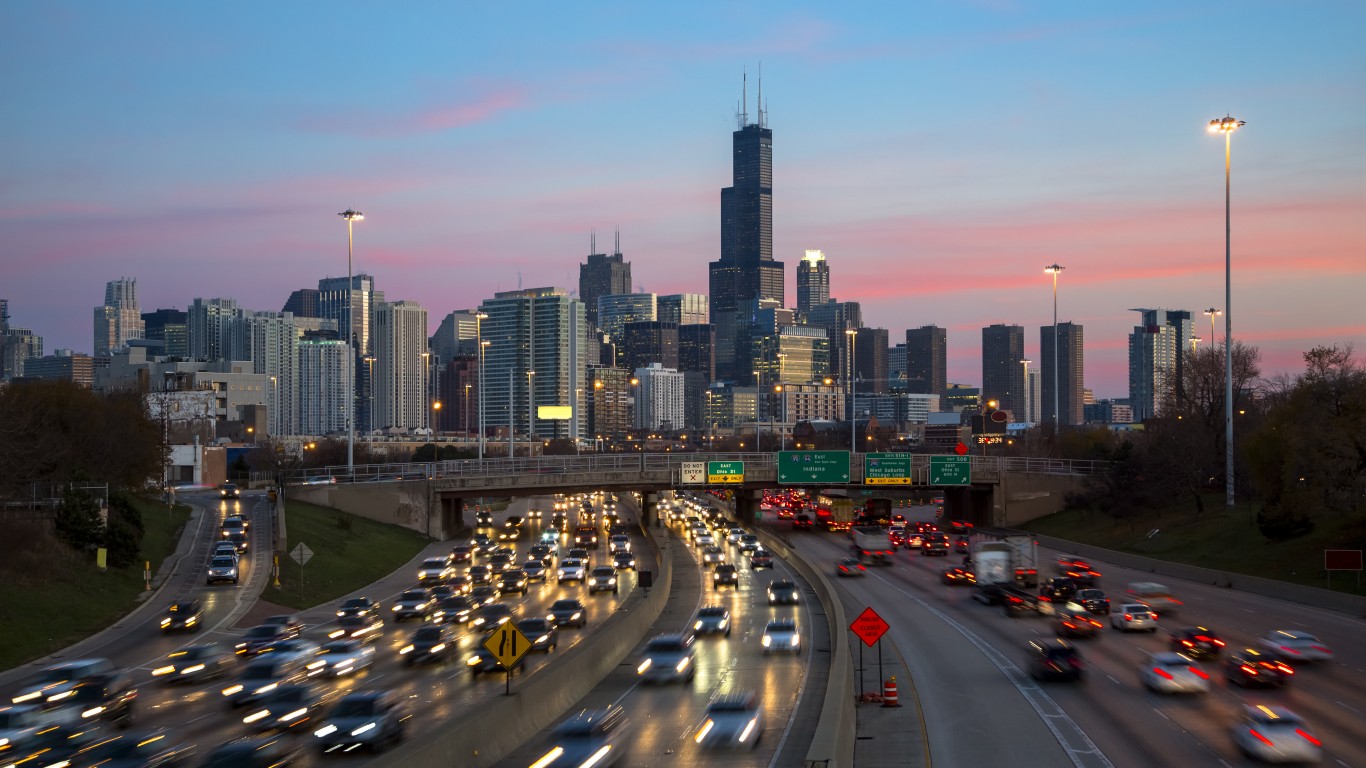
23. Chicago-Naperville-Elgin, IL-IN-WI
> Avg. traffic delays per commuter in 2020: 39 hours (top 10% of 376 metro areas)
> Deadly crashes per 100,000 people, 2011-2020: 55 per 100,000 people (bottom 10% of 376 metro areas)
> Share of deadly crashes caused by weather or road design/conditions: 18.2% (bottom 25% of 376 metro areas)
> Share of driving deaths involving alcohol: 26.6% (middle 50% of 376 metro areas)
Source: peeterv / iStock via Getty Images
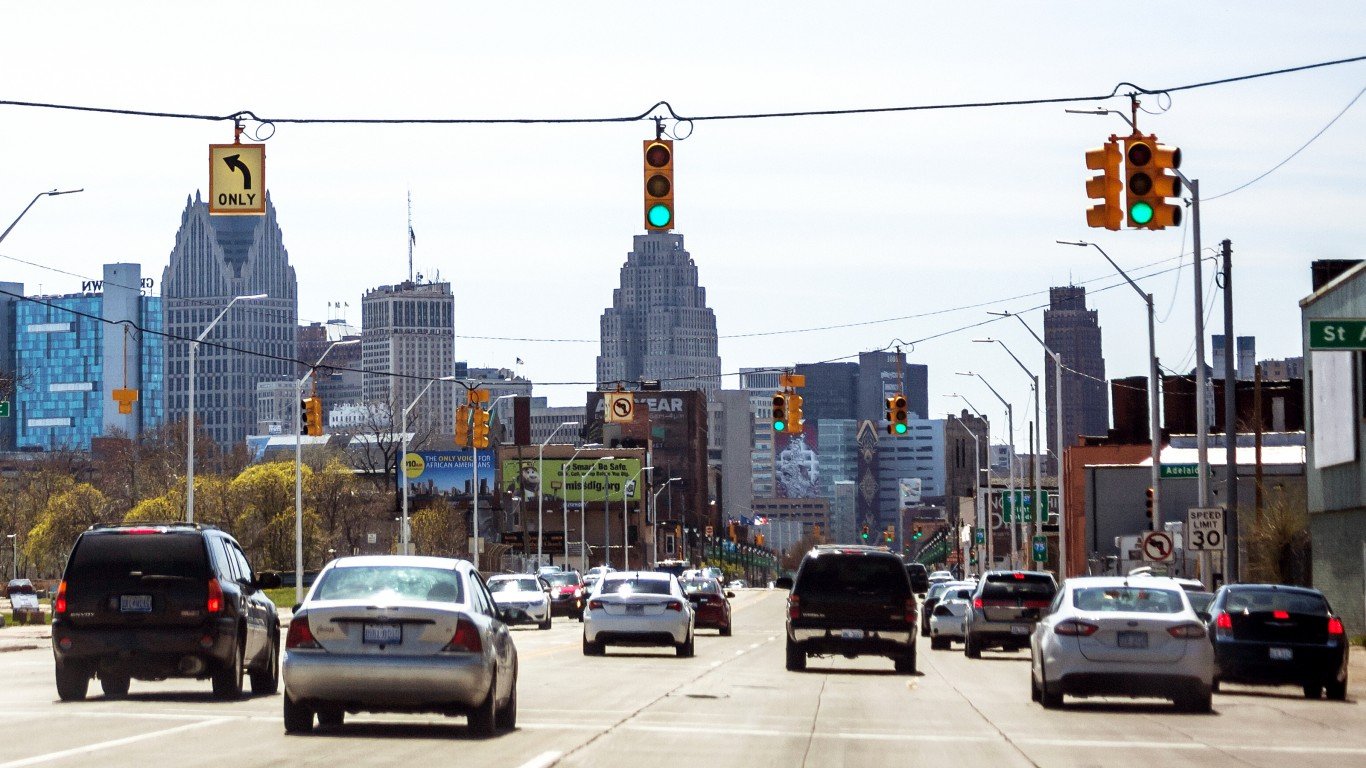
22. Detroit-Warren-Dearborn, MI
> Avg. traffic delays per commuter in 2020: 35 hours (top 10% of 376 metro areas)
> Deadly crashes per 100,000 people, 2011-2020: 73 per 100,000 people (bottom 25% of 376 metro areas)
> Share of deadly crashes caused by weather or road design/conditions: 34.0% (middle 50% of 376 metro areas)
> Share of driving deaths involving alcohol: 26.1% (middle 50% of 376 metro areas)
[in-text-ad-2]
Source: typhoonski / iStock Editorial via Getty Images
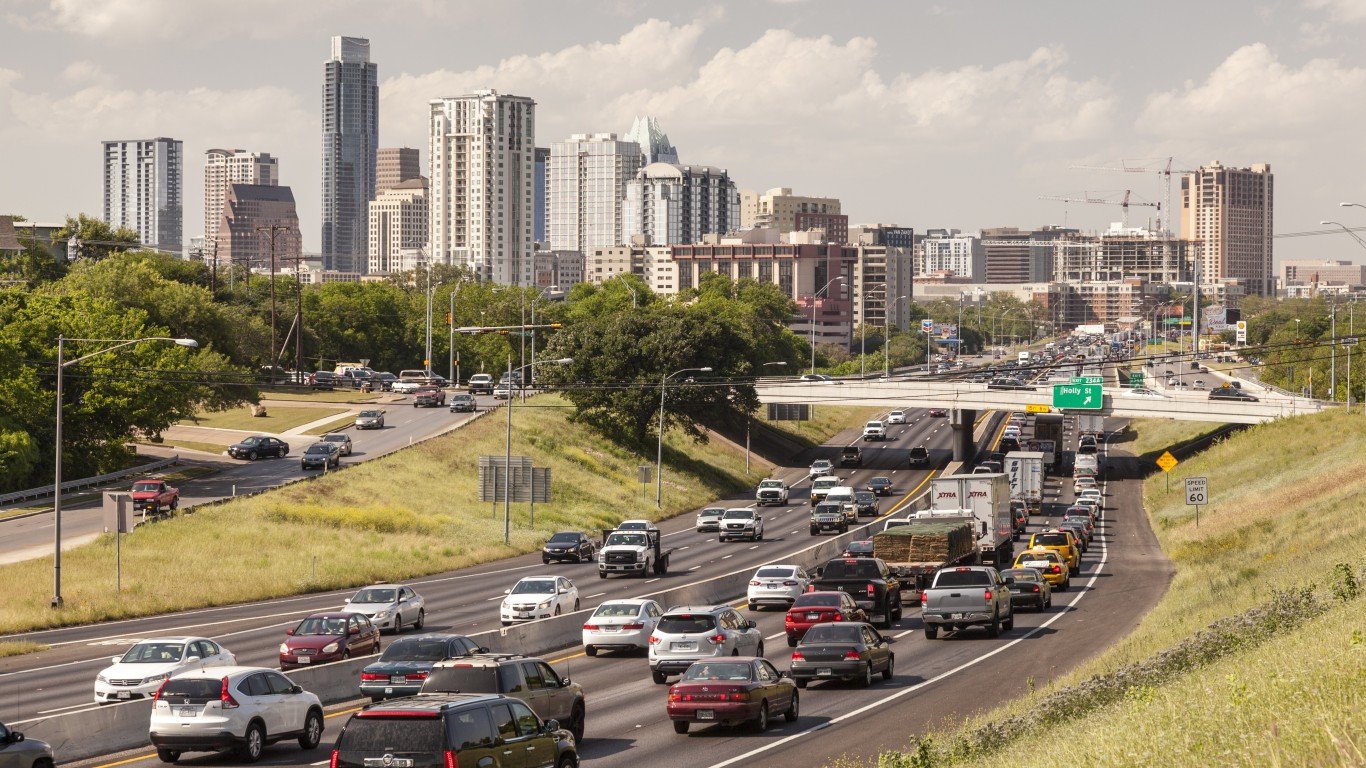
21. Austin-Round Rock-Georgetown, TX
> Avg. traffic delays per commuter in 2020: 41 hours (top 10% of 376 metro areas)
> Deadly crashes per 100,000 people, 2011-2020: 89 per 100,000 people (middle 50% of 376 metro areas)
> Share of deadly crashes caused by weather or road design/conditions: 26.2% (middle 50% of 376 metro areas)
> Share of driving deaths involving alcohol: 25.4% (middle 50% of 376 metro areas)

Source: ferrantraite / E+ via Getty Images
20. Richmond, VA
> Avg. traffic delays per commuter in 2020: 24 hours (top 25% of 376 metro areas)
> Deadly crashes per 100,000 people, 2011-2020: 79 per 100,000 people (middle 50% of 376 metro areas)
> Share of deadly crashes caused by weather or road design/conditions: 45.8% (top 10% of 376 metro areas)
> Share of driving deaths involving alcohol: 30.1% (middle 50% of 376 metro areas)
[in-text-ad]
Source: peeterv / E+ via Getty Images
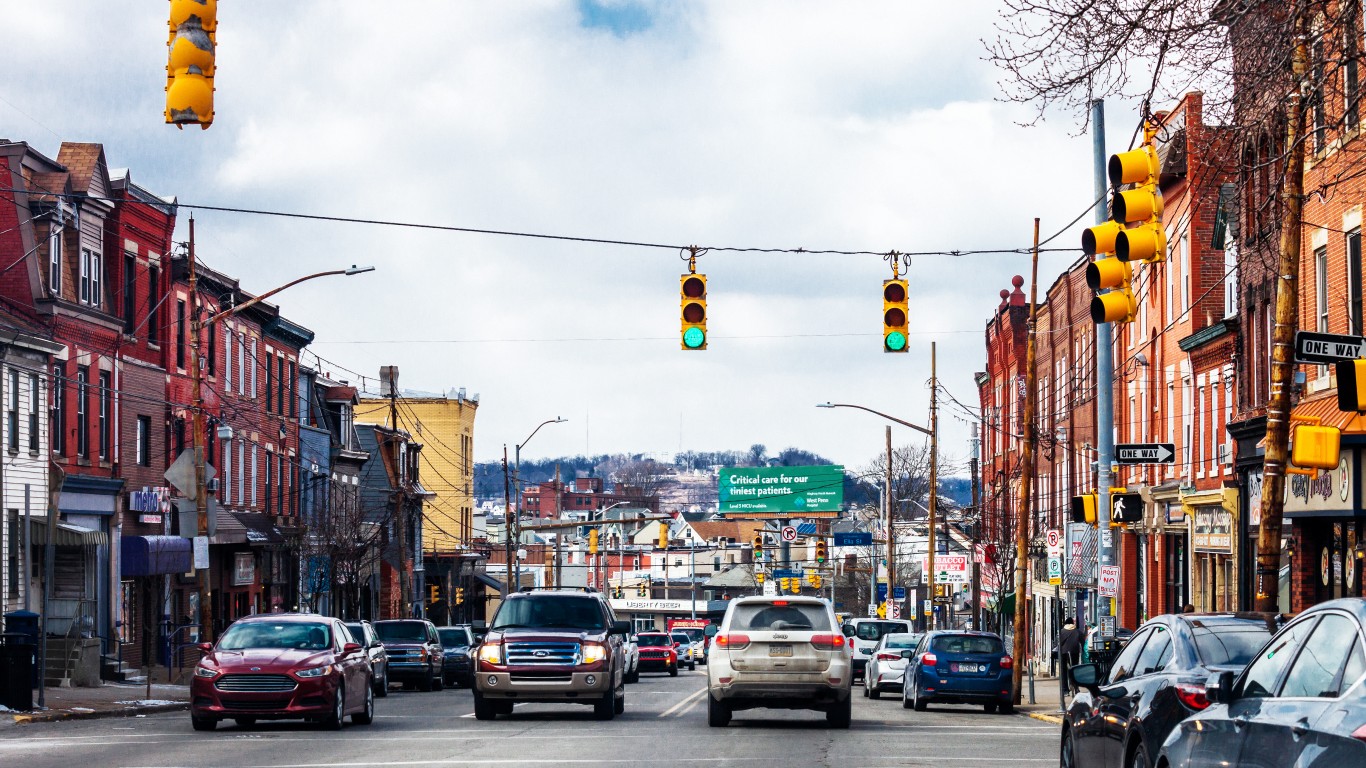
19. Pittsburgh, PA
> Avg. traffic delays per commuter in 2020: 25 hours (top 25% of 376 metro areas)
> Deadly crashes per 100,000 people, 2011-2020: 78 per 100,000 people (bottom 25% of 376 metro areas)
> Share of deadly crashes caused by weather or road design/conditions: 19.2% (bottom 25% of 376 metro areas)
> Share of driving deaths involving alcohol: 28.4% (middle 50% of 376 metro areas)
Source: peeterv / iStock Unreleased via Getty Images
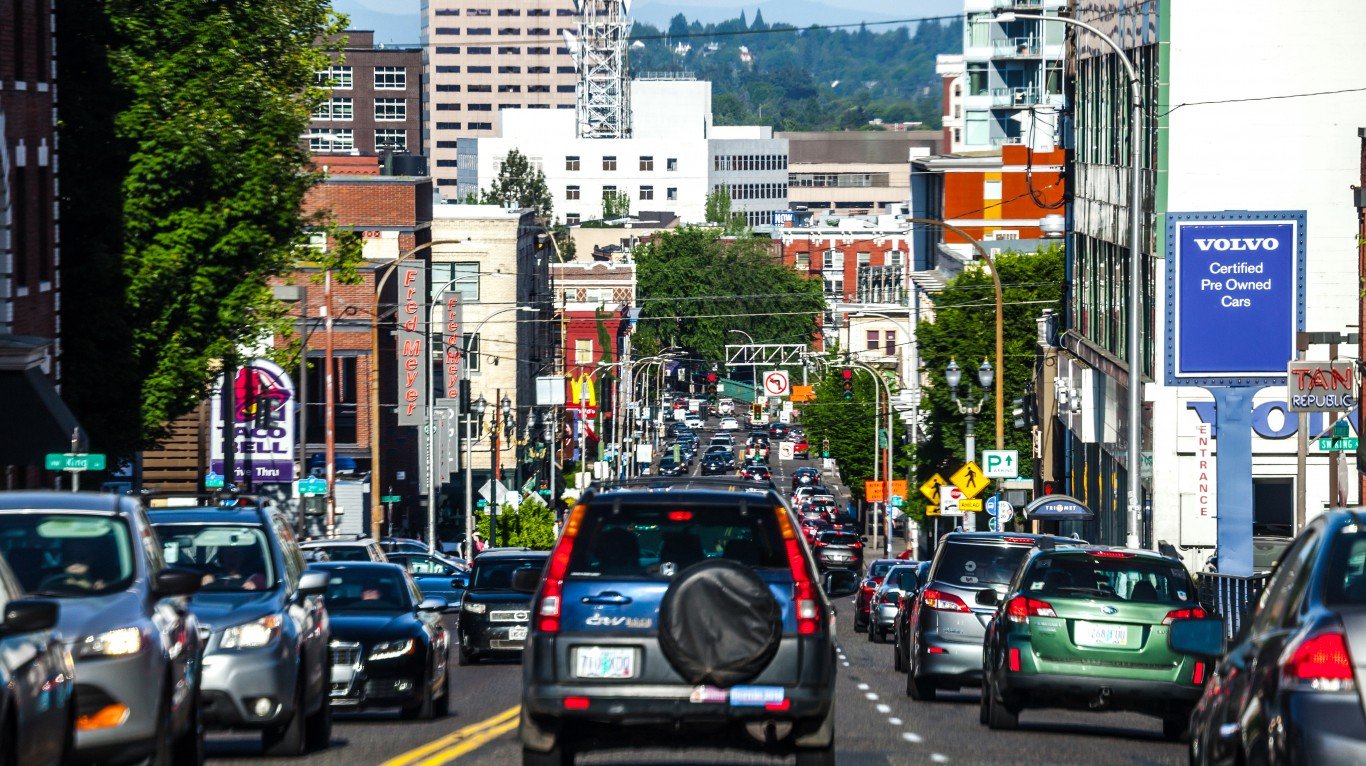
18. Portland-Vancouver-Hillsboro, OR-WA
> Avg. traffic delays per commuter in 2020: 31 hours (top 10% of 376 metro areas)
> Deadly crashes per 100,000 people, 2011-2020: 57 per 100,000 people (bottom 10% of 376 metro areas)
> Share of deadly crashes caused by weather or road design/conditions: 38.5% (top 25% of 376 metro areas)
> Share of driving deaths involving alcohol: 27.8% (middle 50% of 376 metro areas)
Source: dlewis33 / iStock via Getty Images
17. Little Rock-North Little Rock-Conway, AR
> Avg. traffic delays per commuter in 2020: 33 hours (top 10% of 376 metro areas)
> Deadly crashes per 100,000 people, 2011-2020: 131 per 100,000 people (middle 50% of 376 metro areas)
> Share of deadly crashes caused by weather or road design/conditions: 19.6% (middle 50% of 376 metro areas)
> Share of driving deaths involving alcohol: 24.9% (middle 50% of 376 metro areas)
[in-text-ad-2]
Source: peeterv / iStock via Getty Images
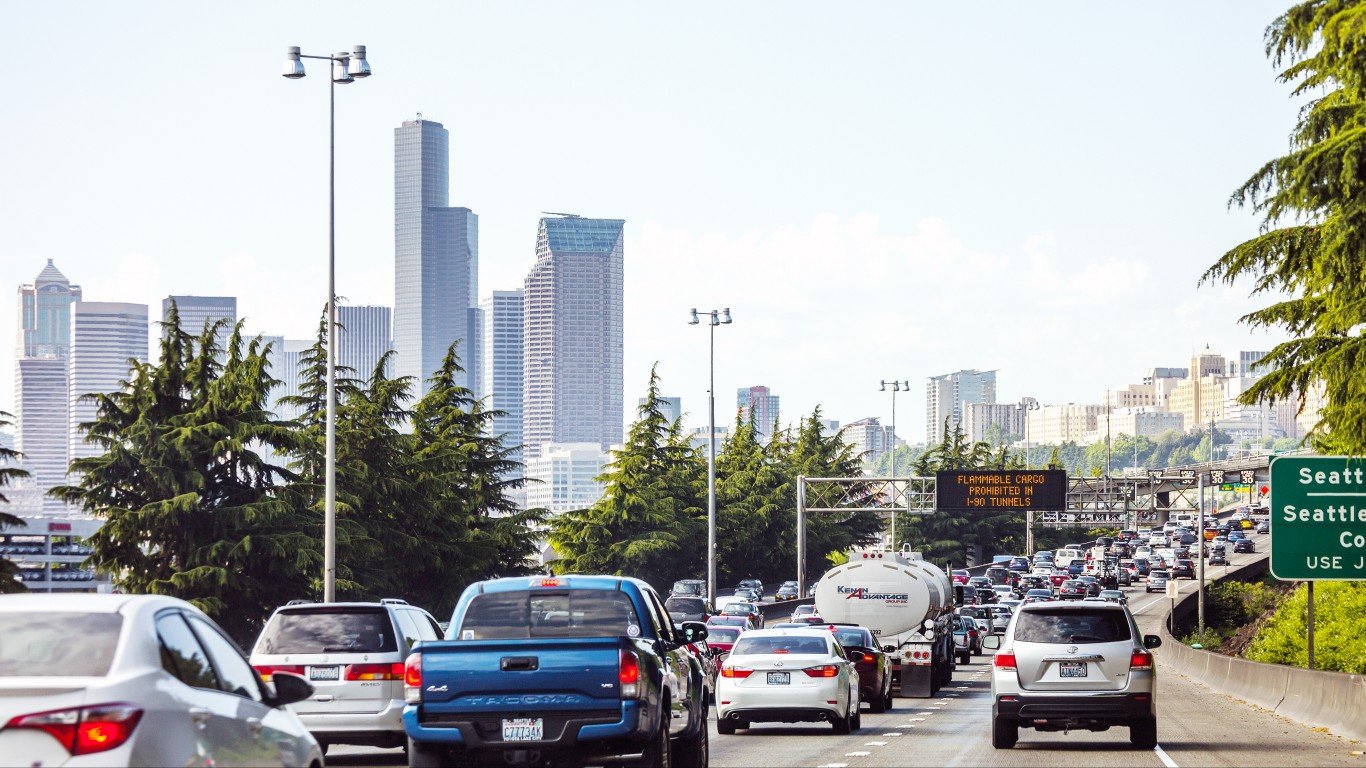
16. Seattle-Tacoma-Bellevue, WA
> Avg. traffic delays per commuter in 2020: 31 hours (top 10% of 376 metro areas)
> Deadly crashes per 100,000 people, 2011-2020: 47 per 100,000 people (bottom 10% of 376 metro areas)
> Share of deadly crashes caused by weather or road design/conditions: 35.0% (top 25% of 376 metro areas)
> Share of driving deaths involving alcohol: 31.7% (middle 50% of 376 metro areas)
Source: peeterv / iStock via Getty Images
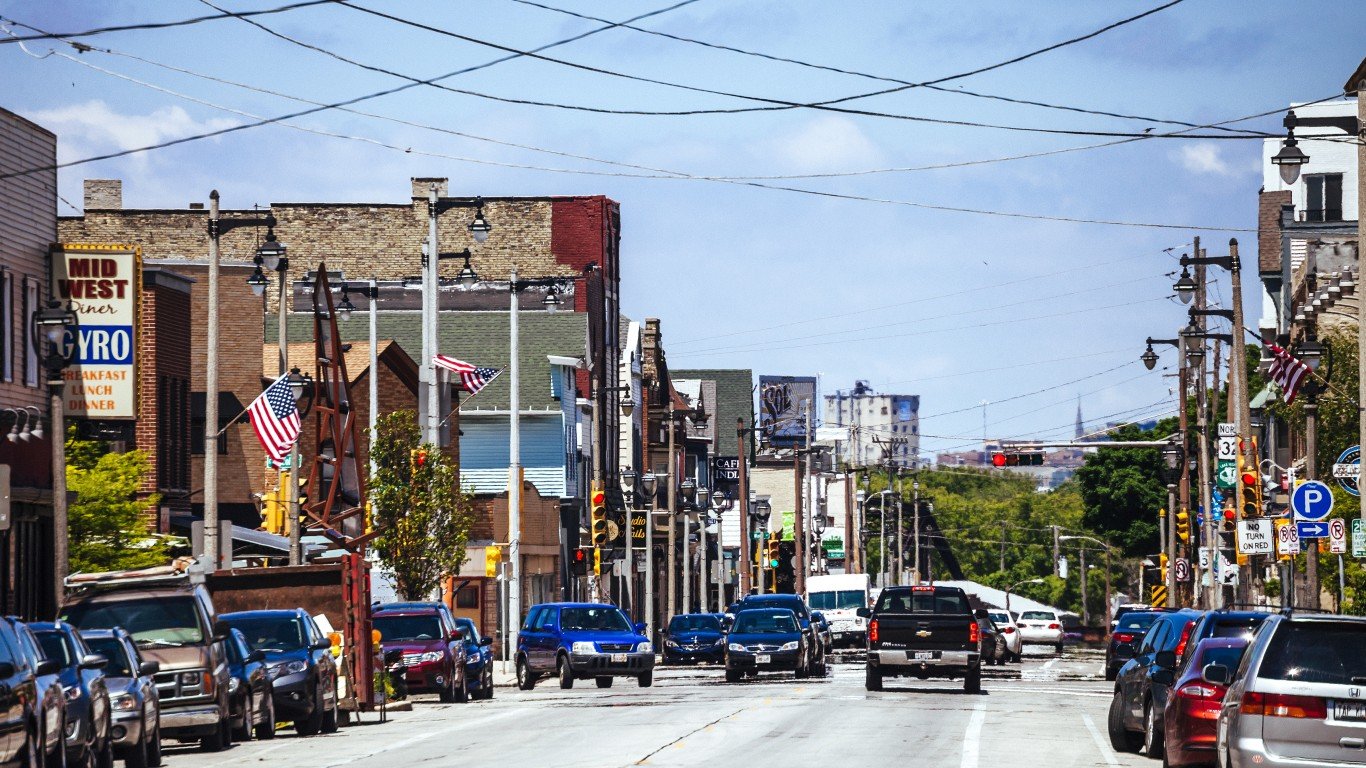
15. Milwaukee-Waukesha, WI
> Avg. traffic delays per commuter in 2020: 29 hours (top 10% of 376 metro areas)
> Deadly crashes per 100,000 people, 2011-2020: 63 per 100,000 people (bottom 25% of 376 metro areas)
> Share of deadly crashes caused by weather or road design/conditions: 44.2% (top 10% of 376 metro areas)
> Share of driving deaths involving alcohol: 28.0% (middle 50% of 376 metro areas)
[in-text-ad]
Source: NicholasBPhotography / iStock via Getty Images
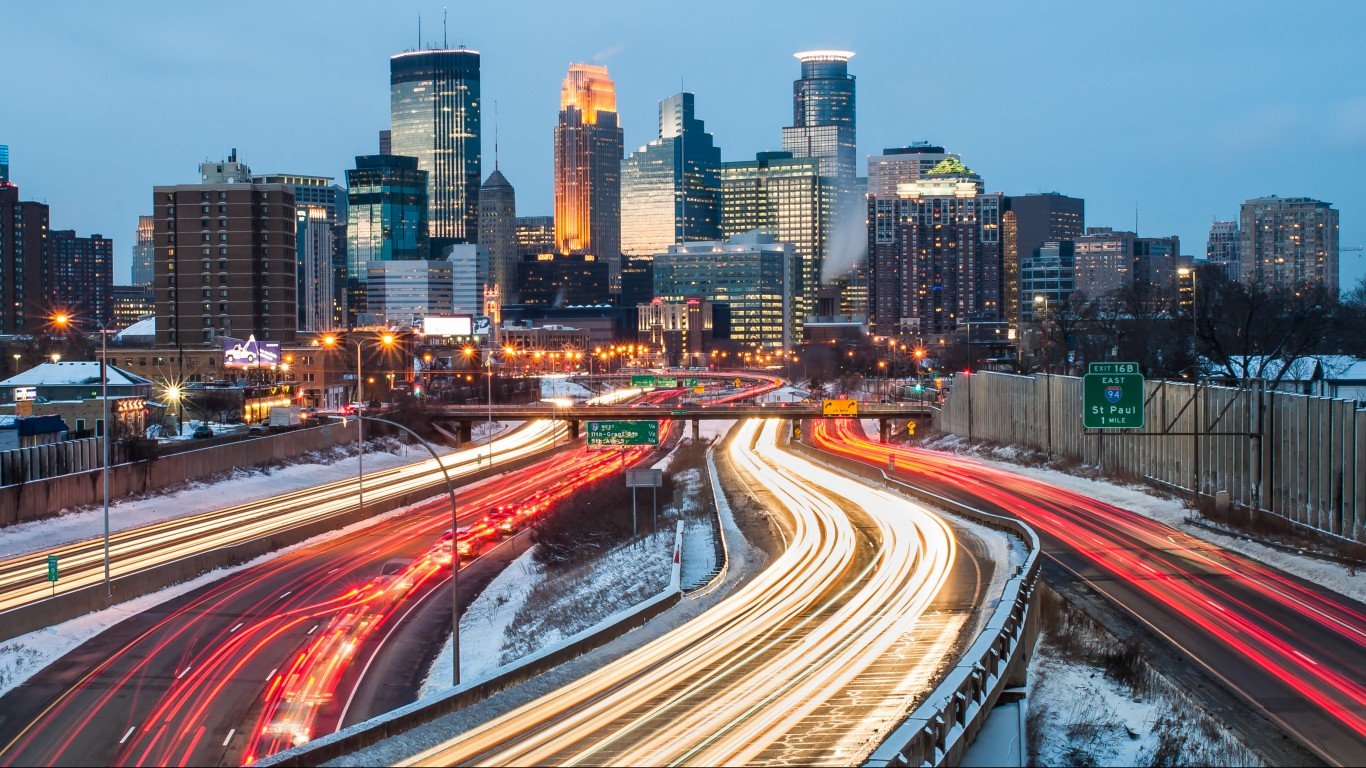
14. Minneapolis-St. Paul-Bloomington, MN-WI
> Avg. traffic delays per commuter in 2020: 32 hours (top 10% of 376 metro areas)
> Deadly crashes per 100,000 people, 2011-2020: 43 per 100,000 people (bottom 10% of 376 metro areas)
> Share of deadly crashes caused by weather or road design/conditions: 36.8% (top 25% of 376 metro areas)
> Share of driving deaths involving alcohol: 31.9% (middle 50% of 376 metro areas)
Source: peeterv / Getty Images
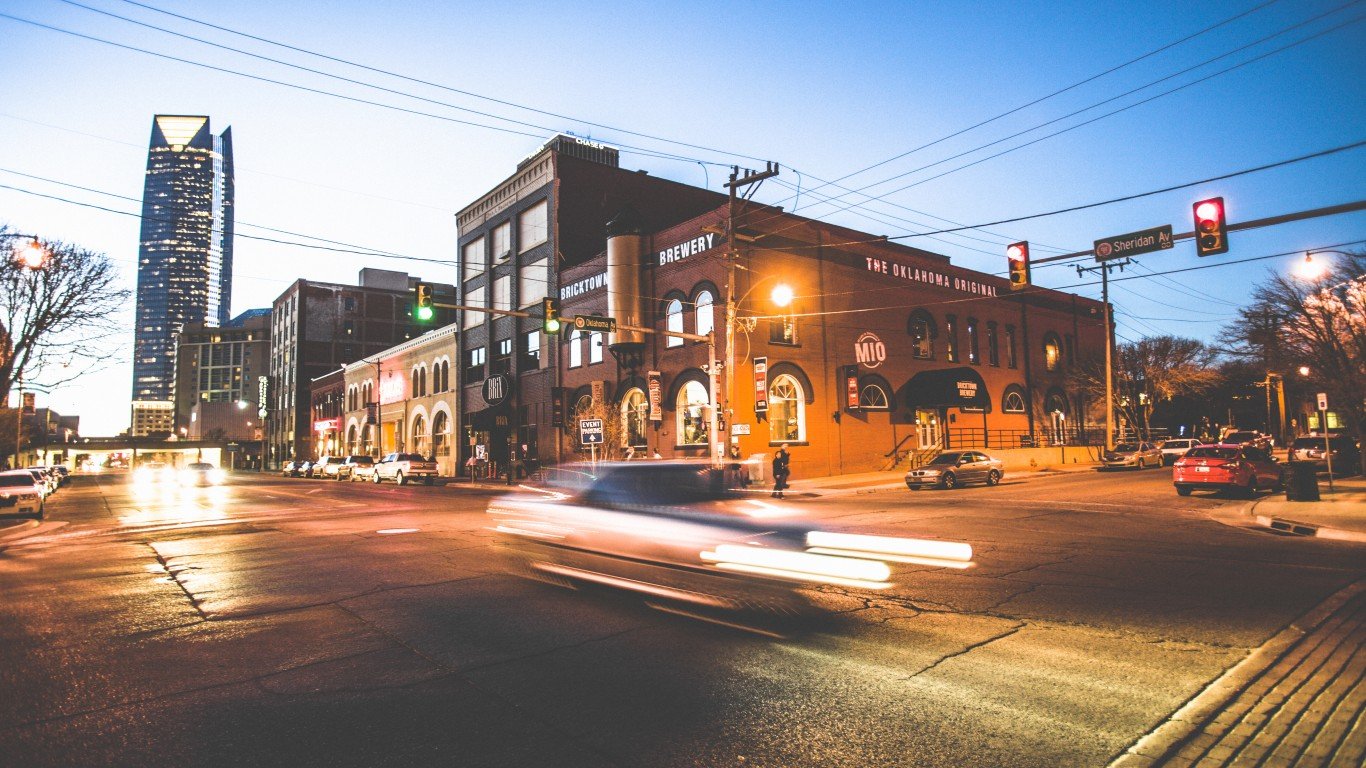
13. Oklahoma City, OK
> Avg. traffic delays per commuter in 2020: 35 hours (top 10% of 376 metro areas)
> Deadly crashes per 100,000 people, 2011-2020: 109 per 100,000 people (middle 50% of 376 metro areas)
> Share of deadly crashes caused by weather or road design/conditions: 38.0% (top 25% of 376 metro areas)
> Share of driving deaths involving alcohol: 27.8% (middle 50% of 376 metro areas)
Source: SeanPavonePhoto / iStock via Getty Images
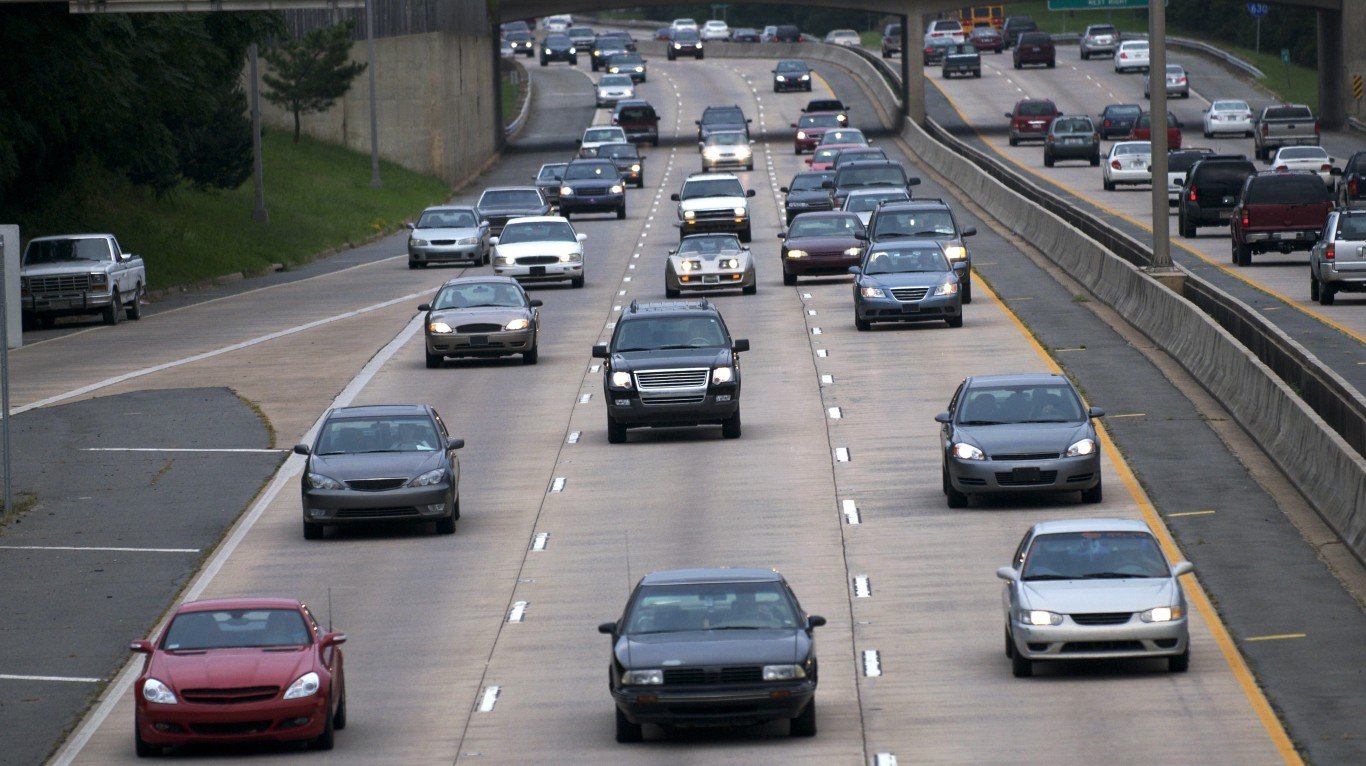
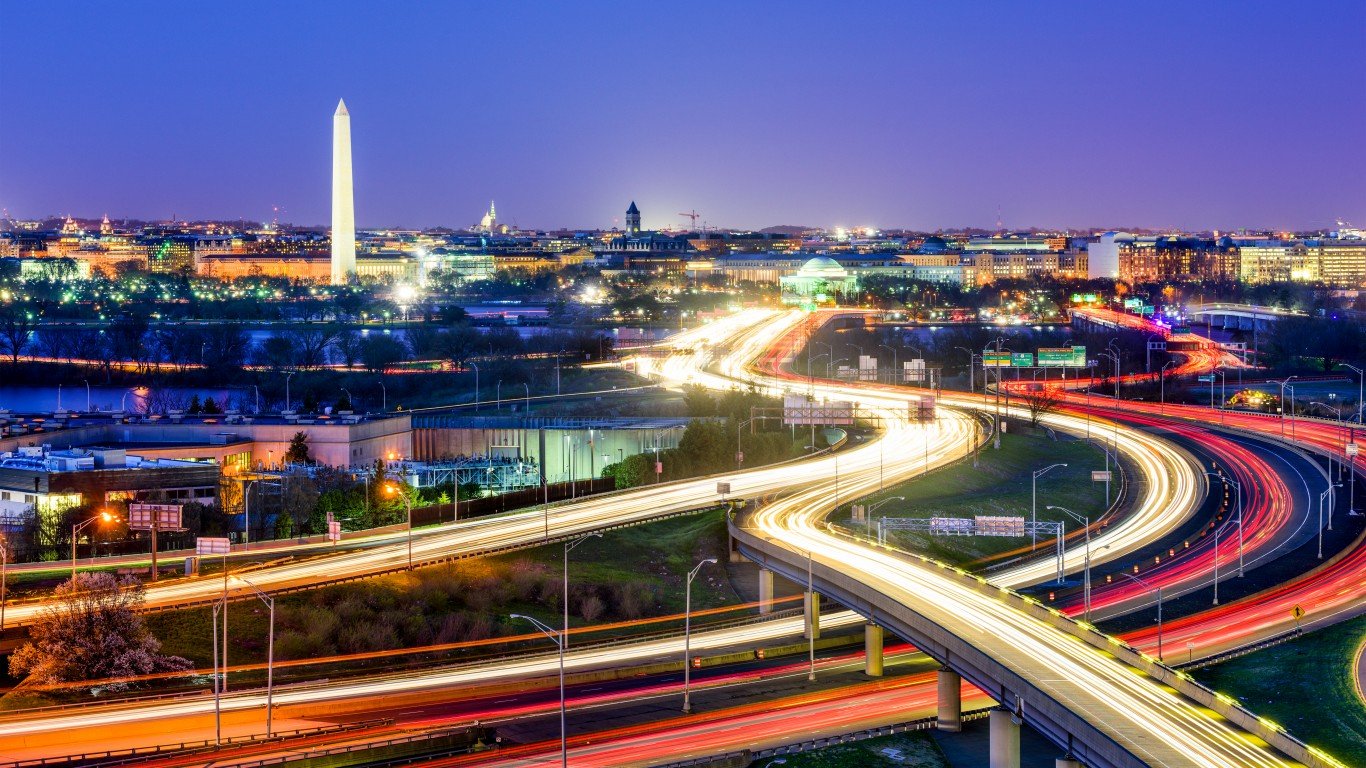
12. Washington-Arlington-Alexandria, DC-VA-MD-WV
> Avg. traffic delays per commuter in 2020: 42 hours (top 10% of 376 metro areas)
> Deadly crashes per 100,000 people, 2011-2020: 43 per 100,000 people (bottom 10% of 376 metro areas)
> Share of deadly crashes caused by weather or road design/conditions: 26.9% (middle 50% of 376 metro areas)
> Share of driving deaths involving alcohol: 29.0% (middle 50% of 376 metro areas)
[in-text-ad-2]
Source: RudyBalasko / Getty Images
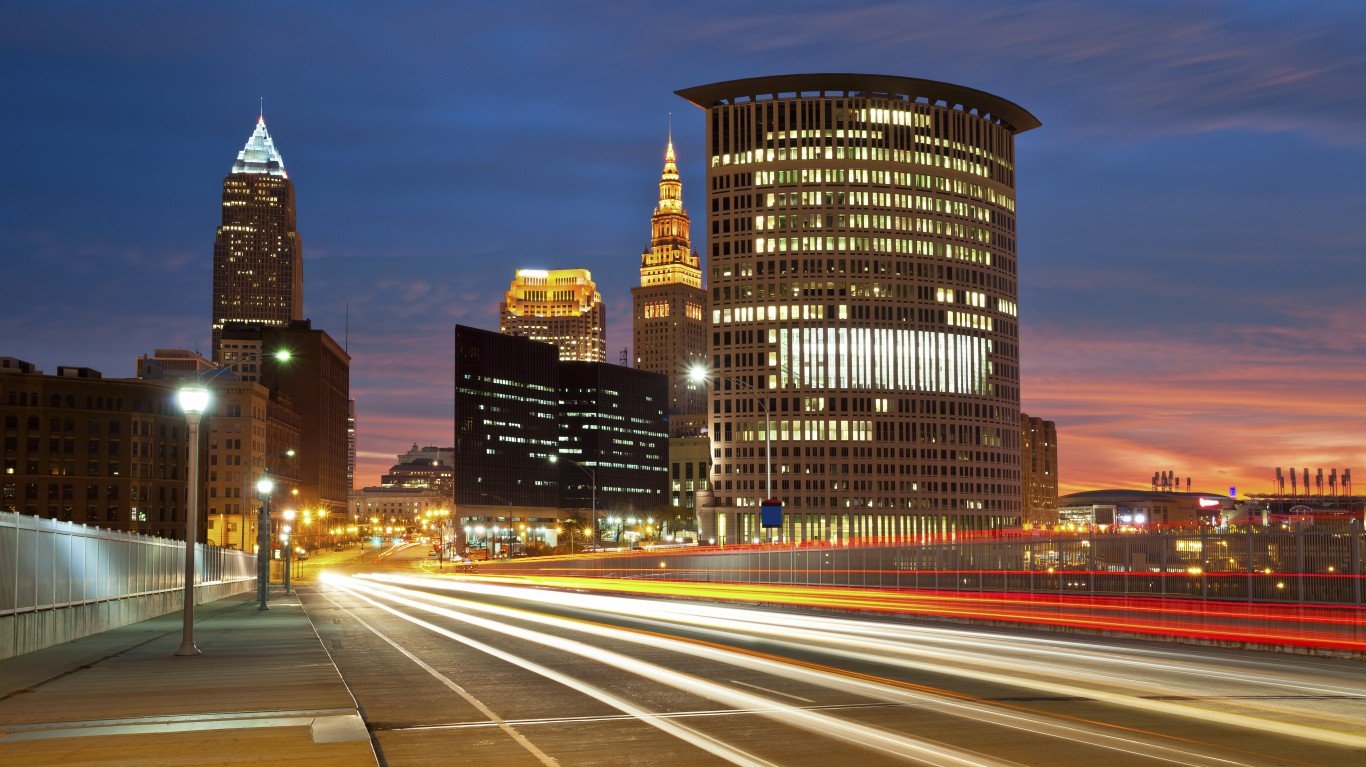
11. Cleveland-Elyria, OH
> Avg. traffic delays per commuter in 2020: 29 hours (top 10% of 376 metro areas)
> Deadly crashes per 100,000 people, 2011-2020: 59 per 100,000 people (bottom 10% of 376 metro areas)
> Share of deadly crashes caused by weather or road design/conditions: 42.4% (top 10% of 376 metro areas)
> Share of driving deaths involving alcohol: 40.4% (top 10% of 376 metro areas)
Source: DenisTangneyJr / iStock via Getty Images
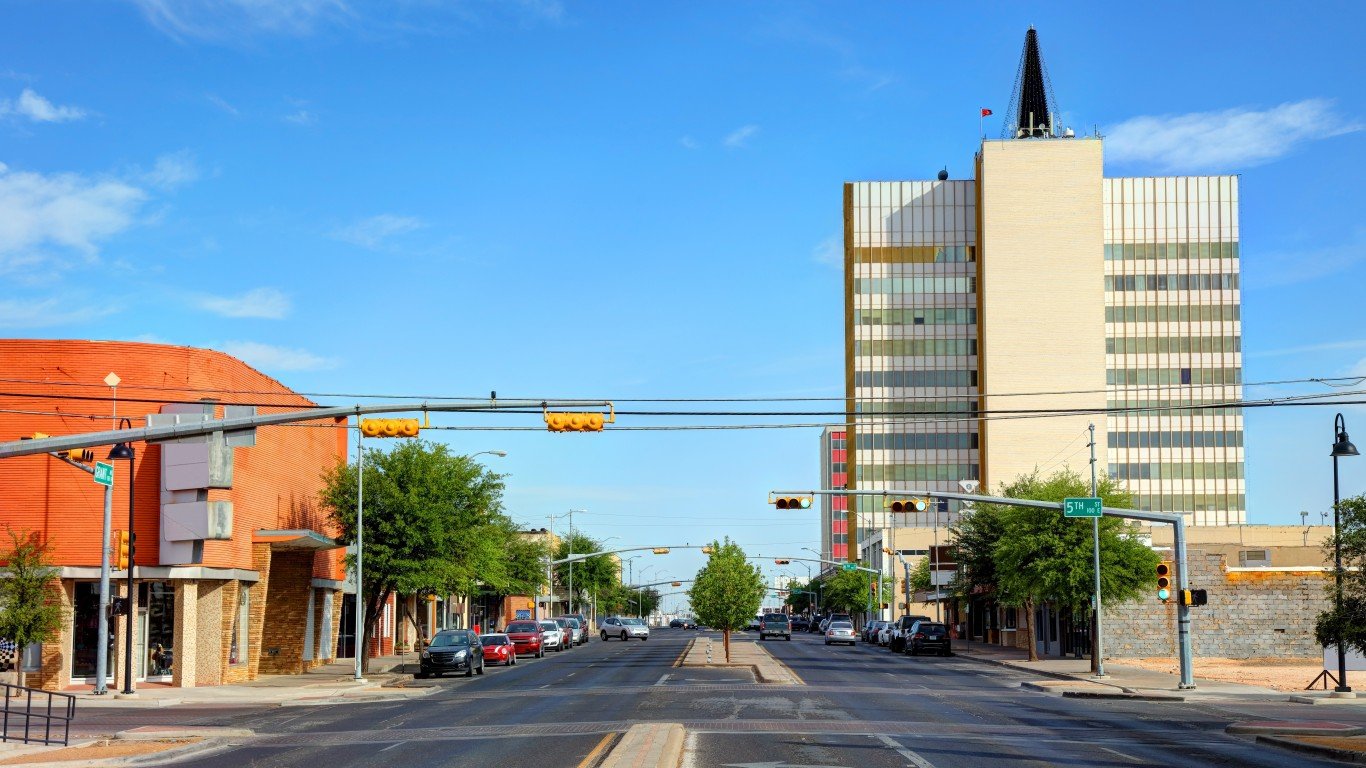
10. Odessa, TX
> Avg. traffic delays per commuter in 2020: 30 hours (top 10% of 376 metro areas)
> Deadly crashes per 100,000 people, 2011-2020: 253 per 100,000 people (top 10% of 376 metro areas)
> Share of deadly crashes caused by weather or road design/conditions: 13.2% (bottom 10% of 376 metro areas)
> Share of driving deaths involving alcohol: 37.1% (top 25% of 376 metro areas)
[in-text-ad]
Source: Jacob Boomsma / iStock via Getty Images
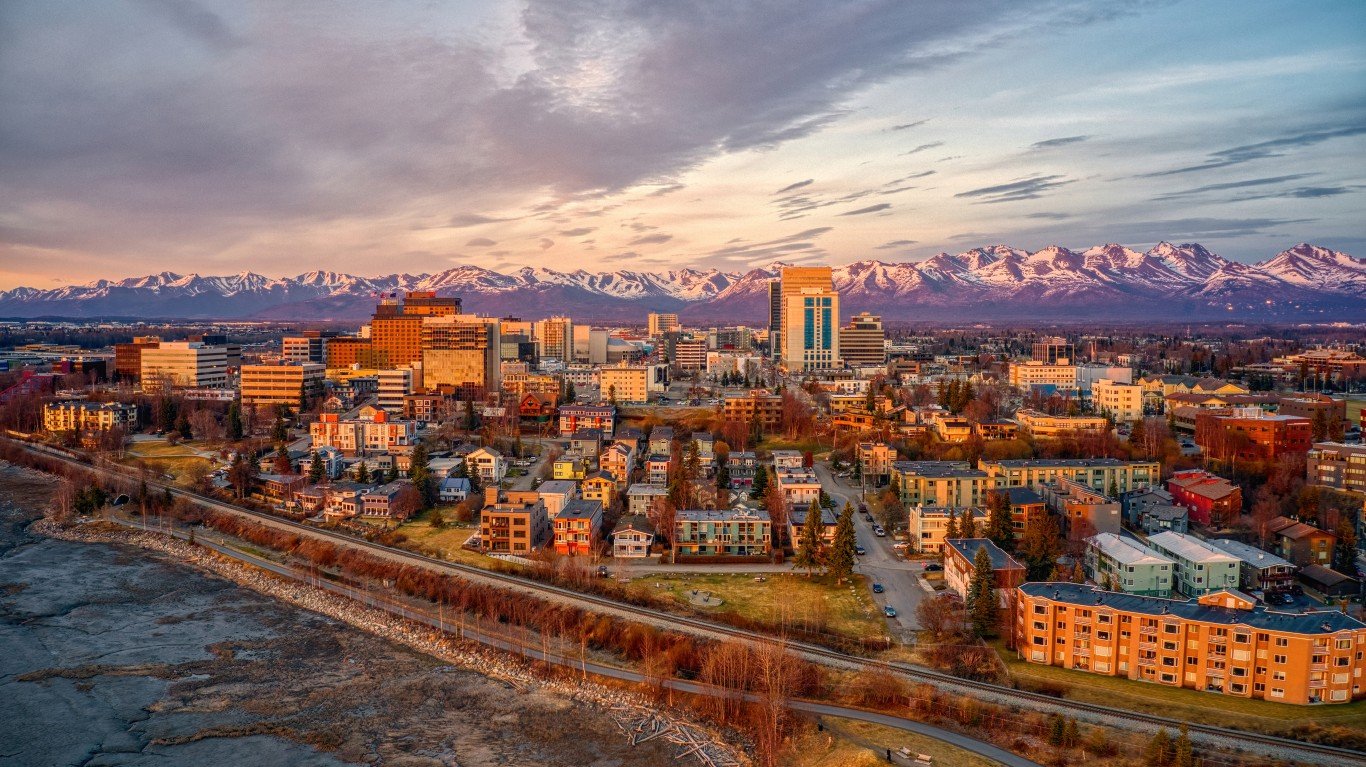
9. Anchorage, AK
> Avg. traffic delays per commuter in 2020: 18 hours (middle 50% of 376 metro areas)
> Deadly crashes per 100,000 people, 2011-2020: 82 per 100,000 people (middle 50% of 376 metro areas)
> Share of deadly crashes caused by weather or road design/conditions: 51.7% (top 10% of 376 metro areas)
> Share of driving deaths involving alcohol: 30.3% (middle 50% of 376 metro areas)
Source: ChrisBoswell / iStock via Getty Images
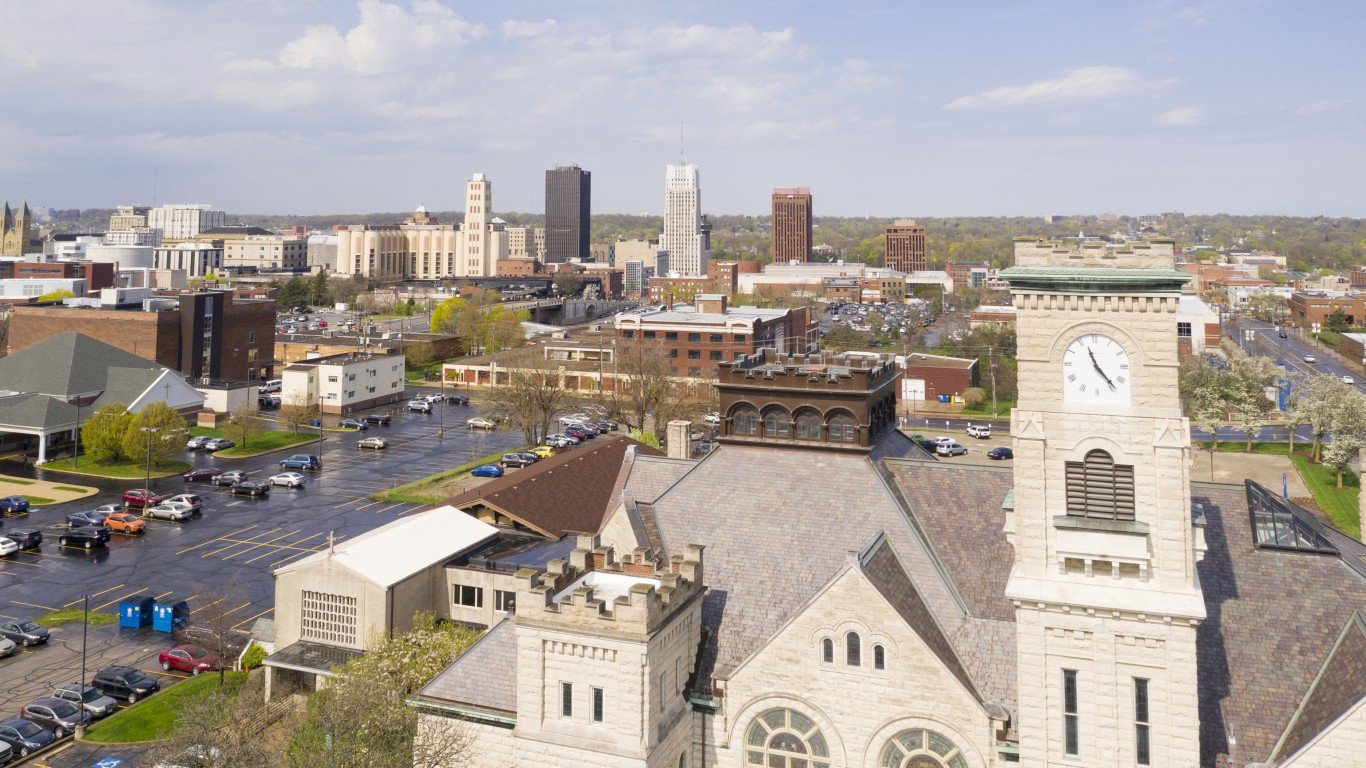
8. Akron, OH
> Avg. traffic delays per commuter in 2020: 27 hours (top 25% of 376 metro areas)
> Deadly crashes per 100,000 people, 2011-2020: 65 per 100,000 people (bottom 25% of 376 metro areas)
> Share of deadly crashes caused by weather or road design/conditions: 46.8% (top 10% of 376 metro areas)
> Share of driving deaths involving alcohol: 38.3% (top 10% of 376 metro areas)
Source: 4kodiak / E+ via Getty Images
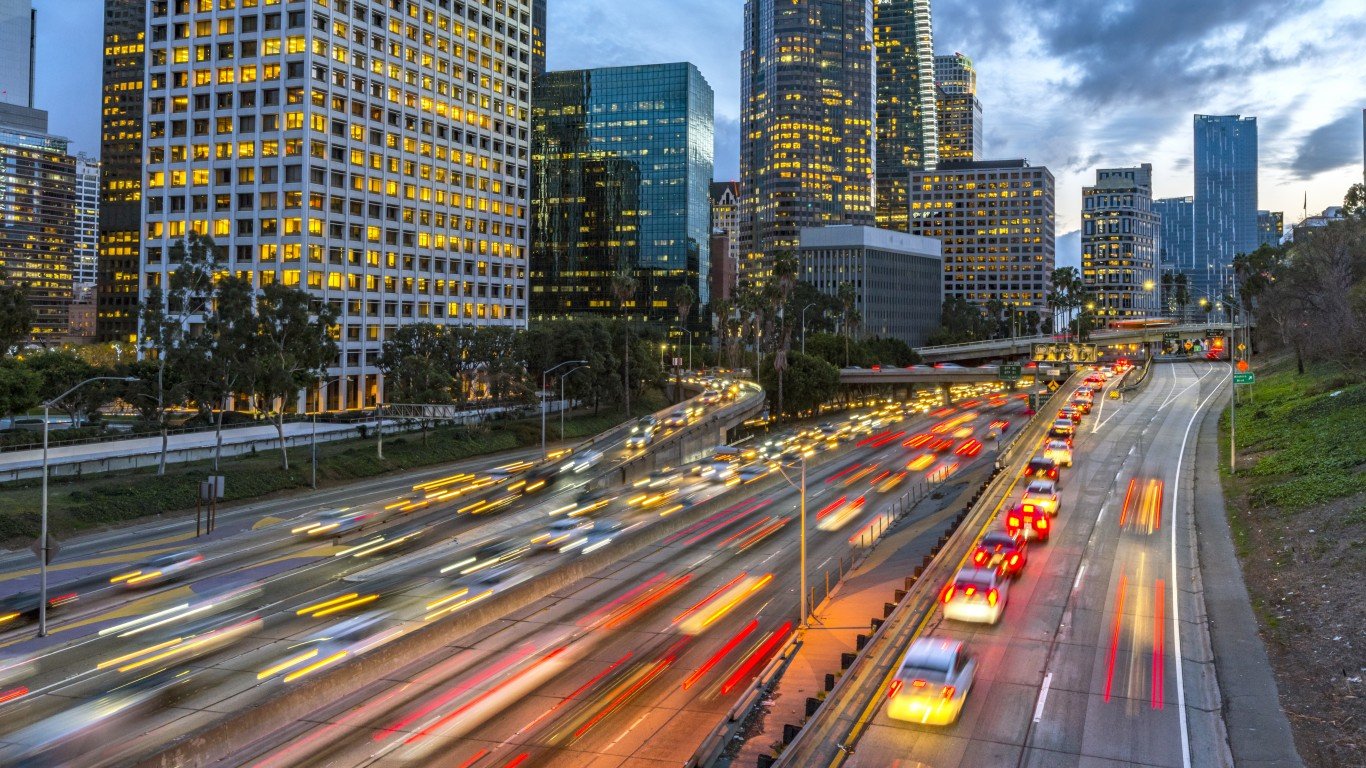
7. Los Angeles-Long Beach-Anaheim, CA
> Avg. traffic delays per commuter in 2020: 46 hours (top 10% of 376 metro areas)
> Deadly crashes per 100,000 people, 2011-2020: 62 per 100,000 people (bottom 10% of 376 metro areas)
> Share of deadly crashes caused by weather or road design/conditions: 13.9% (bottom 10% of 376 metro areas)
> Share of driving deaths involving alcohol: 23.0% (bottom 25% of 376 metro areas)
[in-text-ad-2]
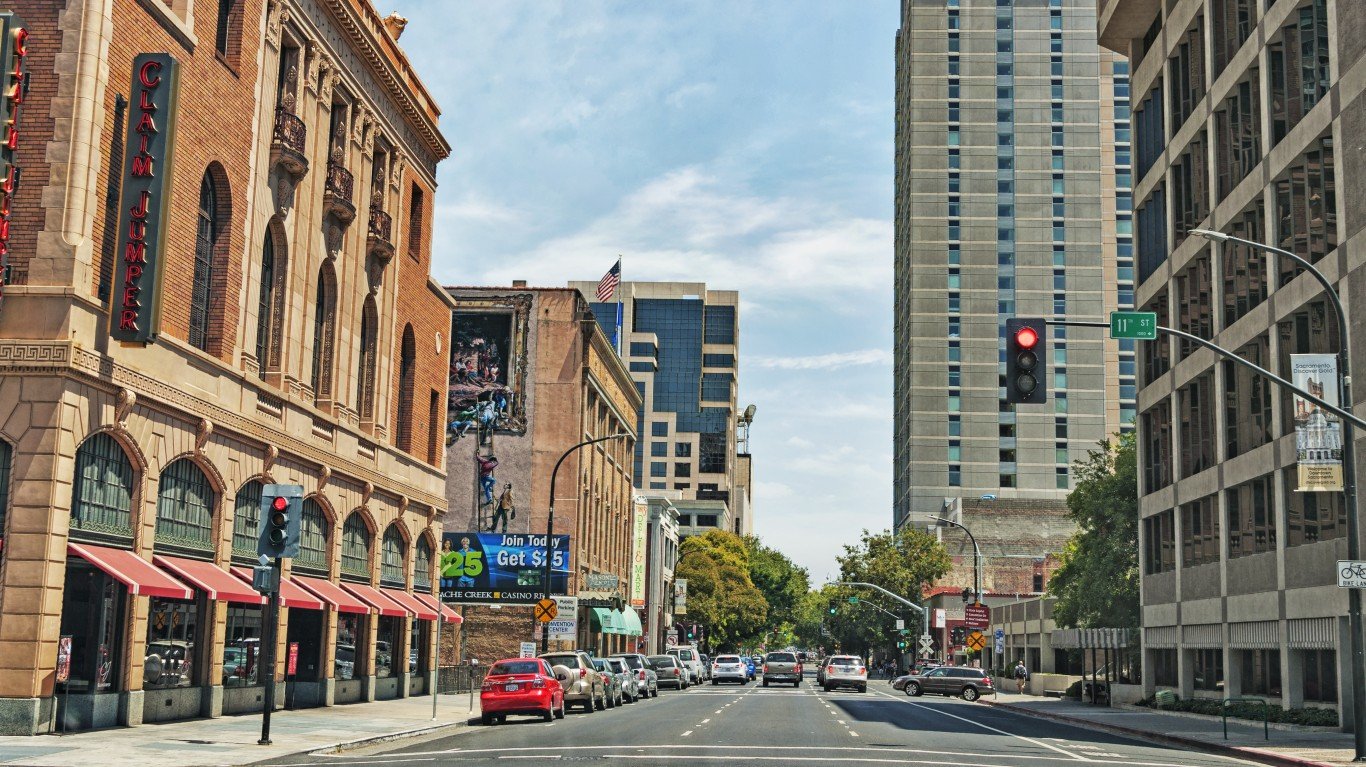
Source: jmoor17 / iStock Unreleased via Getty Images
6. Sacramento-Roseville-Folsom, CA
> Avg. traffic delays per commuter in 2020: 38 hours (top 10% of 376 metro areas)
> Deadly crashes per 100,000 people, 2011-2020: 85 per 100,000 people (middle 50% of 376 metro areas)
> Share of deadly crashes caused by weather or road design/conditions: 18.7% (bottom 25% of 376 metro areas)
> Share of driving deaths involving alcohol: 27.3% (middle 50% of 376 metro areas)
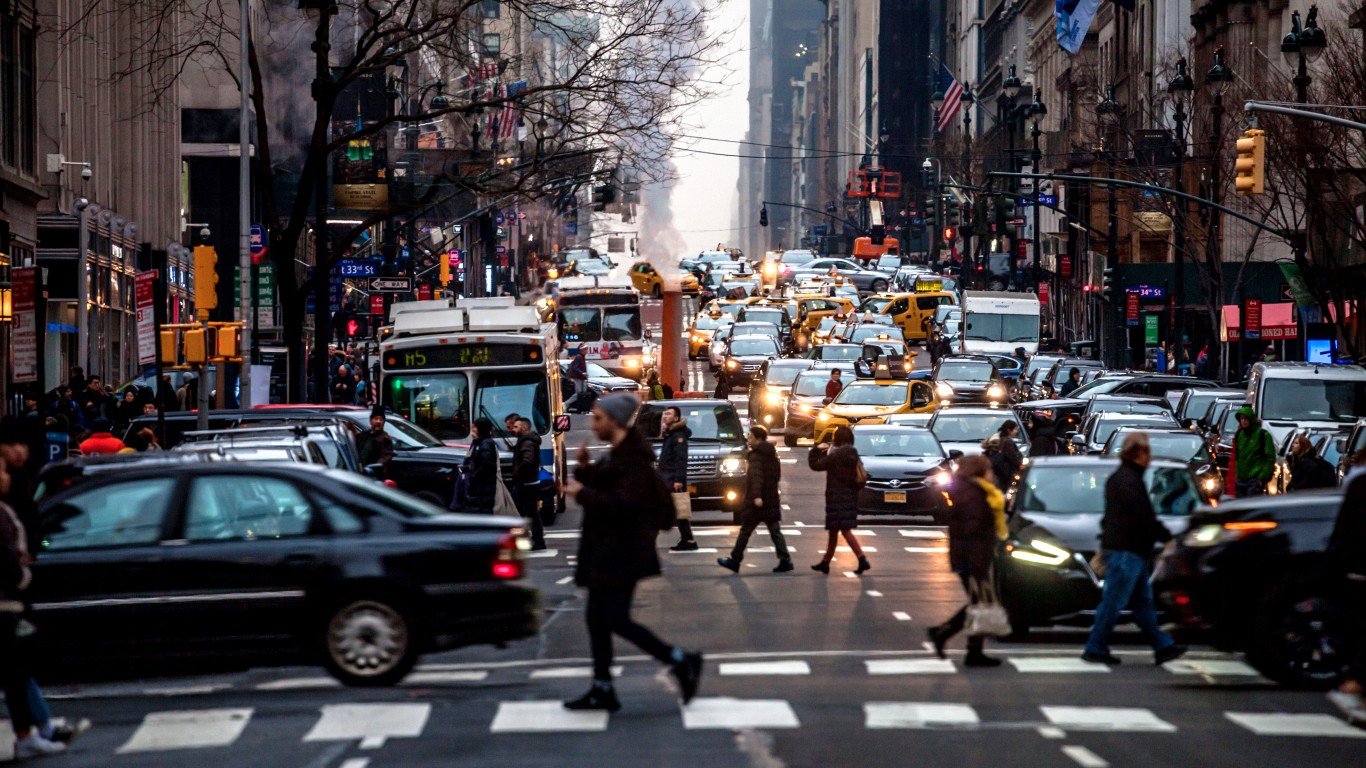
Source: peeterv / iStock via Getty Images
5. New York-Newark-Jersey City, NY-NJ-PA
> Avg. traffic delays per commuter in 2020: 56 hours (top 10% of 376 metro areas)
> Deadly crashes per 100,000 people, 2011-2020: 43 per 100,000 people (bottom 10% of 376 metro areas)
> Share of deadly crashes caused by weather or road design/conditions: 24.7% (middle 50% of 376 metro areas)
> Share of driving deaths involving alcohol: 19.2% (bottom 10% of 376 metro areas)
[in-text-ad]
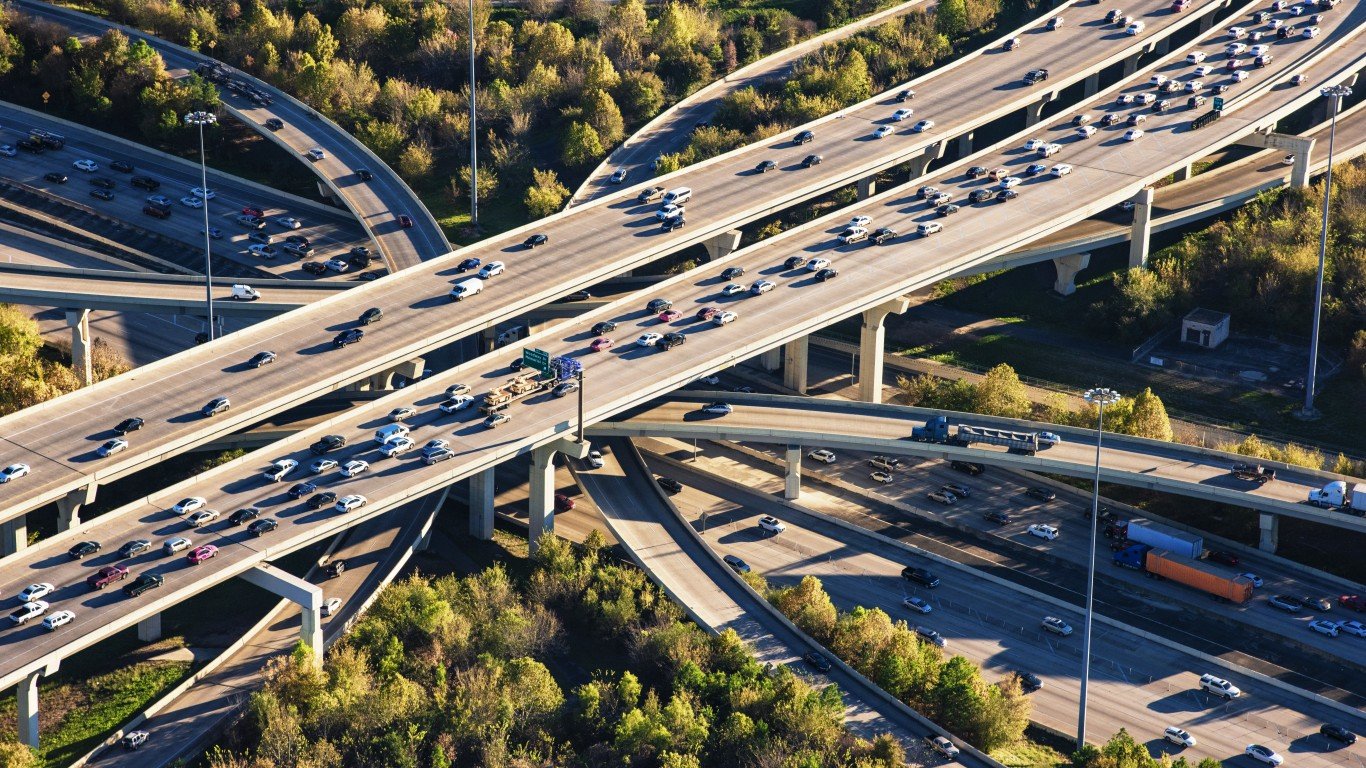
Source: Art Wager / E+ via Getty Images
4. Houston-The Woodlands-Sugar Land, TX
> Avg. traffic delays per commuter in 2020: 49 hours (top 10% of 376 metro areas)
> Deadly crashes per 100,000 people, 2011-2020: 85 per 100,000 people (middle 50% of 376 metro areas)
> Share of deadly crashes caused by weather or road design/conditions: 28.6% (middle 50% of 376 metro areas)
> Share of driving deaths involving alcohol: 30.7% (middle 50% of 376 metro areas)
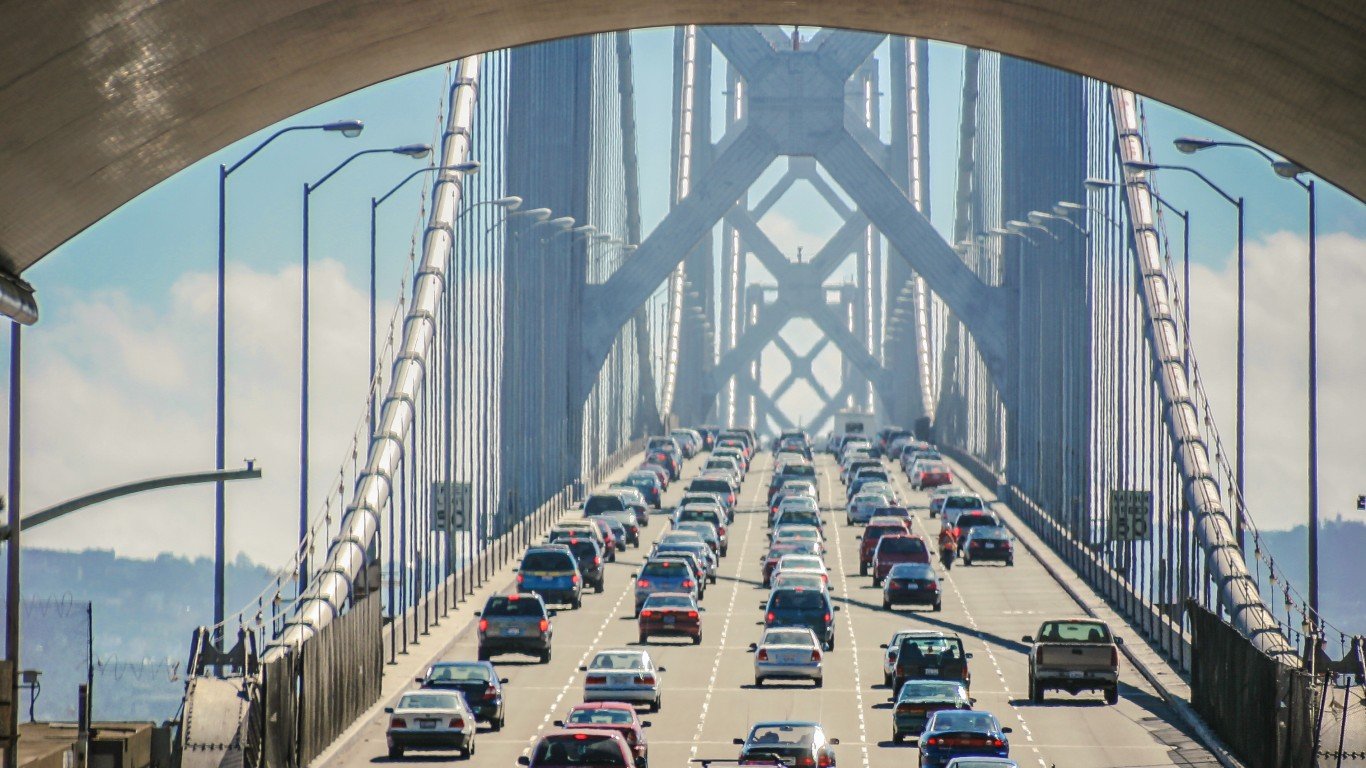
Source: MasaoTaira / iStock via Getty Images
3. San Francisco-Oakland-Berkeley, CA
> Avg. traffic delays per commuter in 2020: 46 hours (top 10% of 376 metro areas)
> Deadly crashes per 100,000 people, 2011-2020: 47 per 100,000 people (bottom 10% of 376 metro areas)
> Share of deadly crashes caused by weather or road design/conditions: 22.3% (middle 50% of 376 metro areas)
> Share of driving deaths involving alcohol: 23.7% (middle 50% of 376 metro areas)

2. Boston-Cambridge-Newton, MA-NH
> Avg. traffic delays per commuter in 2020: 50 hours (top 10% of 376 metro areas)
> Deadly crashes per 100,000 people, 2011-2020: 42 per 100,000 people (bottom 10% of 376 metro areas)
> Share of deadly crashes caused by weather or road design/conditions: 26.2% (middle 50% of 376 metro areas)
> Share of driving deaths involving alcohol: 30.4% (middle 50% of 376 metro areas)
[in-text-ad-2]
Source: lippyjr / iStock Editorial via Getty Images
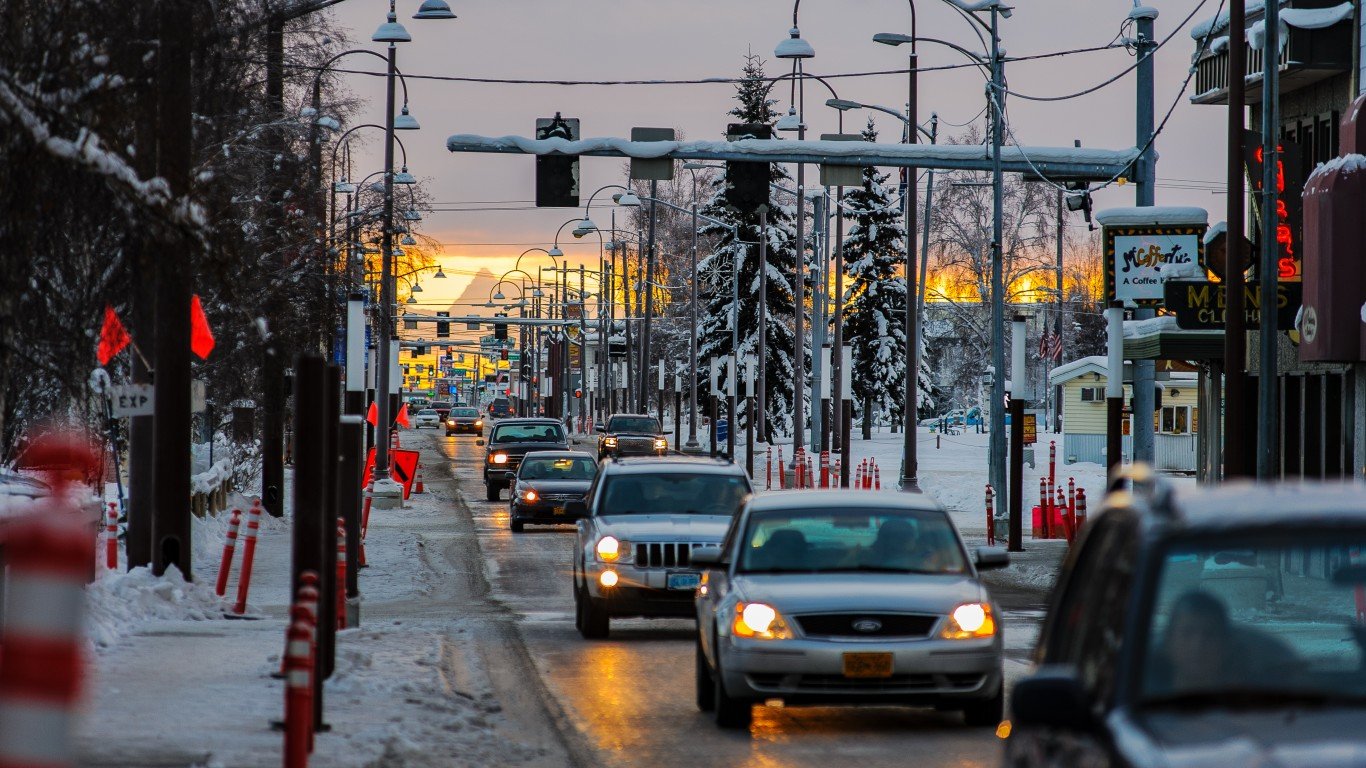
1. Fairbanks, AK
> Avg. traffic delays per commuter in 2020: 14 hours (middle 50% of 376 metro areas)
> Deadly crashes per 100,000 people, 2011-2020: 85 per 100,000 people (middle 50% of 376 metro areas)
> Share of deadly crashes caused by weather or road design/conditions: 38.1% (top 25% of 376 metro areas)
> Share of driving deaths involving alcohol: 37.0% (top 25% of 376 metro areas)
Methodology
To identify the worst cities to drive in, 24/7 Wall St. created a weighted index of six measures for 376 metropolitan statistical areas with available data.
Four of those measures were included at full weight: 1) the share of deadly motor vehicle accidents for which atmospheric conditions – such as snow, rain, or fog – were determined to be a factor over the decade between 2011 and 2020; 2) the share of deadly motor vehicle accidents for which roadway conditions – such as inadequate signage, crumbling pavement, poor design, or obscured pavement markings – were determined to be a factor over the decade between 2011 and 2022; 3) number of deadly accidents for every 100,000 people from 2011 to 2020; and 4) the share of all driving deaths involving an alcohol impaired motorist from 2016 to 2020.
Data on the total deadly accidents from 2011 to 2020 and the share of those accidents for which either atmospheric or roadway conditions were a factor, came from the National Highway Traffic Safety Administration’s Fatality and Injury Reporting System Tool. The number of deadly accidents per 100,000 people was calculated using five-year metro population estimates from the U.S. Census Bureau’s 2020 American Community Survey. Finally, data on the share of all driving deaths involving an alcohol impaired motorist from 2016 to 2020 came from County Health Rankings & Roadmaps,a joint program of the University of Wisconsin Population Health Institute and Robert Wood Johnson Foundation.
Our index also included the average annual time lost to traffic congestion per driver in 2020 at double weight. Data for this measure came from the 2021 Urban Mobility Report, published by The Texas A&M Transportation Institute.
The final index measure, included at half weight, was the average price of a regular gallon of gas at the state level as of Nov. 28, 2022, as reported by AAA. For metro areas that span multiple states, the primary state of the metro area was used.
Sponsored: Want to Retire Early? Here’s a Great First Step
Want retirement to come a few years earlier than you’d planned? Or are you ready to retire now, but want an extra set of eyes on your finances?
Now you can speak with up to 3 financial experts in your area for FREE. By simply clicking here you can begin to match with financial professionals who can help you build your plan to retire early. And the best part? The first conversation with them is free.
Click here to match with up to 3 financial pros who would be excited to help you make financial decisions.
Thank you for reading! Have some feedback for us?
Contact the 24/7 Wall St. editorial team.
Editors' Picks