Newark, New Jersey has become an American leader in fostering collaboration between police and community leaders with the goal of helping reduce police violence and build trust between community and cops. This initiative comes partly in response to the fact that a dozen people were killed by Newark police officers from 2013 to 2022, nearly two-thirds of whom were Black. Half of those killed weren’t armed, and one in every four was fleeing.
Newark is not the only police department with disproportionate police killings. To determine the police department that has killed the most people in each state, 24/7 Wall St. reviewed data from Mapping Police Violence, a research collaborative that collects data on police killings across the nation from three large crowdsourced databases. Data was accessed on Feb. 22, 2023, and includes all police department killings from 2013 through the end of 2022.
Three of the cities on the list have killed more than 100 suspects from 2013 to 2022, led by the Los Angeles Police Department with 167 killings, followed by the Phoenix PD with 142 killings, and the NYPD with 102 killings. New York and L.A. are the two largest U.S. cities by population, but Phoenix is the fifth most-populous city. Still, its police officers have killed more suspects than the larger cities of Chicago and Houston, 142 compared to 92 and 97, respectively.
Out of these three cities, the NYPD disproportionately killed more Black suspects than police in Los Angeles and Phoenix. According to the U.S. Census Bureau, about 23% of New York City residents are Black, but two-thirds of the 102 people killed by NYPD officers were identified as Black. An additional 57% did not have a firearm at the time they were killed, and about 35% were fleeing. (New York City has far and away the largest police department in the U.S.)
The proportion of Black suspects killed was even higher in some cities. At least three out of four suspects killed by law enforcement in eight of the 50 deadliest U.S. police departments by state were Black, led by the police departments of St. Louis, Detroit, and Atlanta, where between 91% and 96% of people killed by police officers in this 10-year-period were Black.
At least 75% of suspects killed by officers in three of the deadliest U.S. police departments by state did not have a firearm: police departments in Burlington, Vermont, Honolulu, and the Connecticut State Police. In fact, in 21 of these 50 police departments, at least half of killed suspects did not have a firearm. (These are the most militarized local police departments in America.)
As far as discipline is concerned, police in 27 of the 50 deadliest U.S. police departments by state received no disciplinary actions for their involvement in the killings of 661 people from 2013 to 2022.
In 10 states, at least one in 10 officers involved in these extrajudicial killings received some form of disciplinary action, led by the Newark Police Department, where 36% of officers involved in the killing of those dozen suspects from 2013 to 2022 received some form of punishment.
Here are the U.S. police departments that have killed the most people in every state.
Click here to see our detailed methodology.

Source: Courtesy of Birmingham Police Department, Alabama via Facebook
Alabama: Birmingham Police Department
> Documented police killings (2013-2022): 13 — #139 most (6.2% of state killings)
> Police killings in 2022: 1
> % of those killed who were Black: 61.5% (total: 8)
> % of those killed who did not have a gun: 30.8% (total: 4)
> % of those killed who were fleeing: 50.0% (total: 4)
> % of cases officer was disciplined or charged with a crime: 10.0% (total: 1)
[in-text-ad]
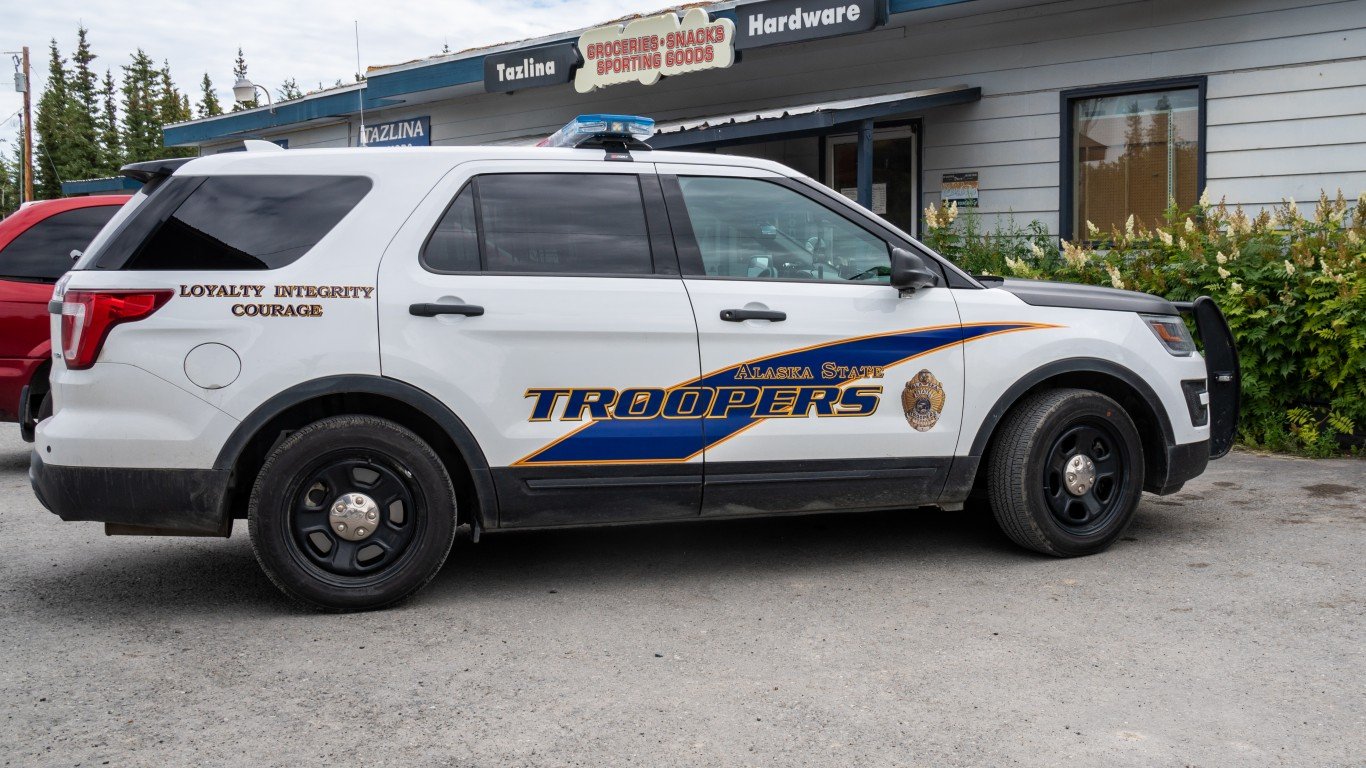
Source: Melissa Kopka / iStock Editorial via Getty Images
Alaska: Alaska State Troopers
> Documented police killings (2013-2022): 24 — #60 most (36.9% of state killings)
> Police killings in 2022: 2
> % of those killed who were Black: 4.8% (total: 1)
> % of those killed who did not have a gun: 43.5% (total: 10)
> % of those killed who were fleeing: 29.4% (total: 5)
> % of cases officer was disciplined or charged with a crime: 0.0% (total: 0)
 24/7 Wall St.
Arizona: Phoenix Police Department
> Documented police killings (2013-2022): 142 — #2 most (28.9% of state killings)
> Police killings in 2022: 10
> % of those killed who were Black: 17.4% (total: 23)
> % of those killed who did not have a gun: 47.9% (total: 67)
> % of those killed who were fleeing: 30.2% (total: 29)
> % of cases officer was disciplined or charged with a crime: 0.0% (total: 0)
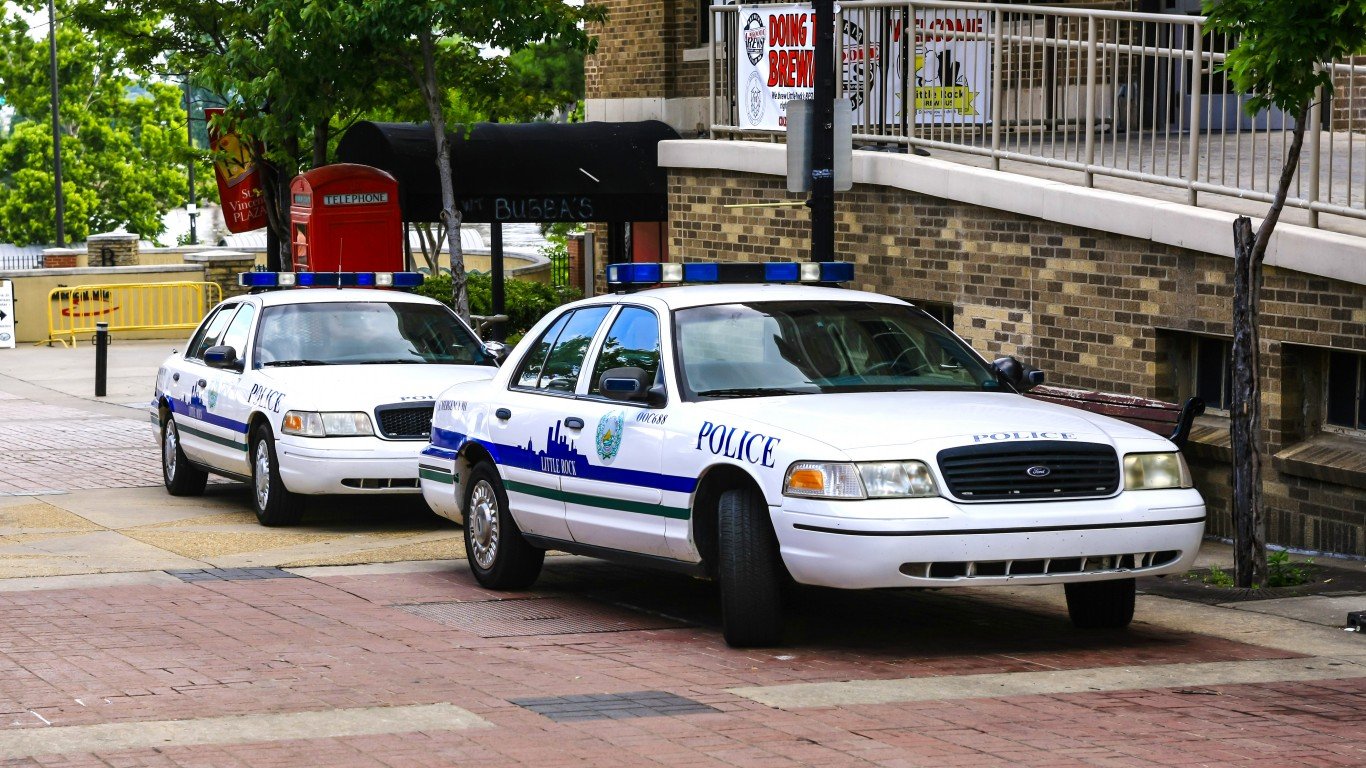
Source: csfotoimages / iStock Editorial via Getty Images
Arkansas: Arkansas State Police
> Documented police killings (2013-2022): 15 — #111 most (10.2% of state killings)
> Police killings in 2022: 2
> % of those killed who were Black: 46.2% (total: 6)
> % of those killed who did not have a gun: 46.7% (total: 7)
> % of those killed who were fleeing: 66.7% (total: 6)
> % of cases officer was disciplined or charged with a crime: 0.0% (total: 0)
[in-text-ad-2]
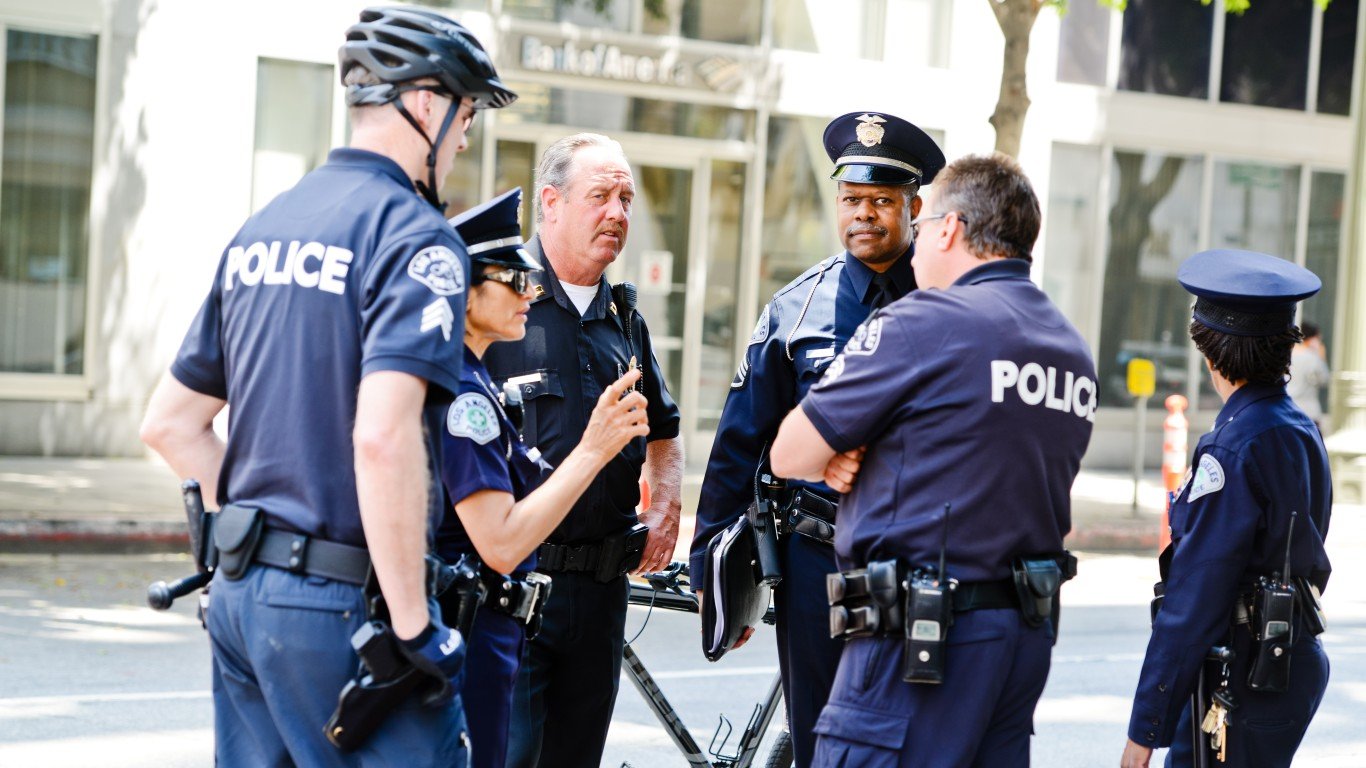
Source: anouchka / iStock Unreleased via Getty Images
California: Los Angeles Police Department
> Documented police killings (2013-2022): 167 — #1 most (10.1% of state killings)
> Police killings in 2022: 15
> % of those killed who were Black: 19.5% (total: 31)
> % of those killed who did not have a gun: 54.4% (total: 87)
> % of those killed who were fleeing: 35.2% (total: 37)
> % of cases officer was disciplined or charged with a crime: 2.1% (total: 2)
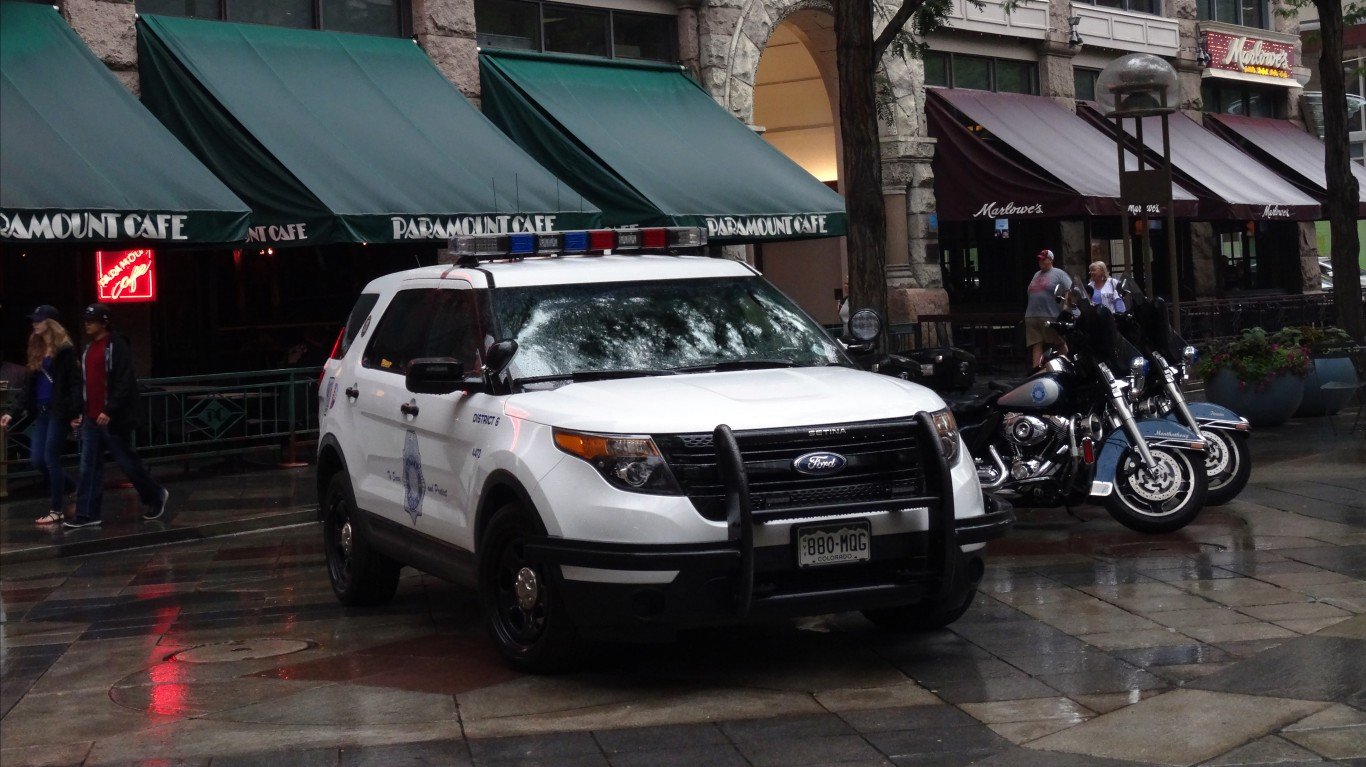
Source: Ericbvd / iStock Editorial via Getty Images
Colorado: Denver Police Department
> Documented police killings (2013-2022): 45 — #22 most (12.8% of state killings)
> Police killings in 2022: 3
> % of those killed who were Black: 17.5% (total: 7)
> % of those killed who did not have a gun: 32.6% (total: 14)
> % of those killed who were fleeing: 48.6% (total: 17)
> % of cases officer was disciplined or charged with a crime: 0.0% (total: 0)
[in-text-ad]

Connecticut: Connecticut State Police
> Documented police killings (2013-2022): 9 — #214 most (19.6% of state killings)
> Police killings in 2022: 1
> % of those killed who were Black: 25.0% (total: 2)
> % of those killed who did not have a gun: 77.8% (total: 7)
> % of those killed who were fleeing: 50.0% (total: 3)
> % of cases officer was disciplined or charged with a crime: 16.7% (total: 1)

Delaware: Delaware State Police
> Documented police killings (2013-2022): 11 — #167 most (42.3% of state killings)
> Police killings in 2022: 0
> % of those killed who were Black: 40.0% (total: 4)
> % of those killed who did not have a gun: 45.5% (total: 5)
> % of those killed who were fleeing: 33.3% (total: 3)
> % of cases officer was disciplined or charged with a crime: 0.0% (total: 0)

Source: robyvannucci / iStock Unreleased via Getty Images
Florida: Miami-Dade Police Department
> Documented police killings (2013-2022): 60 — #11 most (7.8% of state killings)
> Police killings in 2022: 7
> % of those killed who were Black: 38.5% (total: 20)
> % of those killed who did not have a gun: 51.9% (total: 28)
> % of those killed who were fleeing: 38.2% (total: 13)
> % of cases officer was disciplined or charged with a crime: 0.0% (total: 0)
[in-text-ad-2]
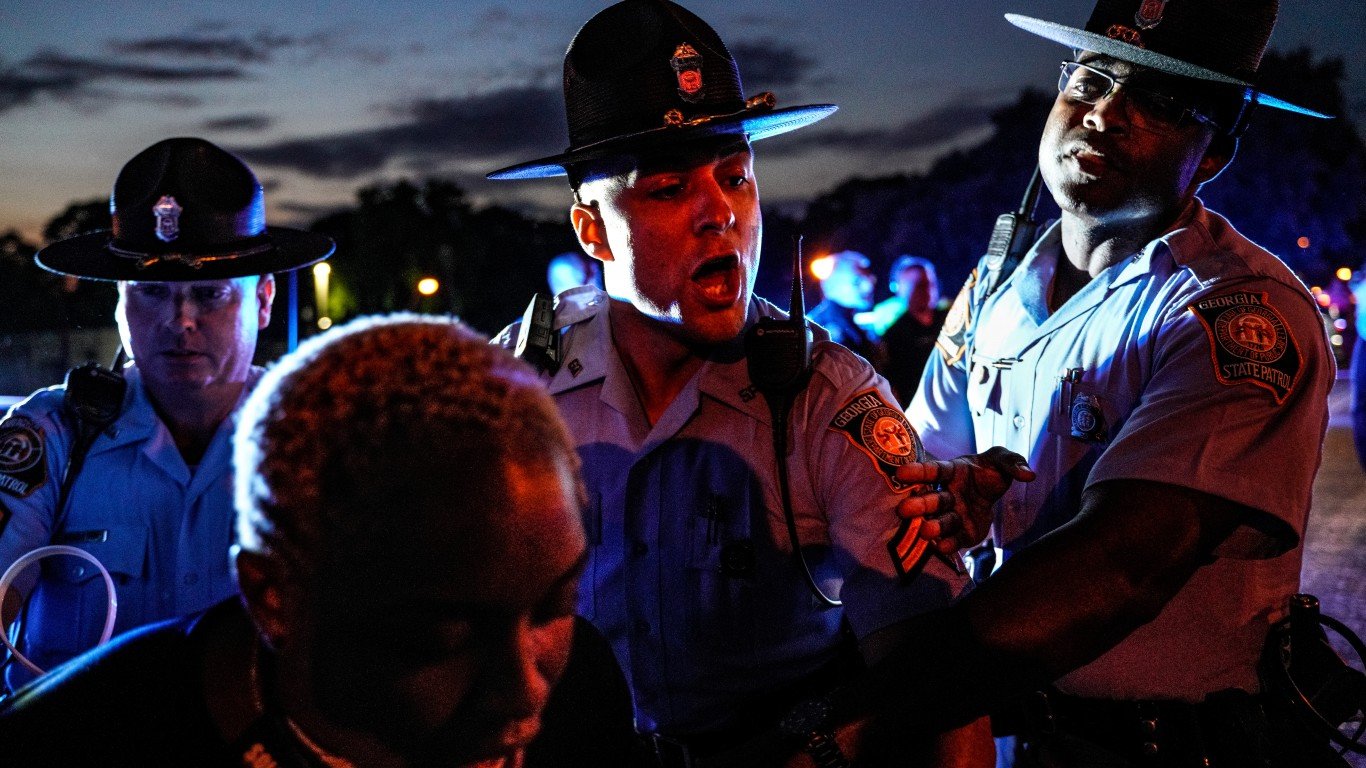
Source: Anadolu Agency / Anadolu Agency via Getty Images
Georgia: Atlanta Police Department
> Documented police killings (2013-2022): 28 — #48 most (6.5% of state killings)
> Police killings in 2022: 6
> % of those killed who were Black: 96.2% (total: 25)
> % of those killed who did not have a gun: 54.2% (total: 13)
> % of those killed who were fleeing: 44.4% (total: 8)
> % of cases officer was disciplined or charged with a crime: 21.4% (total: 3)

Hawaii: Honolulu Police Department
> Documented police killings (2013-2022): 28 — #48 most (58.3% of state killings)
> Police killings in 2022: 1
> % of those killed who were Black: 3.8% (total: 1)
> % of those killed who did not have a gun: 82.1% (total: 23)
> % of those killed who were fleeing: 27.8% (total: 5)
> % of cases officer was disciplined or charged with a crime: 4.5% (total: 1)
[in-text-ad]
Source: Courtesy of Boise Police Department via Facebook
Idaho: Boise Police Department
> Documented police killings (2013-2022): 10 — #186 most (12.7% of state killings)
> Police killings in 2022: 0
> % of those killed who were Black: 0.0% (total: 0)
> % of those killed who did not have a gun: 33.3% (total: 3)
> % of those killed who were fleeing: 14.3% (total: 1)
> % of cases officer was disciplined or charged with a crime: 0.0% (total: 0)
 24/7 Wall St.
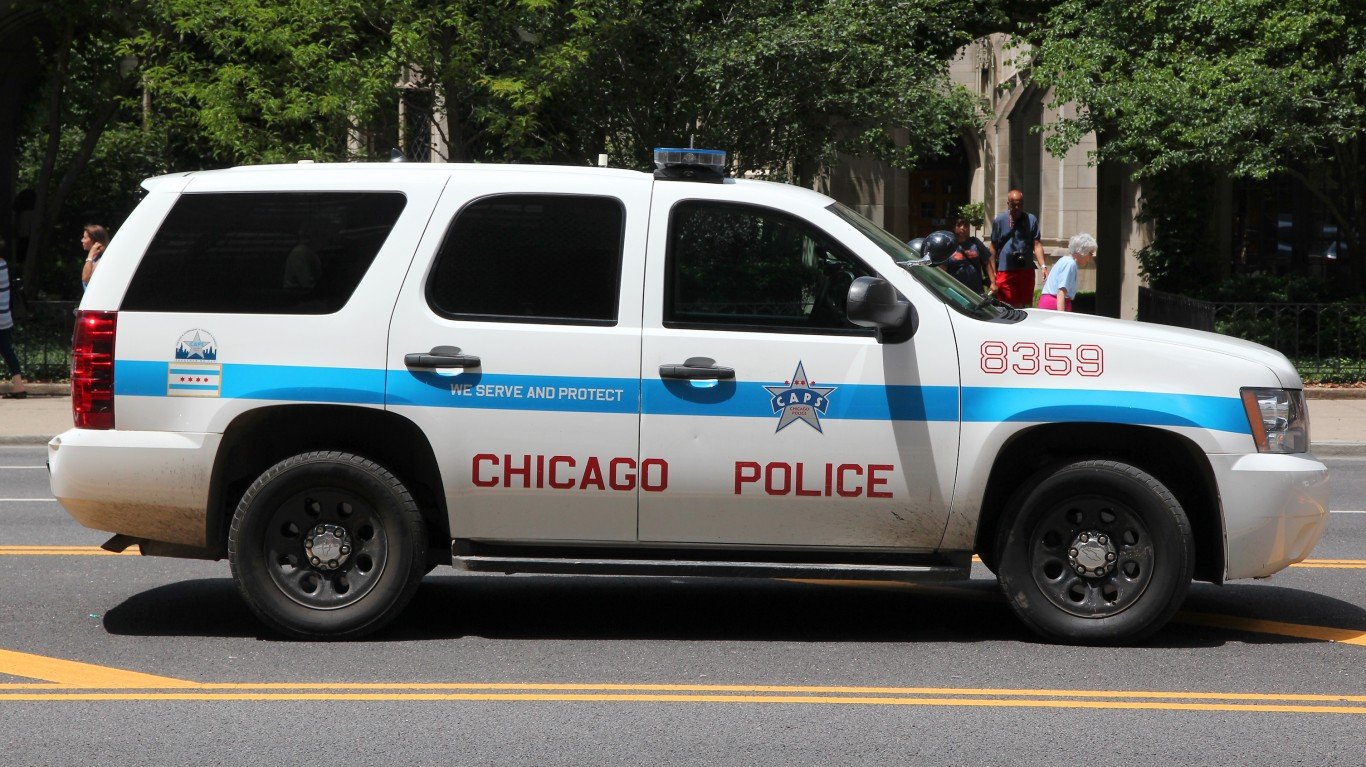
Source: tupungato / iStock Editorial via Getty Images
Illinois: Chicago Police Department
> Documented police killings (2013-2022): 92 — #6 most (35.8% of state killings)
> Police killings in 2022: 2
> % of those killed who were Black: 74.2% (total: 66)
> % of those killed who did not have a gun: 44.7% (total: 38)
> % of those killed who were fleeing: 49.0% (total: 25)
> % of cases officer was disciplined or charged with a crime: 13.0% (total: 7)

Indiana: Indianapolis Metropolitan Police Department
> Documented police killings (2013-2022): 34 — #34 most (17.9% of state killings)
> Police killings in 2022: 2
> % of those killed who were Black: 65.6% (total: 21)
> % of those killed who did not have a gun: 26.5% (total: 9)
> % of those killed who were fleeing: 35.0% (total: 7)
> % of cases officer was disciplined or charged with a crime: 0.0% (total: 0)
[in-text-ad-2]

Iowa: Des Moines Police Department
> Documented police killings (2013-2022): 8 — #242 most (12.1% of state killings)
> Police killings in 2022: 1
> % of those killed who were Black: 28.6% (total: 2)
> % of those killed who did not have a gun: 37.5% (total: 3)
> % of those killed who were fleeing: 80.0% (total: 4)
> % of cases officer was disciplined or charged with a crime: 0.0% (total: 0)

Kansas: Wichita Police Department
> Documented police killings (2013-2022): 16 — #100 most (15.0% of state killings)
> Police killings in 2022: 0
> % of those killed who were Black: 6.3% (total: 1)
> % of those killed who did not have a gun: 43.8% (total: 7)
> % of those killed who were fleeing: 40.0% (total: 4)
> % of cases officer was disciplined or charged with a crime: 0.0% (total: 0)
[in-text-ad]
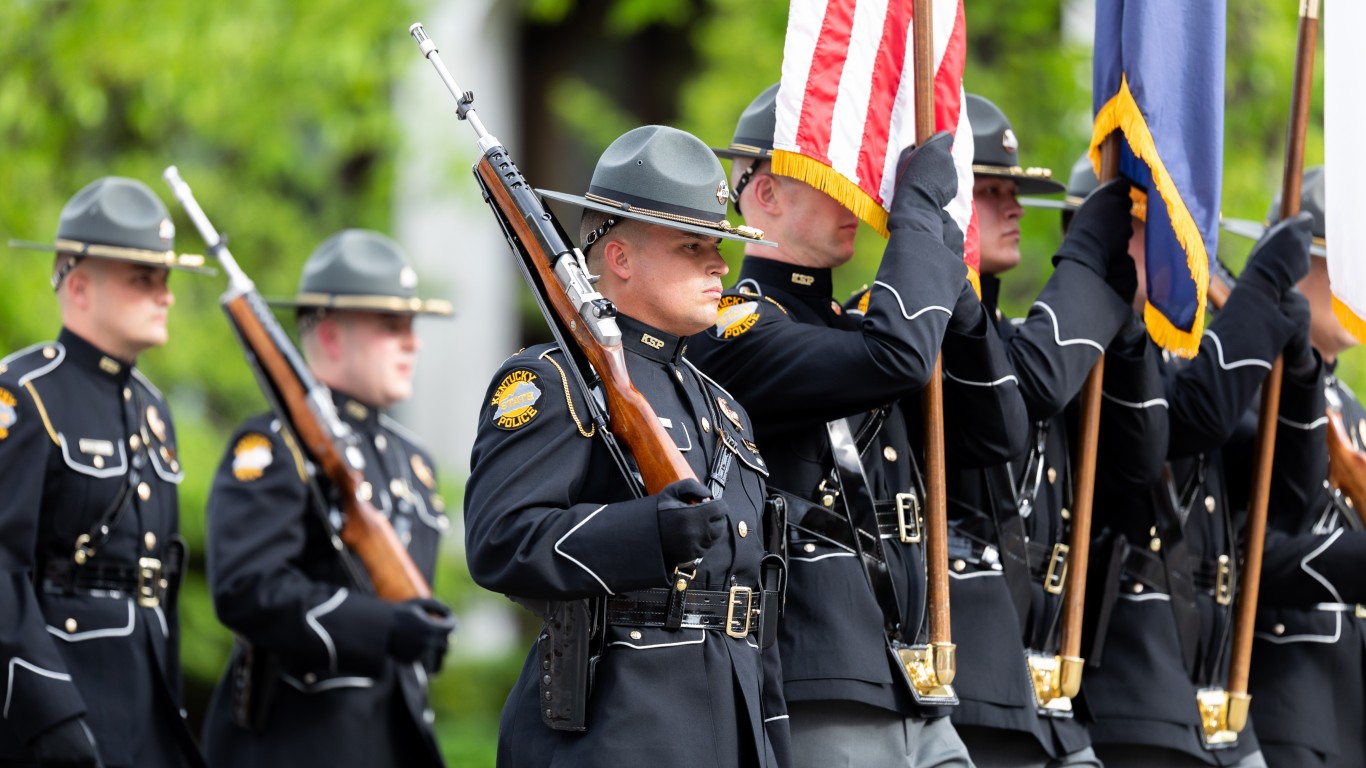
Source: Roberto Galan / iStock Editorial via Getty Images
Kentucky: Kentucky State Police
> Documented police killings (2013-2022): 55 — #14 most (30.1% of state killings)
> Police killings in 2022: 6
> % of those killed who were Black: 4.5% (total: 2)
> % of those killed who did not have a gun: 34.0% (total: 17)
> % of those killed who were fleeing: 38.2% (total: 13)
> % of cases officer was disciplined or charged with a crime: 0.0% (total: 0)
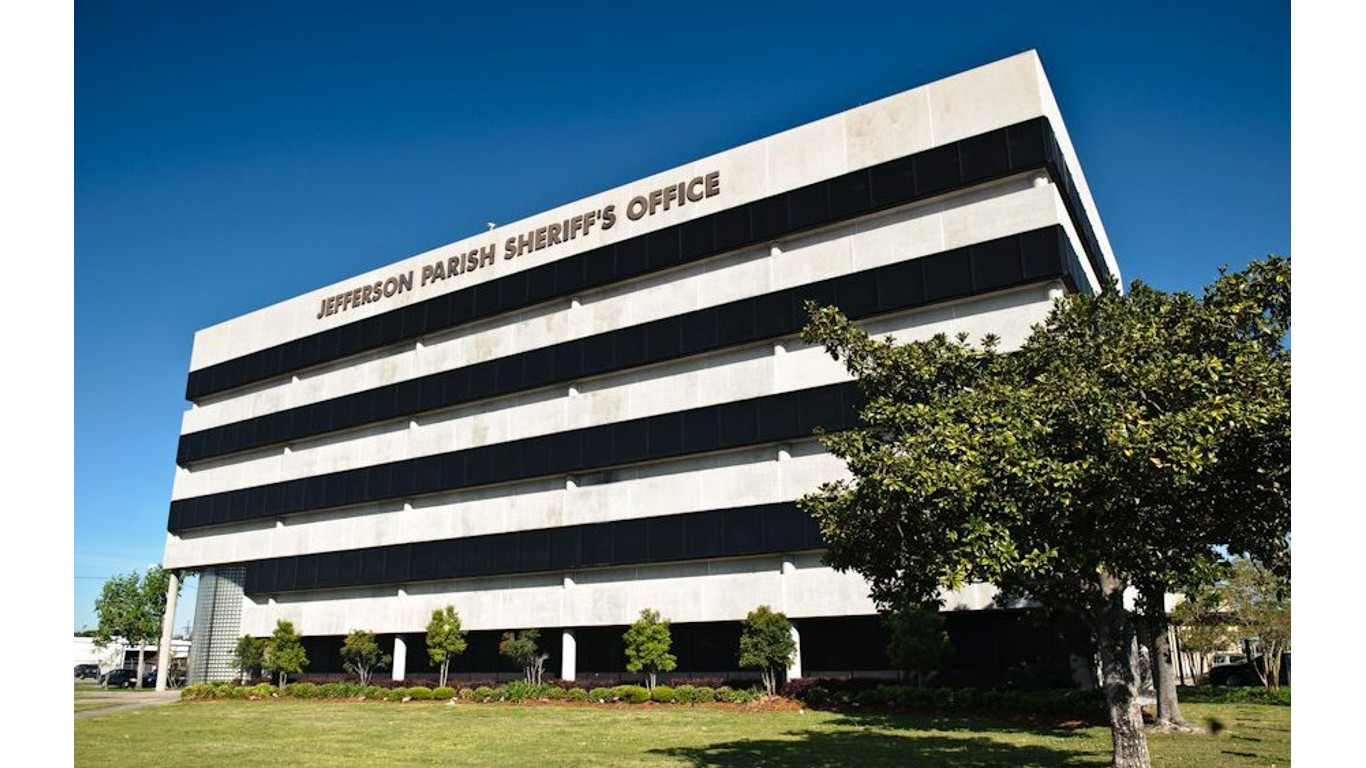
Source: Courtesy of Jefferson Parish Sheriff's Office via Facebook
Louisiana: Jefferson Parish Sheriff’s Office
> Documented police killings (2013-2022): 18 — #85 most (8.2% of state killings)
> Police killings in 2022: 2
> % of those killed who were Black: 62.5% (total: 10)
> % of those killed who did not have a gun: 50.0% (total: 9)
> % of those killed who were fleeing: 53.8% (total: 7)
> % of cases officer was disciplined or charged with a crime: 7.7% (total: 1)
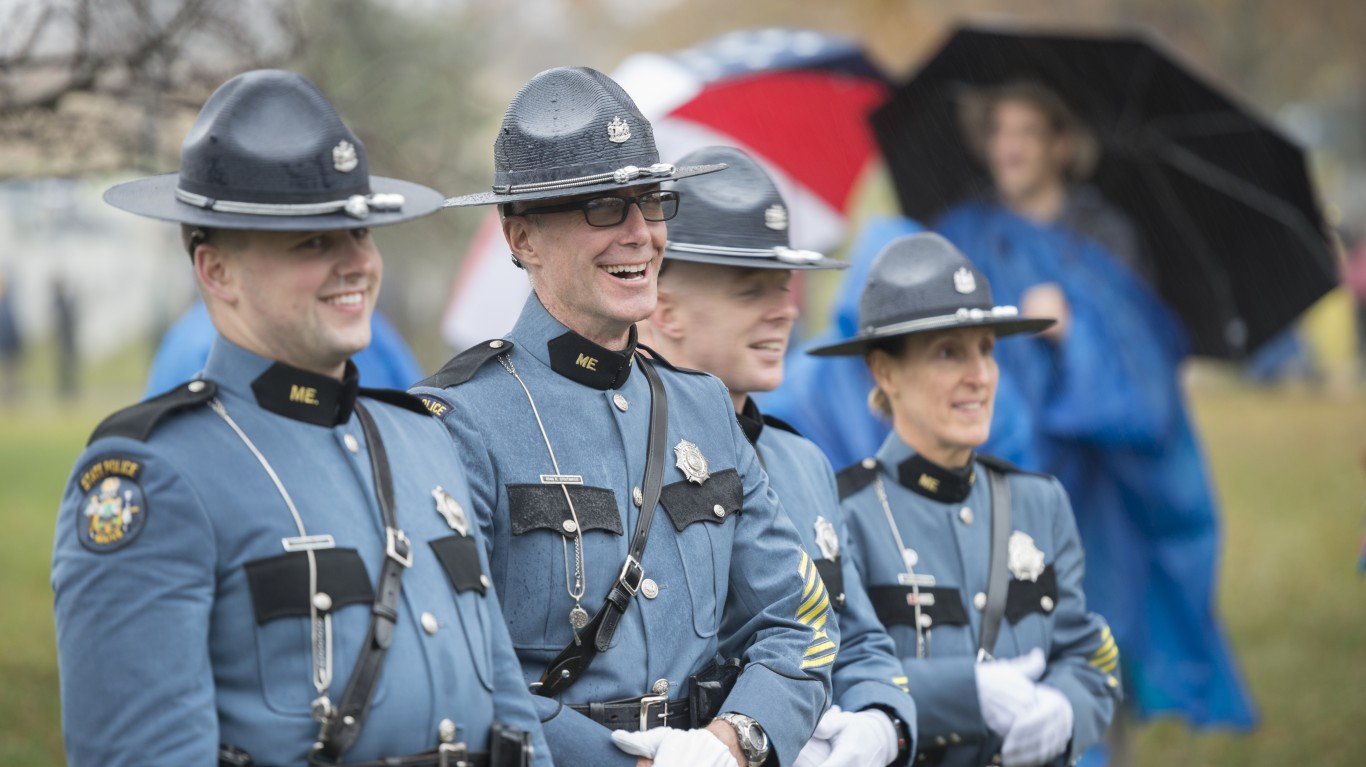
Source: arlingtonnatl / Flickr
Maine: Maine State Police
> Documented police killings (2013-2022): 7 — #271 most (14.9% of state killings)
> Police killings in 2022: 1
> % of those killed who were Black: 0.0% (total: 0)
> % of those killed who did not have a gun: 16.7% (total: 1)
> % of those killed who were fleeing: 0.0% (total: 0)
> % of cases officer was disciplined or charged with a crime: 0.0% (total: 0)
[in-text-ad-2]

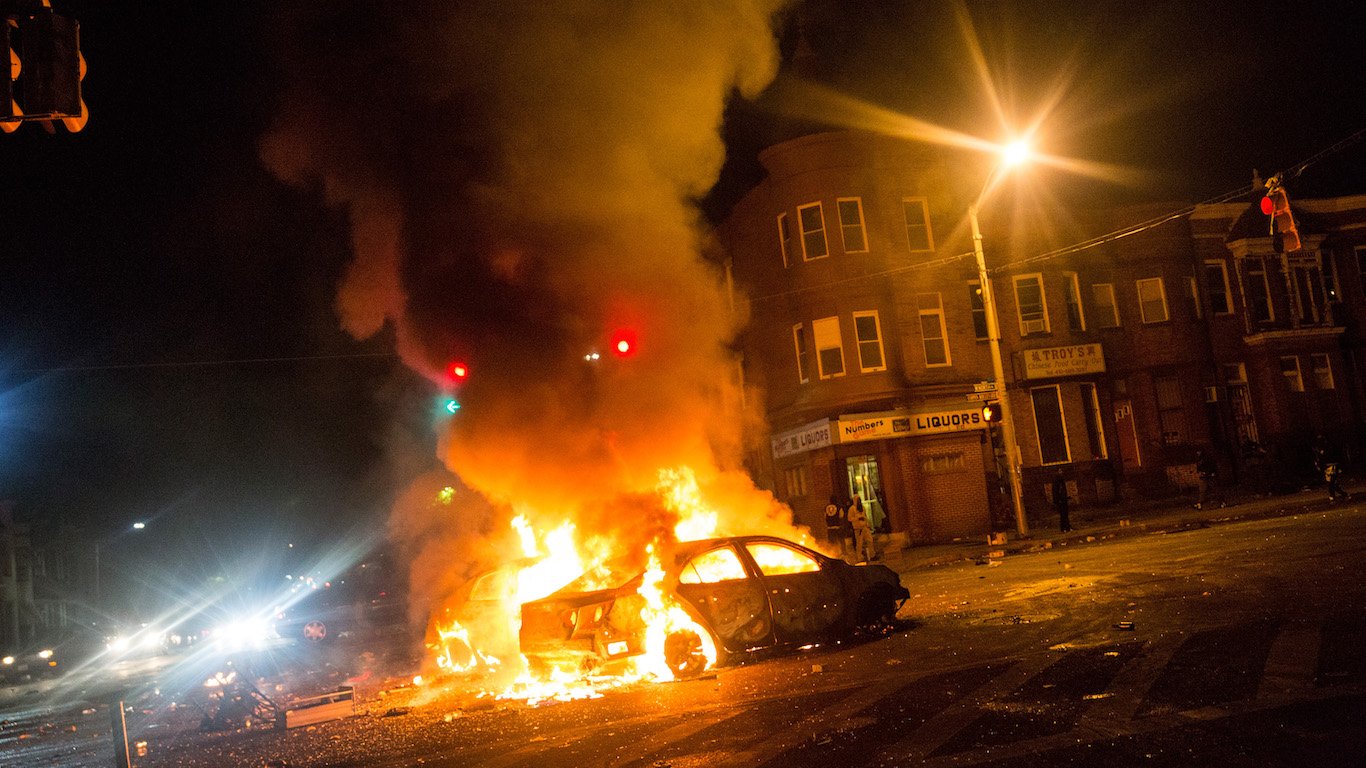
Maryland: Baltimore Police Department
> Documented police killings (2013-2022): 40 — #29 most (22.5% of state killings)
> Police killings in 2022: 3
> % of those killed who were Black: 89.7% (total: 35)
> % of those killed who did not have a gun: 40.0% (total: 16)
> % of those killed who were fleeing: 21.7% (total: 5)
> % of cases officer was disciplined or charged with a crime: 3.7% (total: 1)
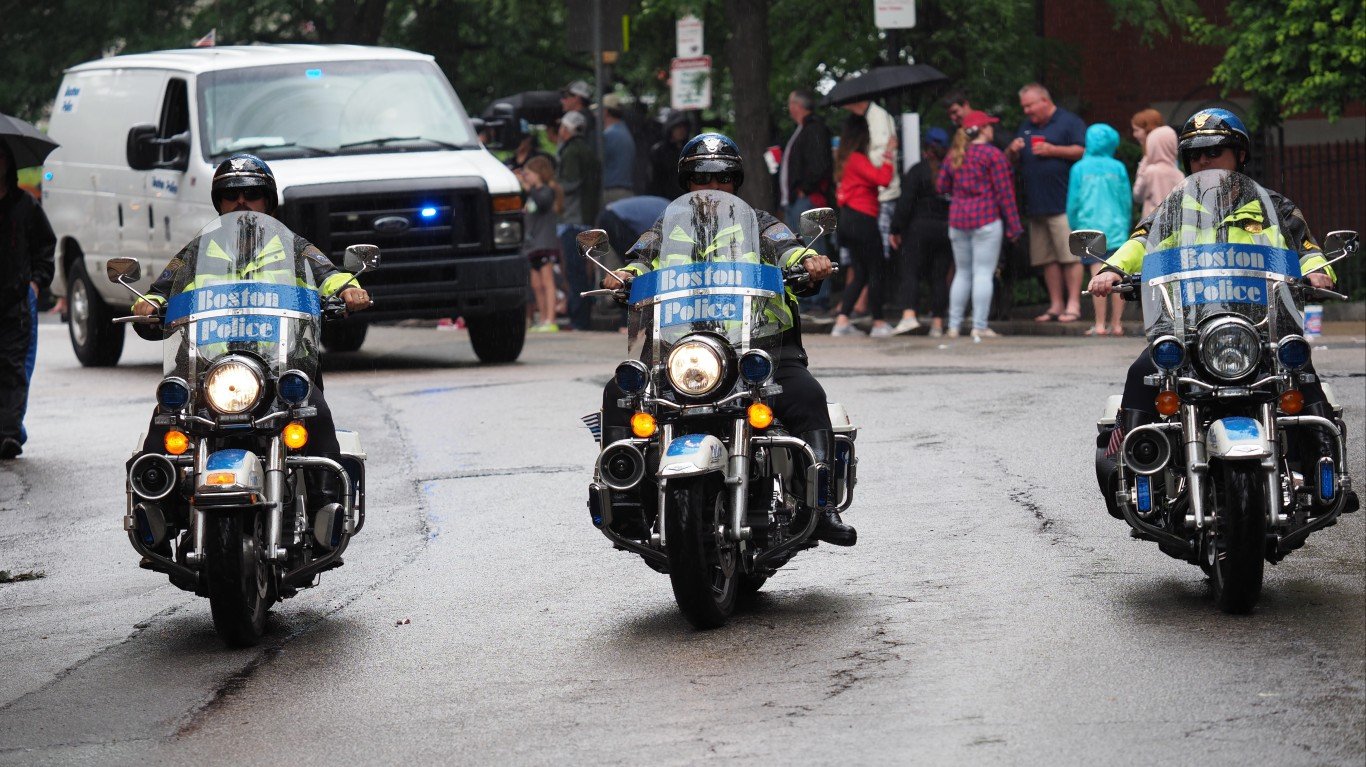
Source: Alexandre Tziripouloff / iStock Editorial via Getty Images
Massachusetts: Boston Police Department
> Documented police killings (2013-2022): 16 — #100 most (20.5% of state killings)
> Police killings in 2022: 1
> % of those killed who were Black: 75.0% (total: 12)
> % of those killed who did not have a gun: 37.5% (total: 6)
> % of those killed who were fleeing: 31.3% (total: 5)
> % of cases officer was disciplined or charged with a crime: 0.0% (total: 0)
[in-text-ad]
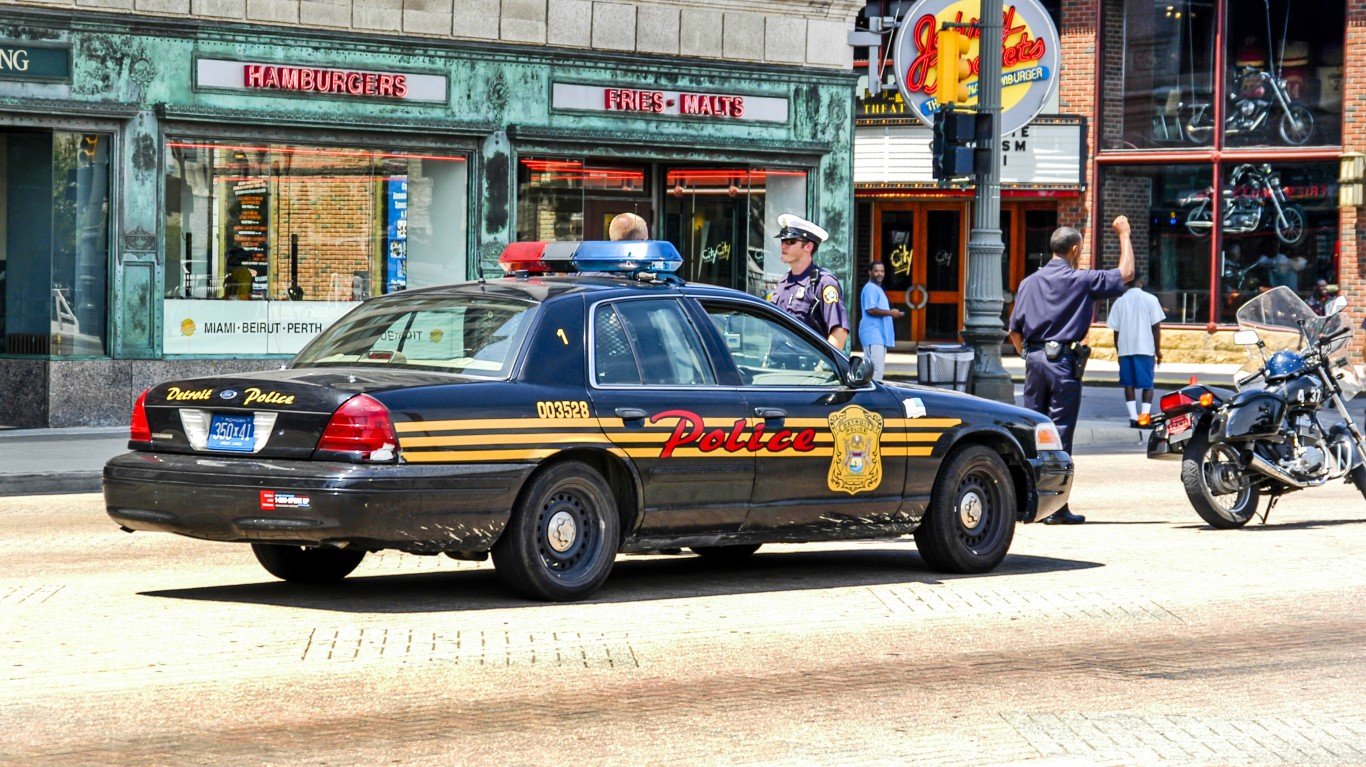
Source: csfotoimages / iStock Editorial via Getty Images
Michigan: Detroit Police Department
> Documented police killings (2013-2022): 30 — #41 most (15.9% of state killings)
> Police killings in 2022: 5
> % of those killed who were Black: 90.5% (total: 19)
> % of those killed who did not have a gun: 34.5% (total: 10)
> % of those killed who were fleeing: 18.8% (total: 3)
> % of cases officer was disciplined or charged with a crime: 10.0% (total: 1)

Minnesota: Minneapolis Police Department
> Documented police killings (2013-2022): 13 — #139 most (11.1% of state killings)
> Police killings in 2022: 2
> % of those killed who were Black: 76.9% (total: 10)
> % of those killed who did not have a gun: 50.0% (total: 6)
> % of those killed who were fleeing: 8.3% (total: 1)
> % of cases officer was disciplined or charged with a crime: 25.0% (total: 3)
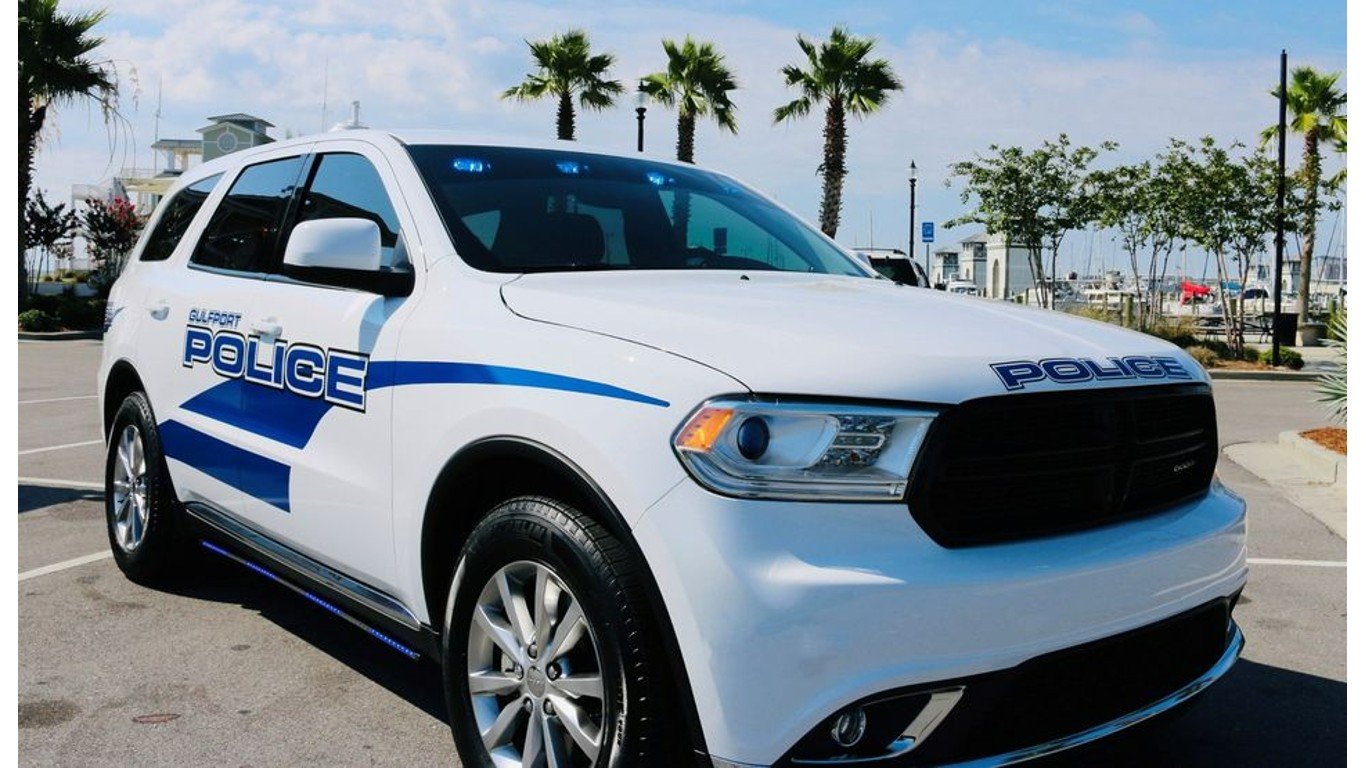
Source: Courtesy of Gulfport Police Department via Facebook
Mississippi: Gulfport Police Department
> Documented police killings (2013-2022): 9 — #214 most (5.7% of state killings)
> Police killings in 2022: 1
> % of those killed who were Black: 71.4% (total: 5)
> % of those killed who did not have a gun: 37.5% (total: 3)
> % of those killed who were fleeing: 0.0% (total: 0)
> % of cases officer was disciplined or charged with a crime: 0.0% (total: 0)
[in-text-ad-2]

Missouri: St. Louis Metropolitan Police Department
> Documented police killings (2013-2022): 46 — #19 most (15.6% of state killings)
> Police killings in 2022: 4
> % of those killed who were Black: 90.5% (total: 38)
> % of those killed who did not have a gun: 25.0% (total: 11)
> % of those killed who were fleeing: 43.3% (total: 13)
> % of cases officer was disciplined or charged with a crime: 3.3% (total: 1)
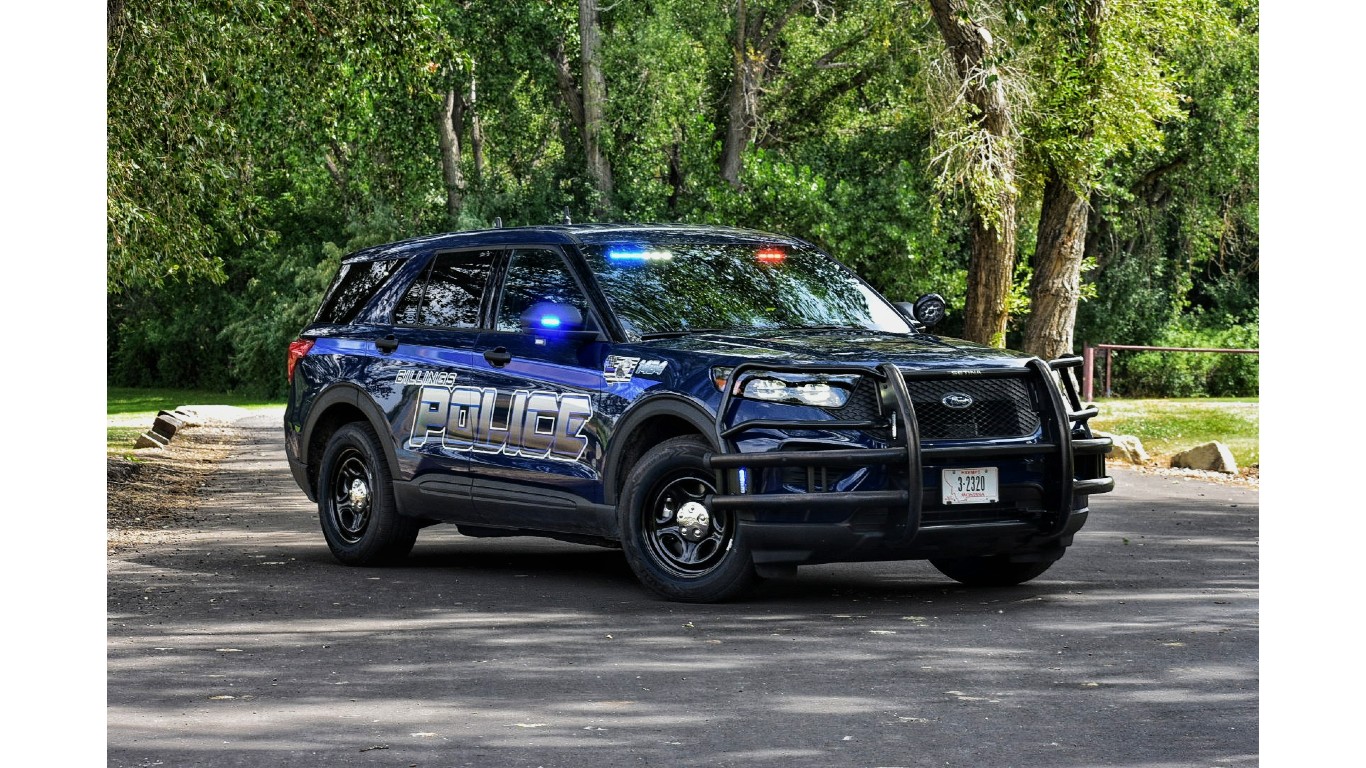
Source: Courtesy of Billings Police Department via Facebook
Montana: Billings Police Department
> Documented police killings (2013-2022): 14 — #127 most (21.5% of state killings)
> Police killings in 2022: 2
> % of those killed who were Black: 0.0% (total: 0)
> % of those killed who did not have a gun: 50.0% (total: 7)
> % of those killed who were fleeing: 36.4% (total: 4)
> % of cases officer was disciplined or charged with a crime: 0.0% (total: 0)
[in-text-ad]

Nebraska: Omaha Police Department
> Documented police killings (2013-2022): 20 — #75 most (35.7% of state killings)
> Police killings in 2022: 2
> % of those killed who were Black: 36.8% (total: 7)
> % of those killed who did not have a gun: 57.9% (total: 11)
> % of those killed who were fleeing: 14.3% (total: 2)
> % of cases officer was disciplined or charged with a crime: 8.3% (total: 1)
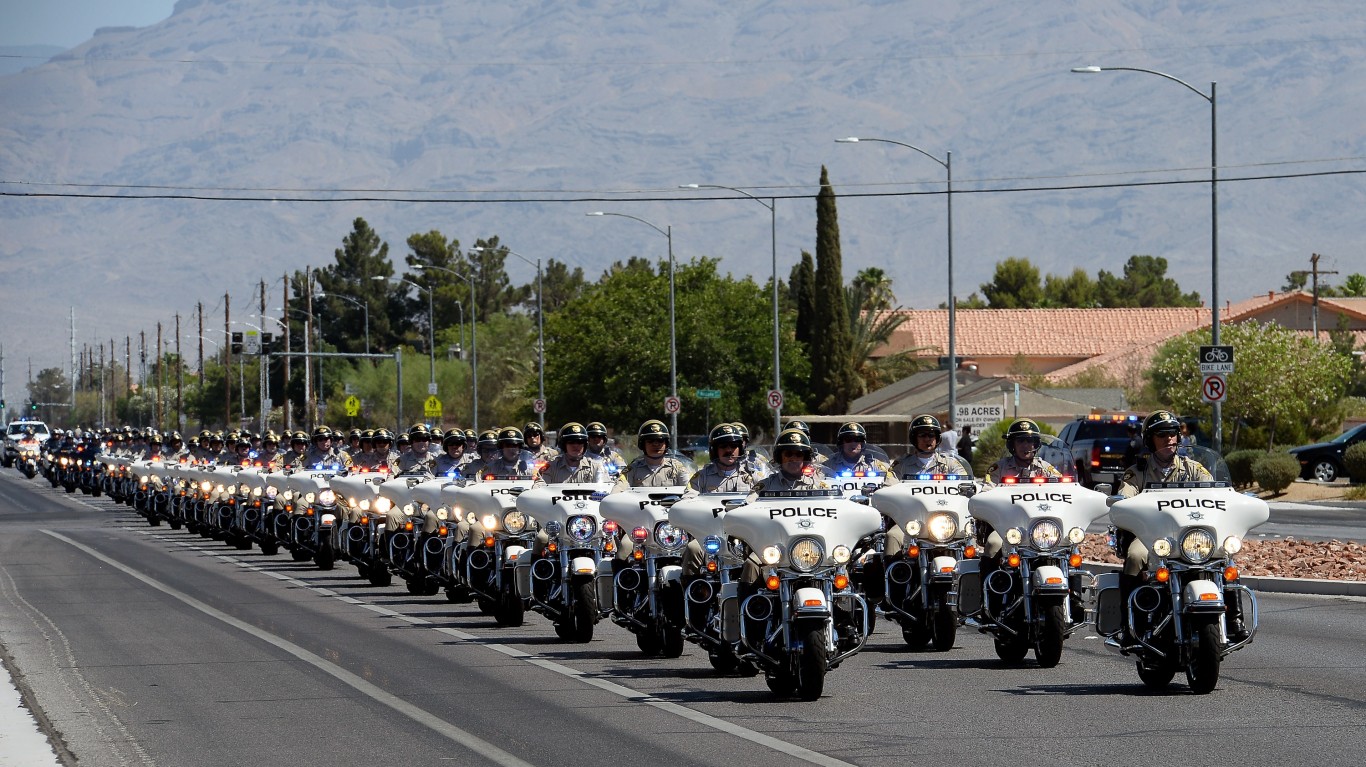
Source: Ethan Miller / Getty Images News via Getty Images
Nevada: Las Vegas Metropolitan Police Department
> Documented police killings (2013-2022): 87 — #8 most (48.6% of state killings)
> Police killings in 2022: 8
> % of those killed who were Black: 22.1% (total: 17)
> % of those killed who did not have a gun: 38.8% (total: 33)
> % of those killed who were fleeing: 27.4% (total: 17)
> % of cases officer was disciplined or charged with a crime: 4.3% (total: 2)

New Hampshire: New Hampshire State Police
> Documented police killings (2013-2022): 6 — #316 most (22.2% of state killings)
> Police killings in 2022: 1
> % of those killed who were Black: 0.0% (total: 0)
> % of those killed who did not have a gun: 50.0% (total: 2)
> % of those killed who were fleeing: 0.0% (total: 0)
> % of cases officer was disciplined or charged with a crime: 0.0% (total: 0)
[in-text-ad-2]

New Jersey: Newark Police Department
> Documented police killings (2013-2022): 12 — #152 most (8.6% of state killings)
> Police killings in 2022: 0
> % of those killed who were Black: 63.6% (total: 7)
> % of those killed who did not have a gun: 50.0% (total: 6)
> % of those killed who were fleeing: 25.0% (total: 2)
> % of cases officer was disciplined or charged with a crime: 36.4% (total: 4)
Source: Courtesy of Albuquergue Police Department via Facebook
New Mexico: Albuquerque Police Department
> Documented police killings (2013-2022): 51 — #18 most (22.9% of state killings)
> Police killings in 2022: 11
> % of those killed who were Black: 13.3% (total: 6)
> % of those killed who did not have a gun: 32.7% (total: 16)
> % of those killed who were fleeing: 35.1% (total: 13)
> % of cases officer was disciplined or charged with a crime: 4.5% (total: 1)
[in-text-ad]

Source: tillsonburg / iStock Unreleased via Getty Images
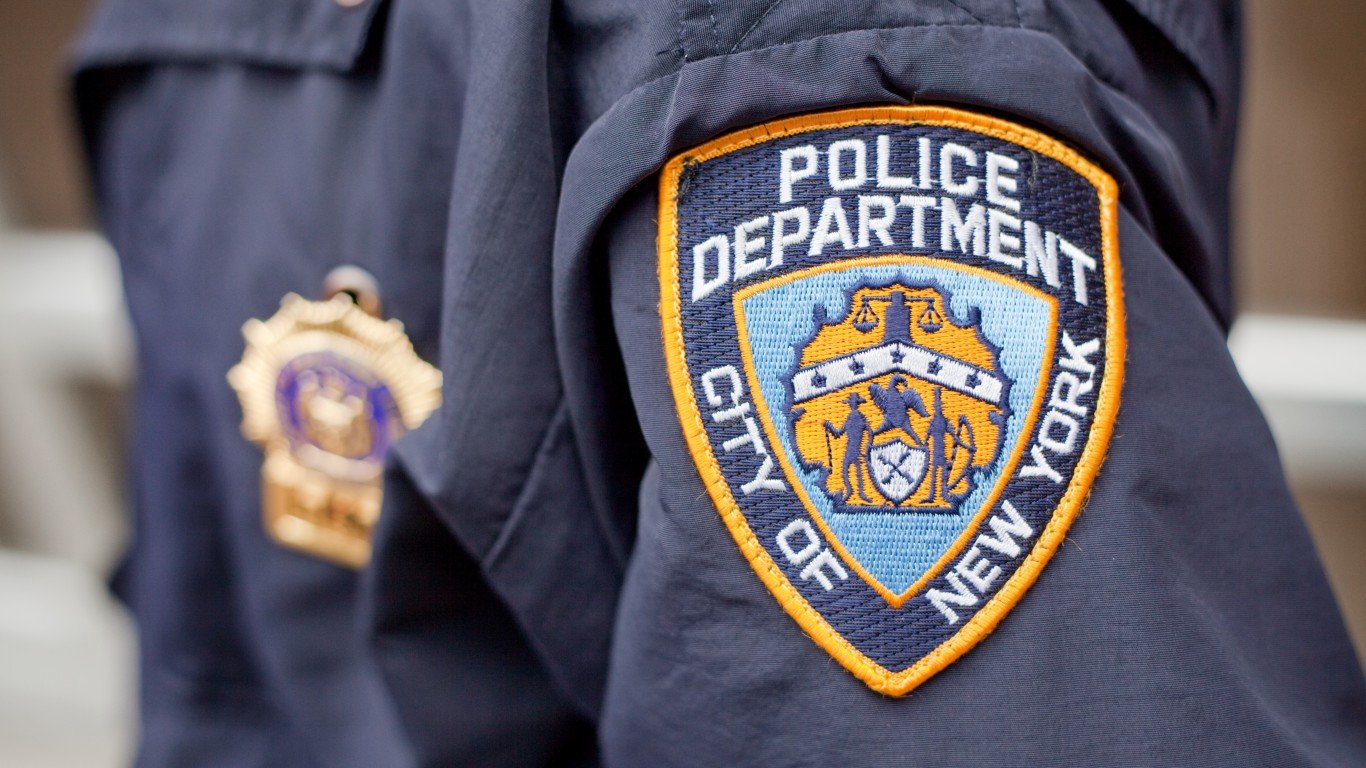
New York: New York Police Department
> Documented police killings (2013-2022): 102 — #4 most (43.4% of state killings)
> Police killings in 2022: 13
> % of those killed who were Black: 66.3% (total: 59)
> % of those killed who did not have a gun: 57.0% (total: 57)
> % of those killed who were fleeing: 34.9% (total: 22)
> % of cases officer was disciplined or charged with a crime: 8.1% (total: 5)

North Carolina: Charlotte-Mecklenburg Police Department
> Documented police killings (2013-2022): 28 — #48 most (9.0% of state killings)
> Police killings in 2022: 4
> % of those killed who were Black: 62.5% (total: 15)
> % of those killed who did not have a gun: 42.9% (total: 12)
> % of those killed who were fleeing: 13.6% (total: 3)
> % of cases officer was disciplined or charged with a crime: 9.5% (total: 2)
Source: Courtesy of Bismarck Police Department via Facebook
North Dakota: Bismarck Police Department
> Documented police killings (2013-2022): 4 — #467 most (19.0% of state killings)
> Police killings in 2022: 0
> % of those killed who were Black: 0.0% (total: 0)
> % of those killed who did not have a gun: 50.0% (total: 2)
> % of those killed who were fleeing: 33.3% (total: 1)
> % of cases officer was disciplined or charged with a crime: 0.0% (total: 0)
[in-text-ad-2]

Ohio: Columbus Division of Police
> Documented police killings (2013-2022): 46 — #19 most (14.8% of state killings)
> Police killings in 2022: 0
> % of those killed who were Black: 73.3% (total: 33)
> % of those killed who did not have a gun: 39.0% (total: 16)
> % of those killed who were fleeing: 24.1% (total: 7)
> % of cases officer was disciplined or charged with a crime: 11.4% (total: 4)

Source: Courtesy of Oklahoma City Police Department via Facebook
Oklahoma: Oklahoma City Police Department
> Documented police killings (2013-2022): 58 — #12 most (19.6% of state killings)
> Police killings in 2022: 2
> % of those killed who were Black: 50.0% (total: 29)
> % of those killed who did not have a gun: 44.4% (total: 24)
> % of those killed who were fleeing: 25.0% (total: 8)
> % of cases officer was disciplined or charged with a crime: 5.1% (total: 2)
[in-text-ad]
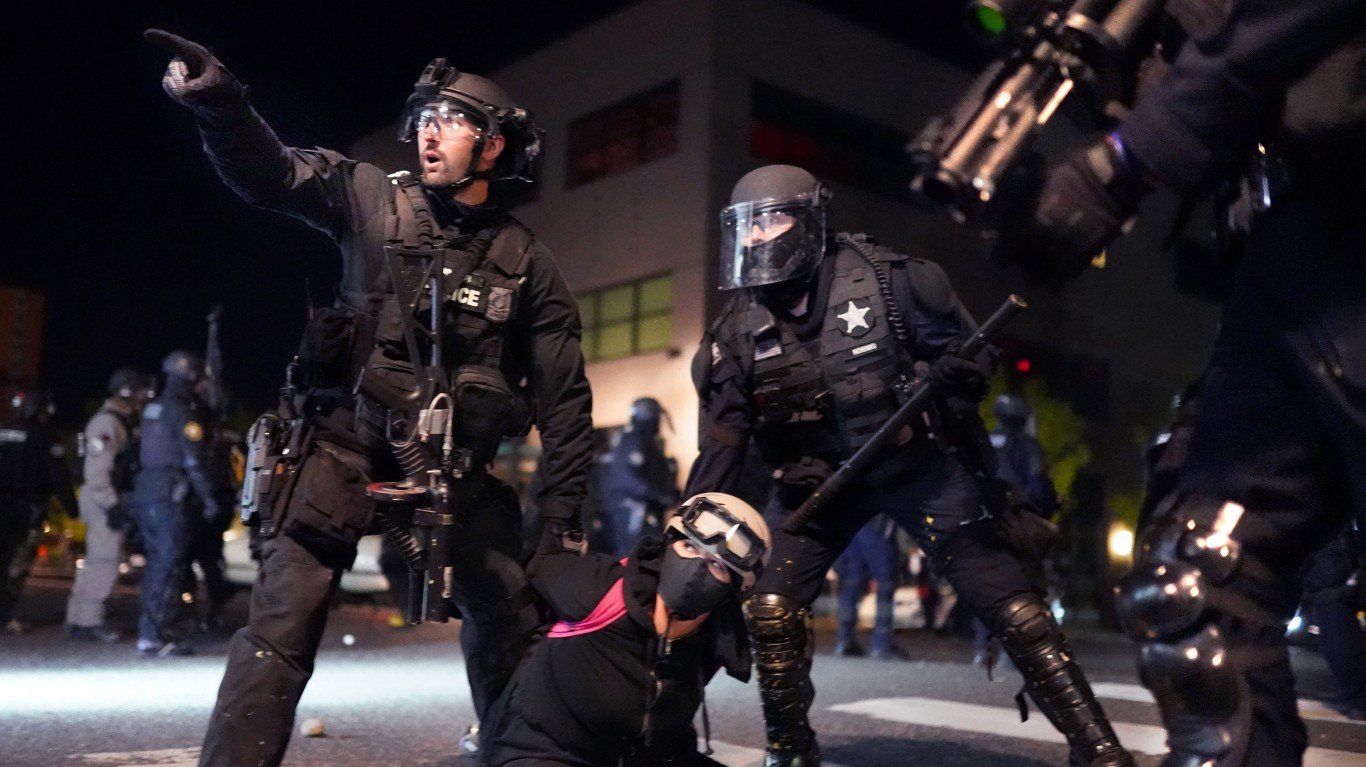
Source: Nathan Howard / Getty Images News via Getty Images
Oregon: Portland Police Bureau
> Documented police killings (2013-2022): 23 — #63 most (13.7% of state killings)
> Police killings in 2022: 2
> % of those killed who were Black: 18.2% (total: 4)
> % of those killed who did not have a gun: 69.6% (total: 16)
> % of those killed who were fleeing: 26.7% (total: 4)
> % of cases officer was disciplined or charged with a crime: 0.0% (total: 0)

Pennsylvania: Pennsylvania State Police
> Documented police killings (2013-2022): 52 — #17 most (21.2% of state killings)
> Police killings in 2022: 8
> % of those killed who were Black: 7.1% (total: 3)
> % of those killed who did not have a gun: 44.0% (total: 22)
> % of those killed who were fleeing: 36.4% (total: 12)
> % of cases officer was disciplined or charged with a crime: 0.0% (total: 0)

Rhode Island: Providence Police Department
> Documented police killings (2013-2022): 3 — #611 most (33.3% of state killings)
> Police killings in 2022: 0
> % of those killed who were Black: 33.3% (total: 1)
> % of those killed who did not have a gun: 66.7% (total: 2)
> % of those killed who were fleeing: 50.0% (total: 1)
> % of cases officer was disciplined or charged with a crime: 0.0% (total: 0)
[in-text-ad-2]
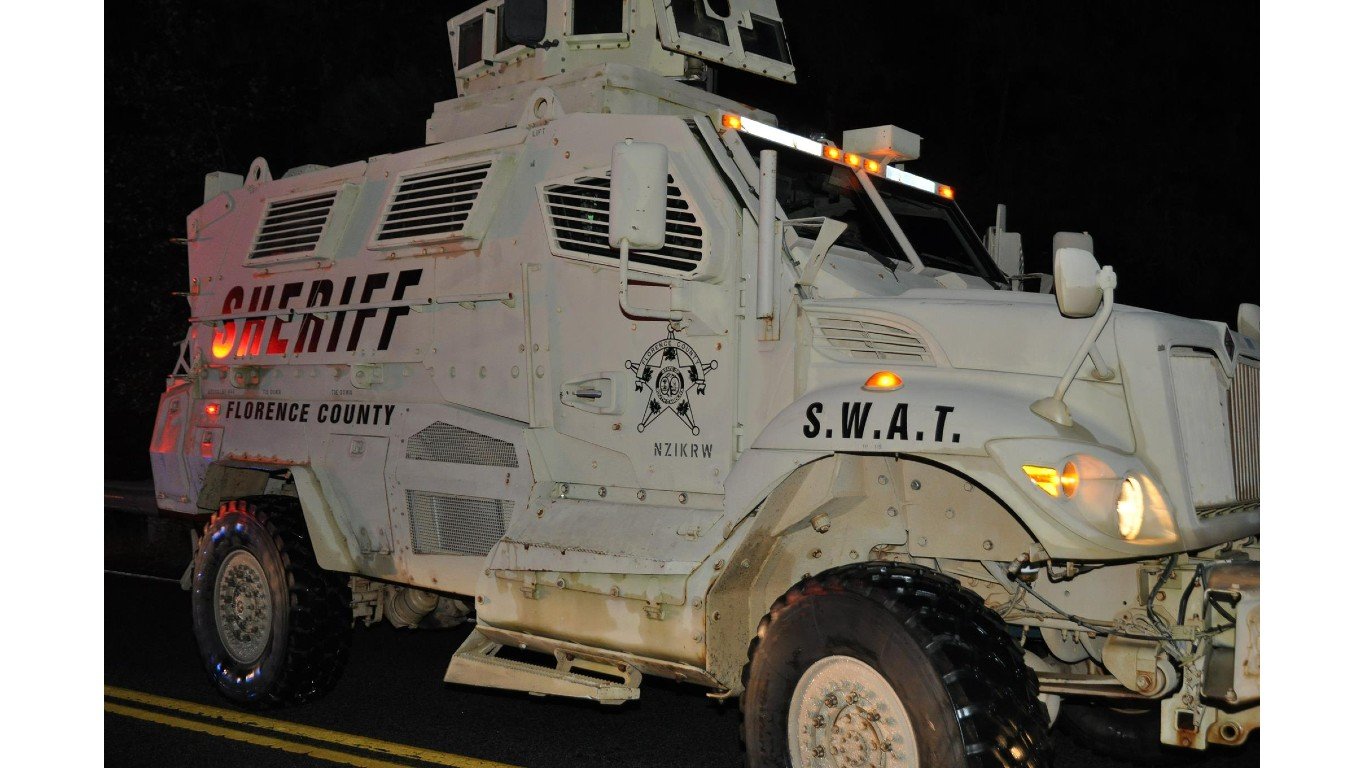
Source: Courtesy of Greenville County Sheriff's Office via Facebook
South Carolina: Greenville County Sheriff’s Office
> Documented police killings (2013-2022): 18 — #85 most (9.9% of state killings)
> Police killings in 2022: 1
> % of those killed who were Black: 53.3% (total: 8)
> % of those killed who did not have a gun: 16.7% (total: 3)
> % of those killed who were fleeing: 26.7% (total: 4)
> % of cases officer was disciplined or charged with a crime: 7.7% (total: 1)
Source: Courtesy of Rapid City Police Department via Facebook
South Dakota: Rapid City Police Department
> Documented police killings (2013-2022): 11 — #167 most (28.9% of state killings)
> Police killings in 2022: 3
> % of those killed who were Black: 0.0% (total: 0)
> % of those killed who did not have a gun: 36.4% (total: 4)
> % of those killed who were fleeing: 11.1% (total: 1)
> % of cases officer was disciplined or charged with a crime: 0.0% (total: 0)
[in-text-ad]

Tennessee: Memphis Police Department
> Documented police killings (2013-2022): 29 — #44 most (10.4% of state killings)
> Police killings in 2022: 5
> % of those killed who were Black: 75.0% (total: 18)
> % of those killed who did not have a gun: 57.7% (total: 15)
> % of those killed who were fleeing: 35.7% (total: 5)
> % of cases officer was disciplined or charged with a crime: 14.3% (total: 2)
 24/7 Wall St.
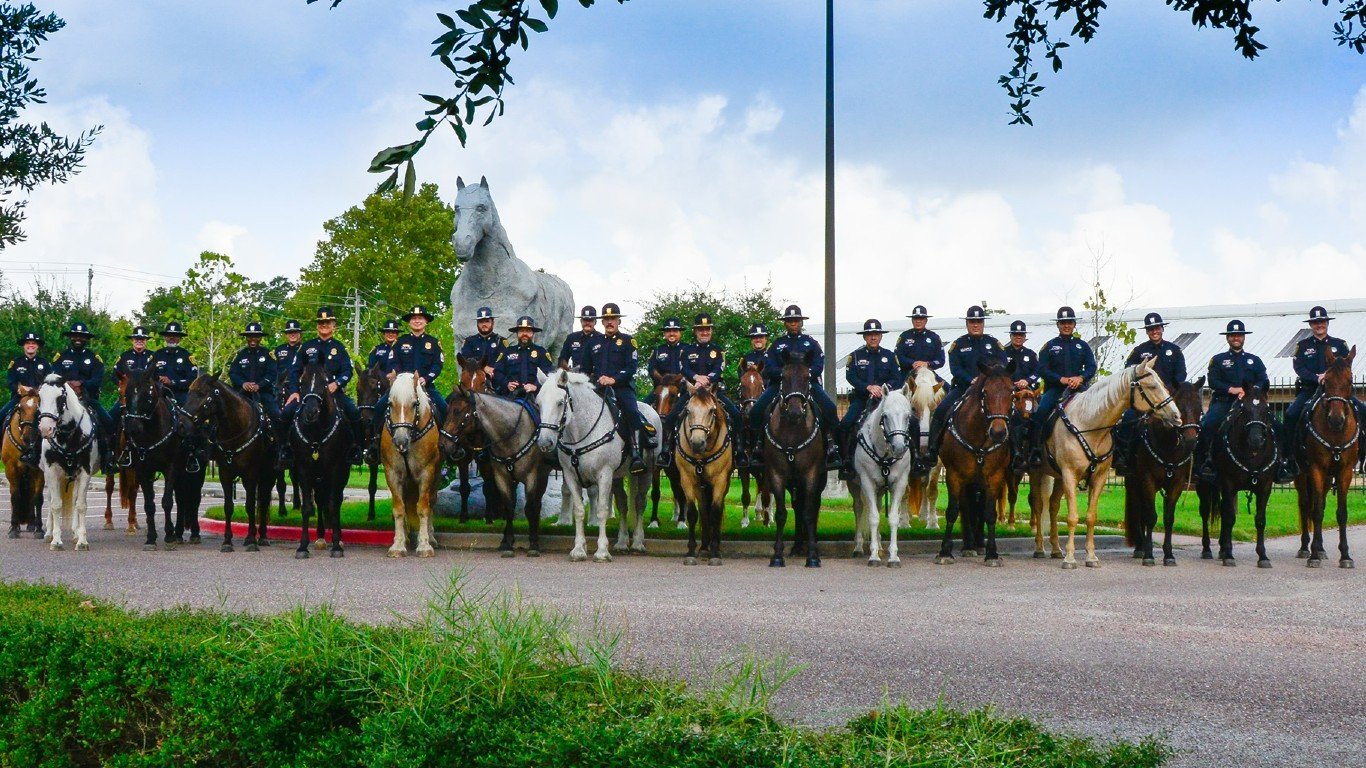
Source: Courtesy of Houston Police Department via Facebook
Texas: Houston Police Department
> Documented police killings (2013-2022): 97 — #5 most (9.3% of state killings)
> Police killings in 2022: 13
> % of those killed who were Black: 55.9% (total: 52)
> % of those killed who did not have a gun: 30.9% (total: 29)
> % of those killed who were fleeing: 32.3% (total: 20)
> % of cases officer was disciplined or charged with a crime: 3.6% (total: 2)
Source: Courtesy of Explore SLCPD via Facebook
Utah: Salt Lake City Police Department
> Documented police killings (2013-2022): 18 — #85 most (14.3% of state killings)
> Police killings in 2022: 3
> % of those killed who were Black: 16.7% (total: 3)
> % of those killed who did not have a gun: 66.7% (total: 12)
> % of those killed who were fleeing: 31.3% (total: 5)
> % of cases officer was disciplined or charged with a crime: 0.0% (total: 0)
[in-text-ad-2]

Vermont: Burlington Police Department
> Documented police killings (2013-2022): 8 — #242 most (47.1% of state killings)
> Police killings in 2022: 1
> % of those killed who were Black: 12.5% (total: 1)
> % of those killed who did not have a gun: 75.0% (total: 6)
> % of those killed who were fleeing: 33.3% (total: 2)
> % of cases officer was disciplined or charged with a crime: 0.0% (total: 0)
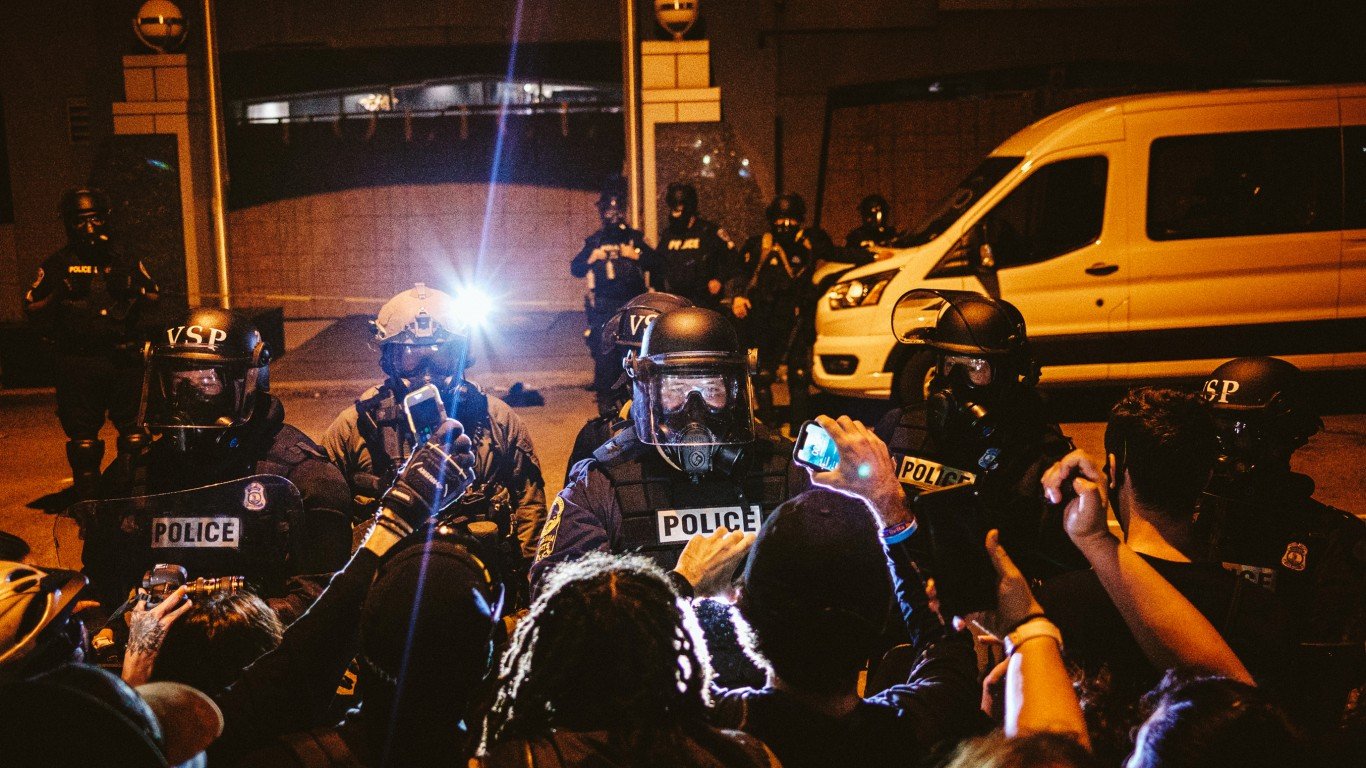
Source: Eze Amos / Getty Images News via Getty Images
Virginia: Virginia State Police
> Documented police killings (2013-2022): 15 — #111 most (7.9% of state killings)
> Police killings in 2022: 1
> % of those killed who were Black: 54.5% (total: 6)
> % of those killed who did not have a gun: 20.0% (total: 3)
> % of those killed who were fleeing: 37.5% (total: 3)
> % of cases officer was disciplined or charged with a crime: 0.0% (total: 0)
[in-text-ad]
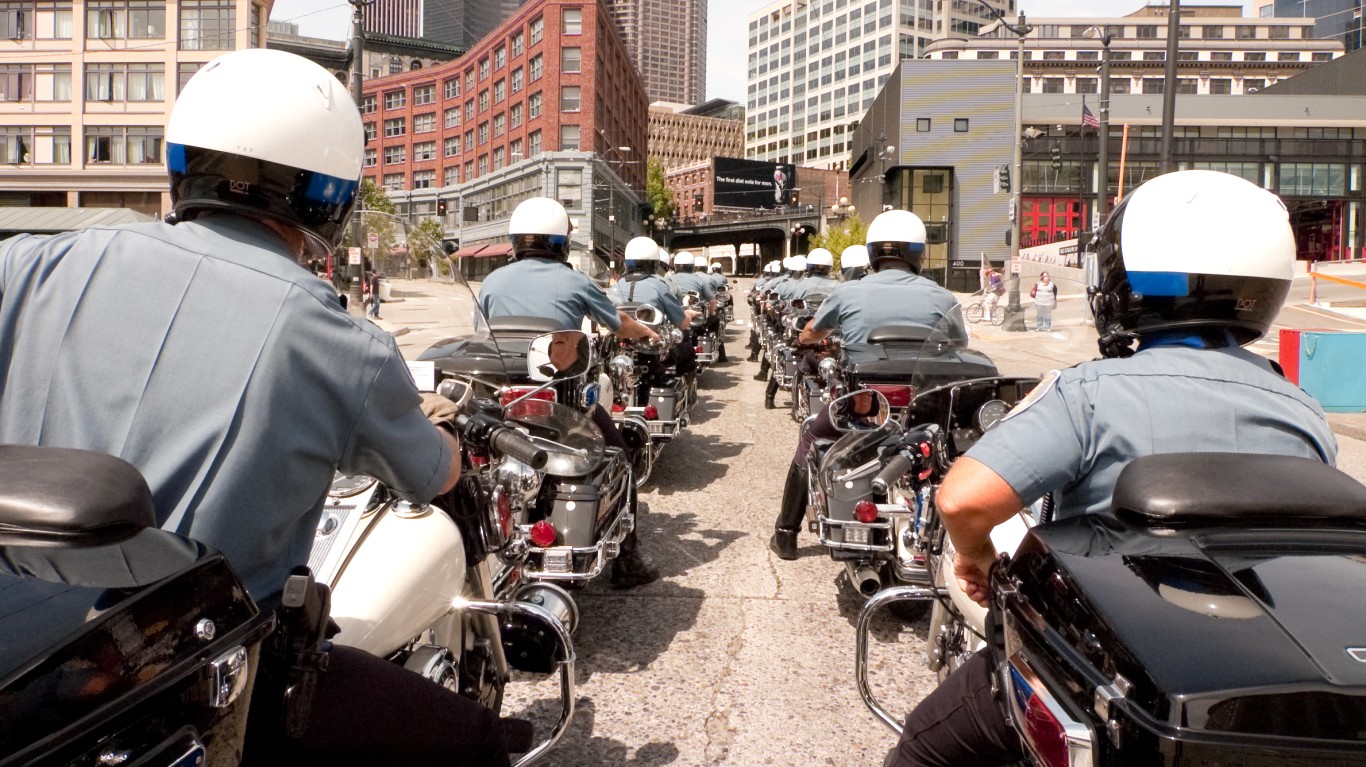
Source: 400tmax / iStock Unreleased via Getty Images
Washington: Seattle Police Department
> Documented police killings (2013-2022): 29 — #44 most (9.4% of state killings)
> Police killings in 2022: 1
> % of those killed who were Black: 26.9% (total: 7)
> % of those killed who did not have a gun: 50.0% (total: 14)
> % of those killed who were fleeing: 56.3% (total: 9)
> % of cases officer was disciplined or charged with a crime: 0.0% (total: 0)
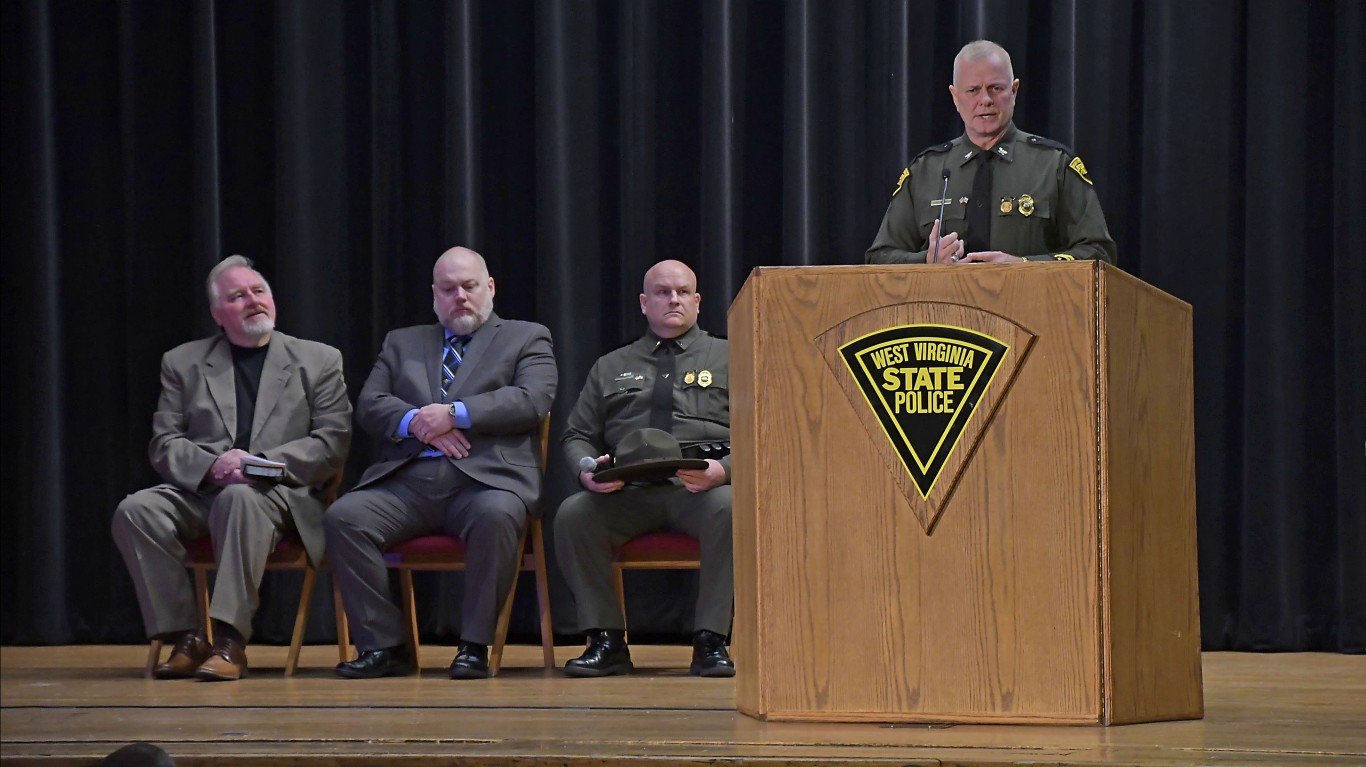
Source: govjustice / Flickr
West Virginia: West Virginia State Police
> Documented police killings (2013-2022): 17 — #93 most (17.3% of state killings)
> Police killings in 2022: 1
> % of those killed who were Black: 5.9% (total: 1)
> % of those killed who did not have a gun: 52.9% (total: 9)
> % of those killed who were fleeing: 43.8% (total: 7)
> % of cases officer was disciplined or charged with a crime: 0.0% (total: 0)
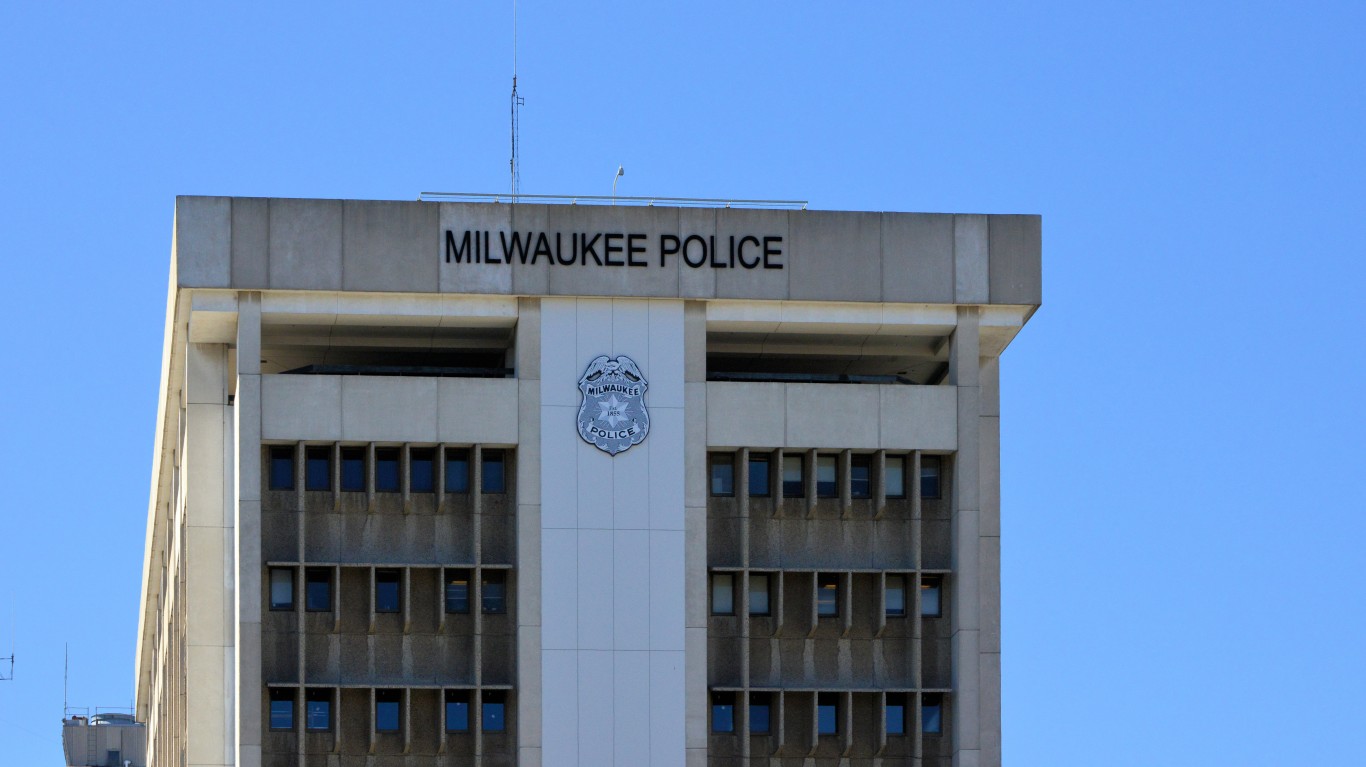
Source: mtcurado / iStock Unreleased via Getty Images
Wisconsin: Milwaukee Police Department
> Documented police killings (2013-2022): 26 — #58 most (16.7% of state killings)
> Police killings in 2022: 5
> % of those killed who were Black: 75.0% (total: 18)
> % of those killed who did not have a gun: 46.2% (total: 12)
> % of those killed who were fleeing: 38.9% (total: 7)
> % of cases officer was disciplined or charged with a crime: 18.2% (total: 2)
[in-text-ad-2]
Source: Courtesy of Casper Police Department via Facebook
Wyoming: Casper Police Department
> Documented police killings (2013-2022): 9 — #214 most (25.0% of state killings)
> Police killings in 2022: 2
> % of those killed who were Black: 14.3% (total: 1)
> % of those killed who did not have a gun: 50.0% (total: 4)
> % of those killed who were fleeing: 57.1% (total: 4)
> % of cases officer was disciplined or charged with a crime: 0.0% (total: 0)
Methodology
To determine the police department in every state with the most killings, 24/7 Wall St. reviewed data from Mapping Police Violence, a research collaborative that collects data on police killings across the nation from the country’s three largest comprehensive and impartial crowdsourced databases. Data was accessed on Feb. 22, 2023 and includes all police department killings from 2013 through the end of 2022.
The percentages of incidents in which the person killed was Black, did not have a gun, was fleeing, and in which the officer was disciplined or faced criminal charges, the figures were calculated as a percentage of incidents for which information was available in the report rather than all incidents.
Take This Retirement Quiz To Get Matched With An Advisor Now (Sponsored)
Are you ready for retirement? Planning for retirement can be overwhelming, that’s why it could be a good idea to speak to a fiduciary financial advisor about your goals today.
Start by taking this retirement quiz right here from SmartAsset that will match you with up to 3 financial advisors that serve your area and beyond in 5 minutes. Smart Asset is now matching over 50,000 people a month.
Click here now to get started.
Thank you for reading! Have some feedback for us?
Contact the 24/7 Wall St. editorial team.
Editors' Picks