Just How Large Is the High-Yield Junk Bond Market?
June 24, 2013 by Jon C. Ogg
S&P’s Global Fixed Income Research team issued a report and its sample was of 4,882 U.S. corporate instruments for that $2.2 trillion figure as of March 31, 2013. As many of 24/7 Wall St. readers look for dividends and other higher income opportunities in the stock market and bond market, we wanted to review the scope and details of this important segment of the market.
The basis to be classified as a junk bond or speculative grade simply refers to those issues which are rated BB+ and below at S&P (or Ba1 and lower at Moody’s). S&P showed another surprising figure here: about one-third of U.S. corporate ratings by dollar amount of outstanding debt are in this speculative grade category.
The lowest rated issuers have ratings of B- and lower, and these have some $304.5 billion in outstanding rated debt. The rating allocation by grade and by issuer in junk rating territory is as follows:
- 39% of outstanding debt BB
- 55% B
- 6% CCC+ and lower
- 94% from non-financial issuers
- 6% from financial issuers.
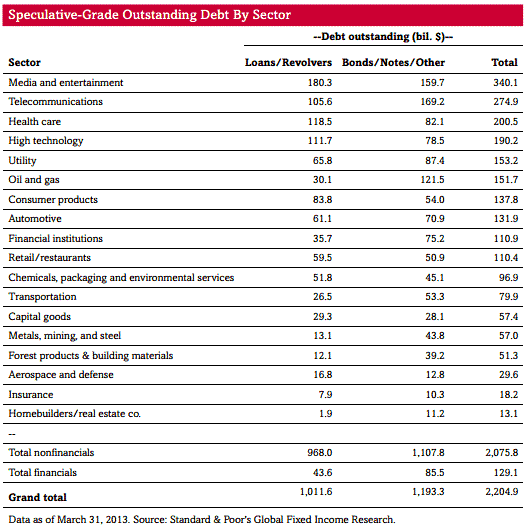
Media and entertainment is the largest speculative-grade debt sector at $340.1 billion. Telecommunications is next at $274.9 billion, followed by health care at $200.5 billion, and technology at $190.2 billion. Media and entertainment has the greatest share of loans and revolvers outstanding at $180.3 billion, and telecom has the largest share of bonds and notes outstanding at $169.2 billion.
S&P went on to show the difference here between revolving credit and in securities. It said:
46% of speculative-grade debt is in loans and revolvers, and 54% is in bonds, notes, and other. Bonds comprise the majority of debt outstanding in the ‘BB’ and ‘CCC/C’ categories, with 62% and 54%, respectively. Only in the ‘B’ category do loans and revolvers make up a majority of the debt outstanding (51%).
While many of the BB and B ratings are unsecured, the CCC/C rated issues tend to be secured credit as lenders tend to demand collateral pledges from lower-rated companies. A portion of CCC/C debt, 25%, is in the form of secured bonds, compared with just 4% of ‘BB’ debt. Senior unsecured bonds have the largest share by asset type at 39% of the total speculative-grade debt, followed by senior secured loans at 35%.
S&P had telegraphed a figure before in prior reports, but investors will want to take note about the recent rise in interest rates and the wider spread in speculative grade debt. The group showed that a whopping $1.1 trillion of speculative-grade debt in the U.S. alone is scheduled to mature between now and the end of 2017. S&P shows that 55% of speculative-grade debt outstanding was issued with an original maturity length of 7 years to 13 years, and 31% of debt outstanding was issued with an original maturity of 5 years to 7 years.
The report also noted that companies in the lowest rating levels of B- and lower are the most susceptible to running into refinancing risk. To make matters even more concerning, the report shows that the refinancing needs for those companies will rise to $64 billion in 2017 from only $33 billion in 2014. The majority of speculative-grade debt was issued in 2011 or later.
Below is a sector-by-sector chart showing how much speculative grade debt is outstanding to come up with the total $2.2 trillion market size.

Sponsored: Attention Savvy Investors: Speak to 3 Financial Experts – FREE
Ever wanted an extra set of eyes on an investment you’re considering? Now you can speak with up to 3 financial experts in your area for FREE. By simply
clicking here you can begin to match with financial professionals who can help guide you through the financial decisions you’re making. And the best part? The first conversation with them is free.
Click here to match with up to 3 financial pros who would be excited to help you make financial decisions.