The World’s Biggest Arms Importers and Their Biggest Suppliers
March 11, 2019 by Thomas FrohlichSome countries have comprehensive weapons industries and are capable of maintaining their militaries with enough supply left over to export various arms to allies and clients around the world.
These same countries are also often among the world’s largest importers of weapons. Other countries, however, rely much more heavily on arms deals with other, large, arms-producing nations.
The United States is notably not just by far the world’s largest military force, but also by far the largest supplier of arms. The U.S.’s supplies arms to at least 98 nations, and it is the largest supplier to 20 of the 40 largest arms importers in the world.
To identify the world’s biggest arms importers and their biggest suppliers, 24/7 Wall St. reviewed the 40 countries with the largest total value of major arms imports during the 2014-18 five-year period from the report on major arms export volumes published by the Stockholm International Peace Research Institute (SIPRI) on March 11. Each country’s major suppliers, all major arms import and export data, as well as annual military expenditures in 2017, also came from SIPRI. Each country’s GDP per capita in 2016 came from the World Bank.
Click here to see the world’s biggest arms importers and their biggest suppliers.
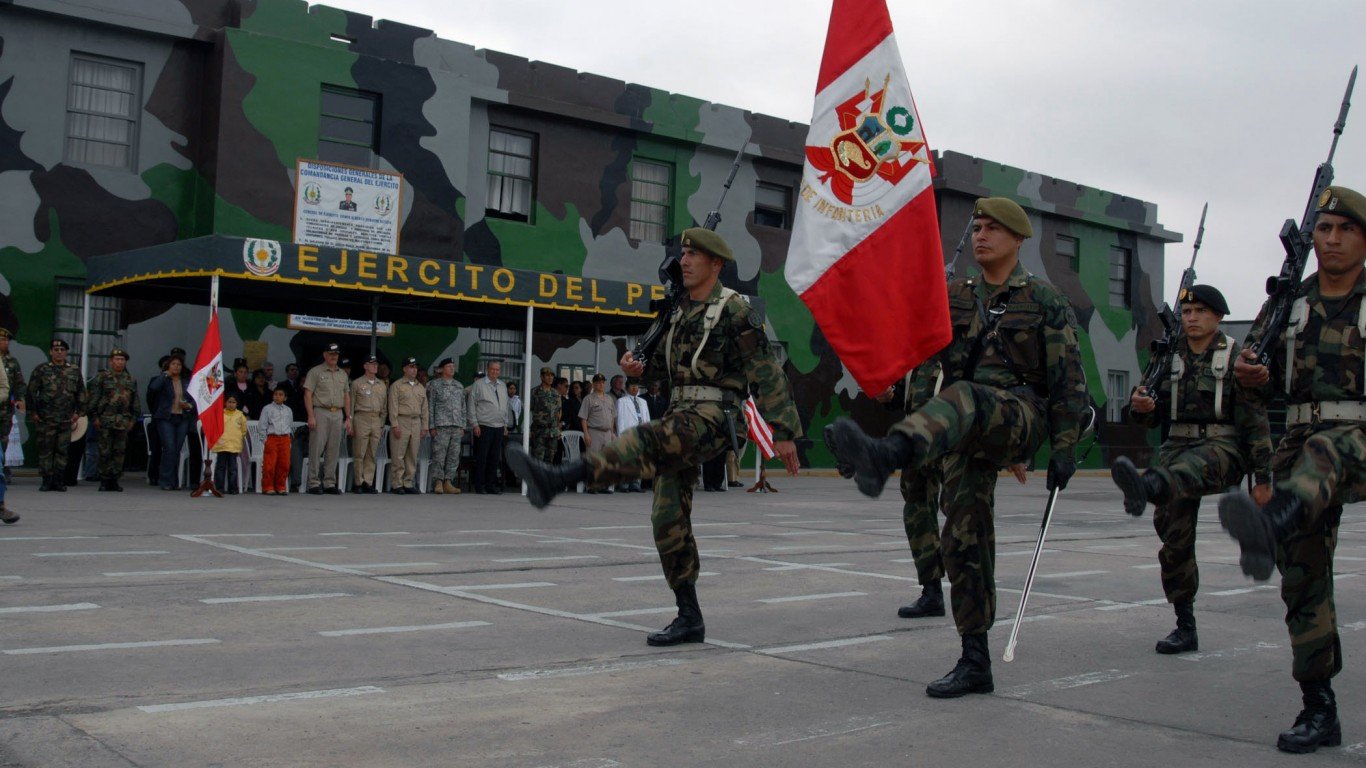
40. Peru
> Share of global arms imports (2014-18): 0.5%
> Main supplier, share of importer’s total imports: South Korea, 34%
> GDP per capita: $12,237
> Armed forces, total personnel (2016): 158,000
[in-text-ad]
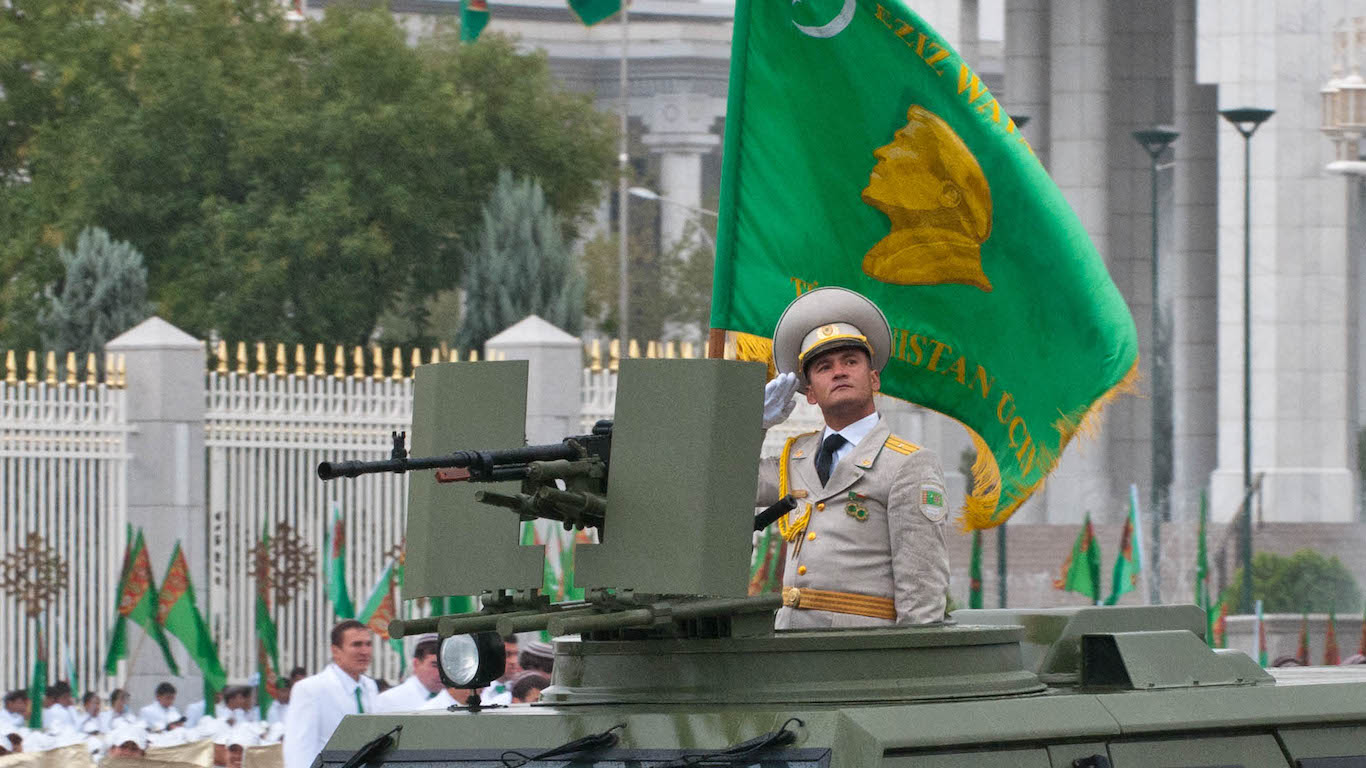
39. Turkmenistan
> Share of global arms imports (2014-18): 0.5%
> Main supplier, share of importer’s total imports: Turkey, 43%
> GDP per capita: $16,389
> Armed forces, total personnel (2016): 41,500
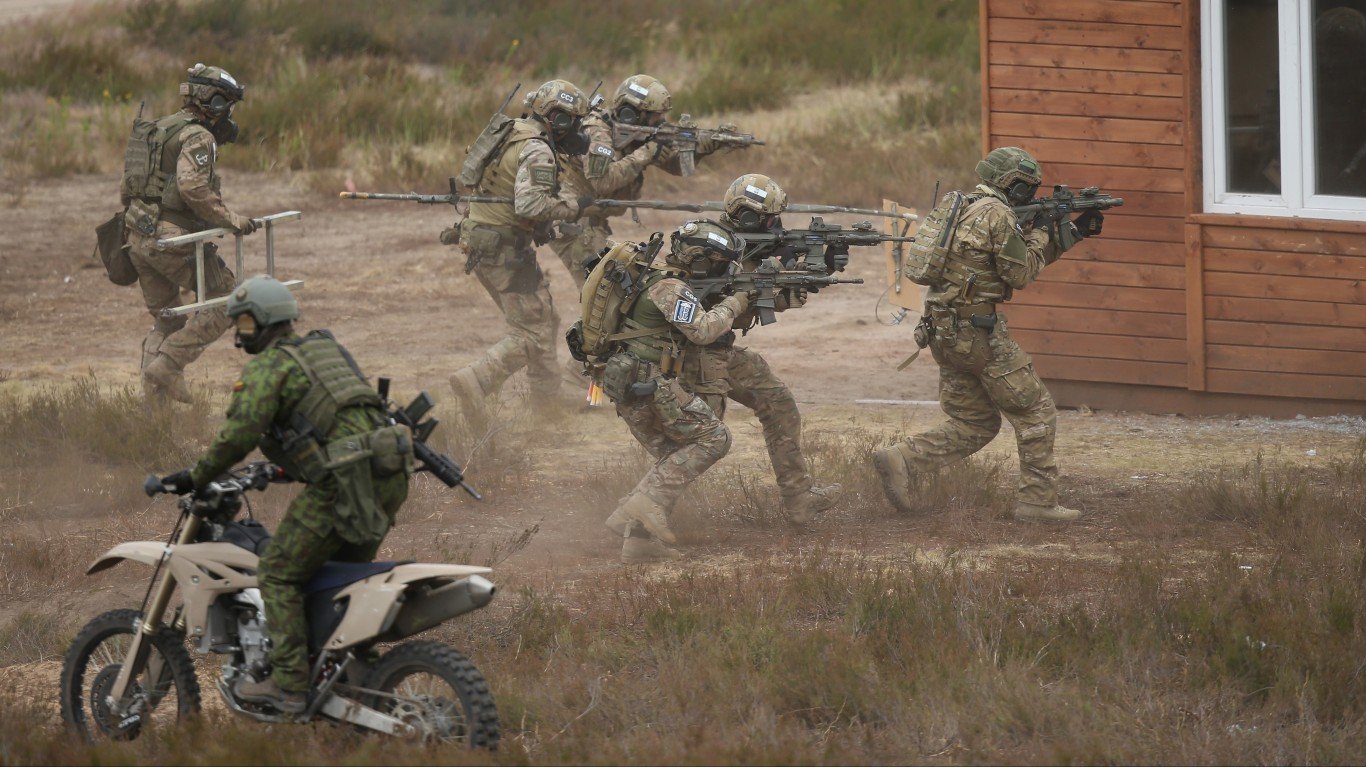
38. Poland
> Share of global arms imports (2014-18): 0.6%
> Main supplier, share of importer’s total imports: Germany, 28%
> GDP per capita: $27,343
> Armed forces, total personnel (2016): 178,400
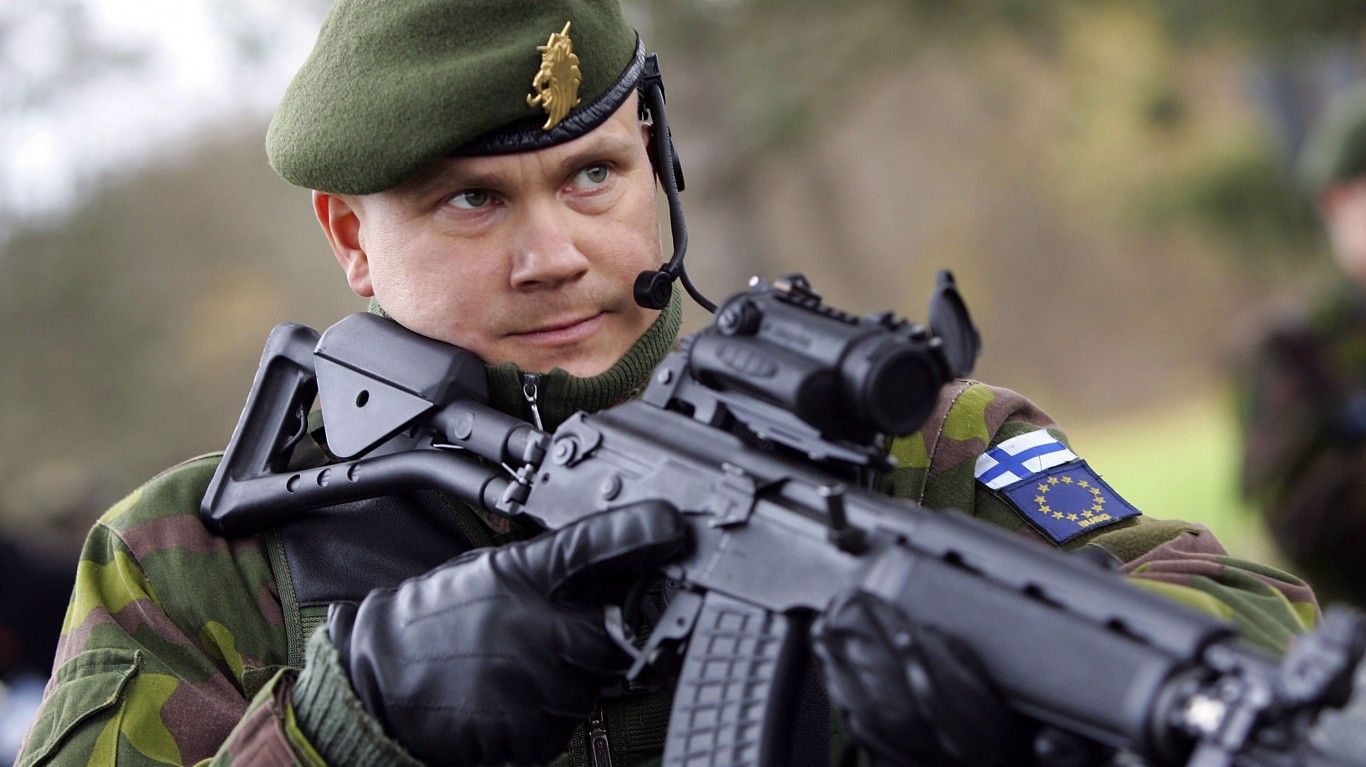
37. Finland
> Share of global arms imports (2014-18): 0.6%
> Main supplier, share of importer’s total imports: USA, 37%
> GDP per capita: $40,586
> Armed forces, total personnel (2016): 24,200
[in-text-ad-2]
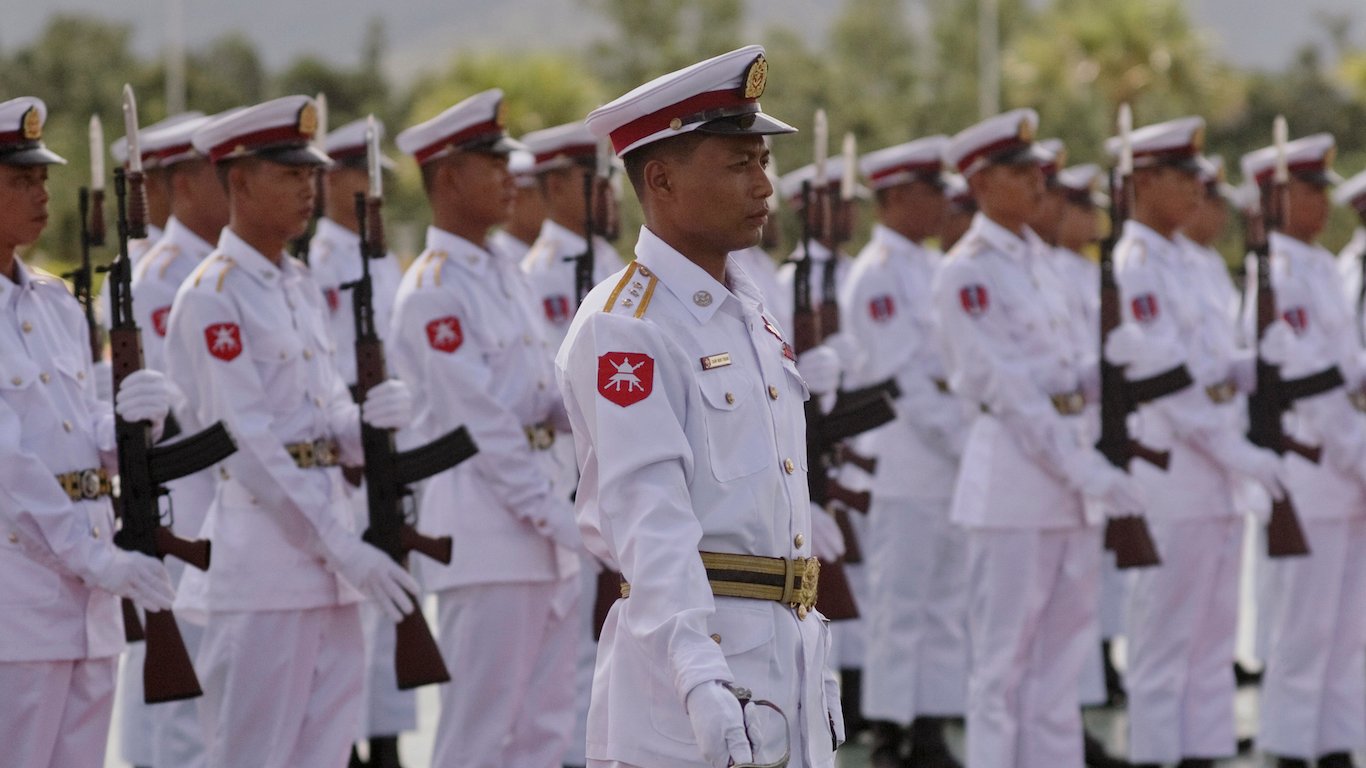
36. Myanmar
> Share of global arms imports (2014-18): 0.6%
> Main supplier, share of importer’s total imports: China, 61%
> GDP per capita: $5,612
> Armed forces, total personnel (2016): 513,250

35. Brazil
> Share of global arms imports (2014-18): 0.6%
> Main supplier, share of importer’s total imports: France, 26%
> GDP per capita: $14,103
> Armed forces, total personnel (2016): 729,500
[in-text-ad]
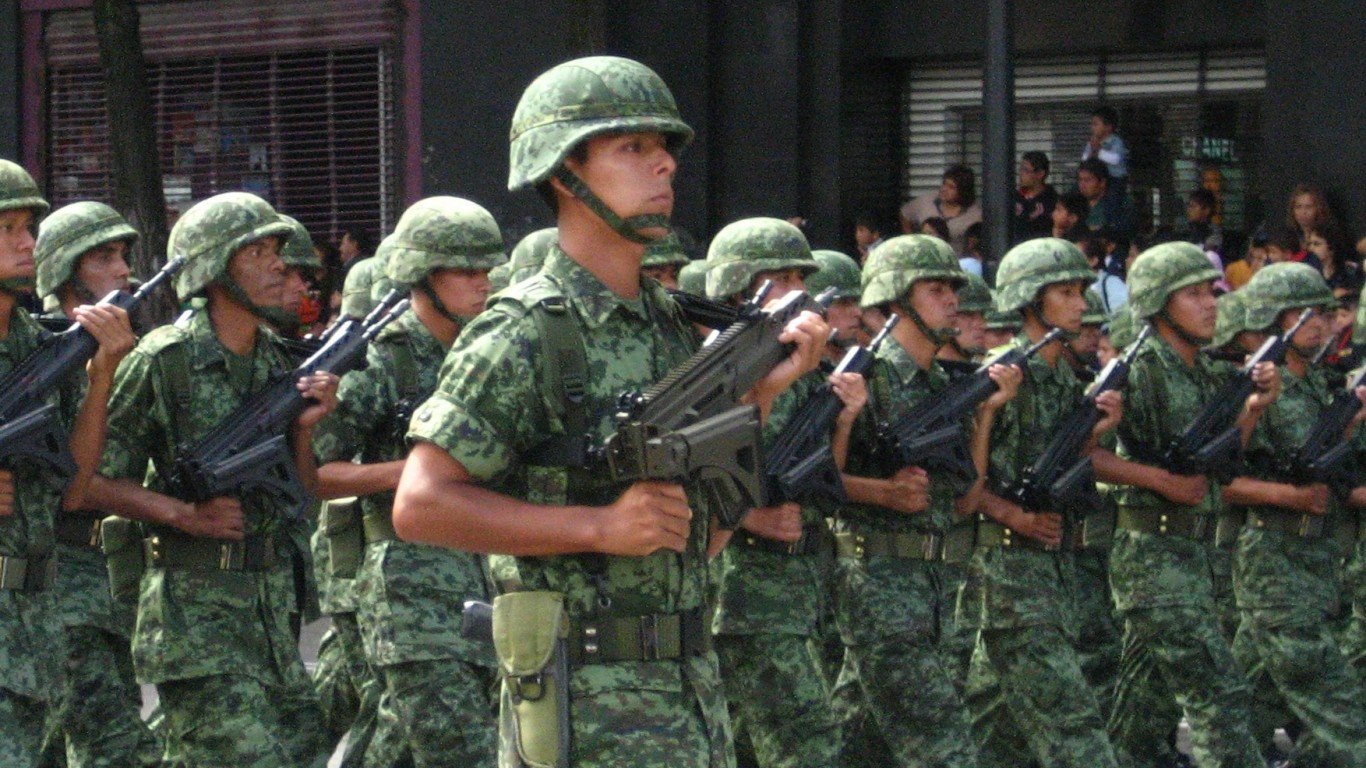
34. Mexico
> Share of global arms imports (2014-18): 0.7%
> Main supplier, share of importer’s total imports: USA, 63%
> GDP per capita: $17,331
> Armed forces, total personnel (2016): 336,050
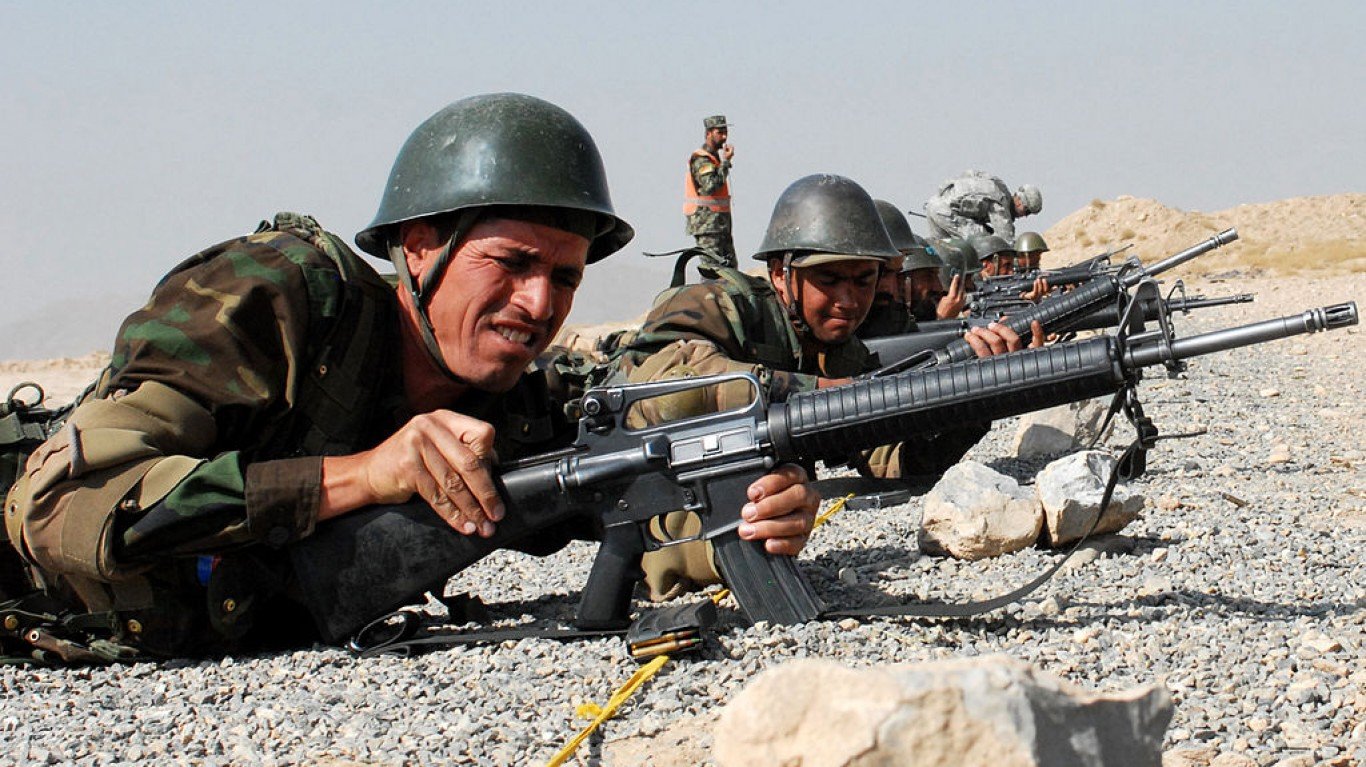
33. Afghanistan
> Share of global arms imports (2014-18): 0.8%
> Main supplier, share of importer’s total imports: USA, 66%
> GDP per capita: $1,796
> Armed forces, total personnel (2016): 323,000
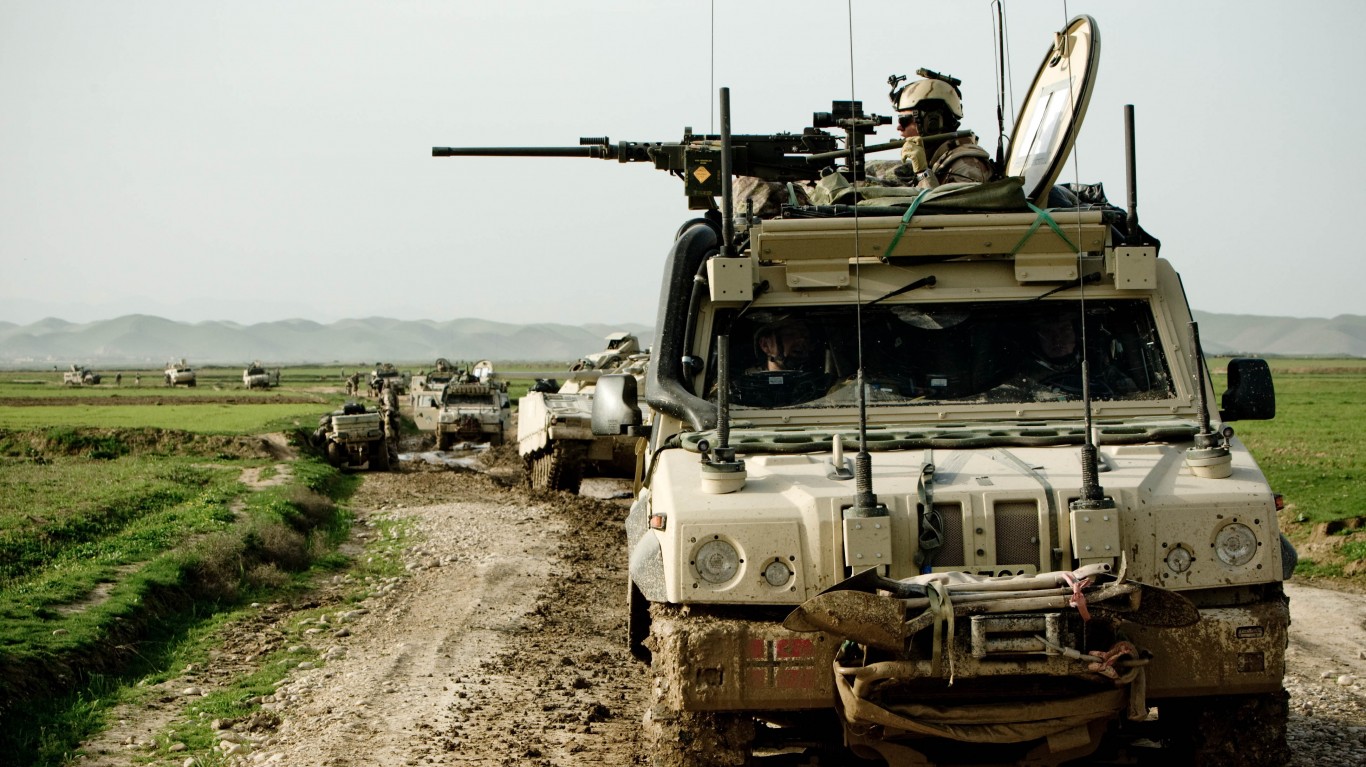
32. Norway
> Share of global arms imports (2014-18): 0.8%
> Main supplier, share of importer’s total imports: USA, 76%
> GDP per capita: $64,800
> Armed forces, total personnel (2016): 23,950
[in-text-ad-2]

31. Jordan
> Share of global arms imports (2014-18): 0.9%
> Main supplier, share of importer’s total imports: Netherlands, 37%
> GDP per capita: $8,337
> Armed forces, total personnel (2016): 115,500

30. Kazakhstan
> Share of global arms imports (2014-18): 0.9%
> Main supplier, share of importer’s total imports: Russia, 84%
> GDP per capita: $24,079
> Armed forces, total personnel (2016): 70,500
[in-text-ad]
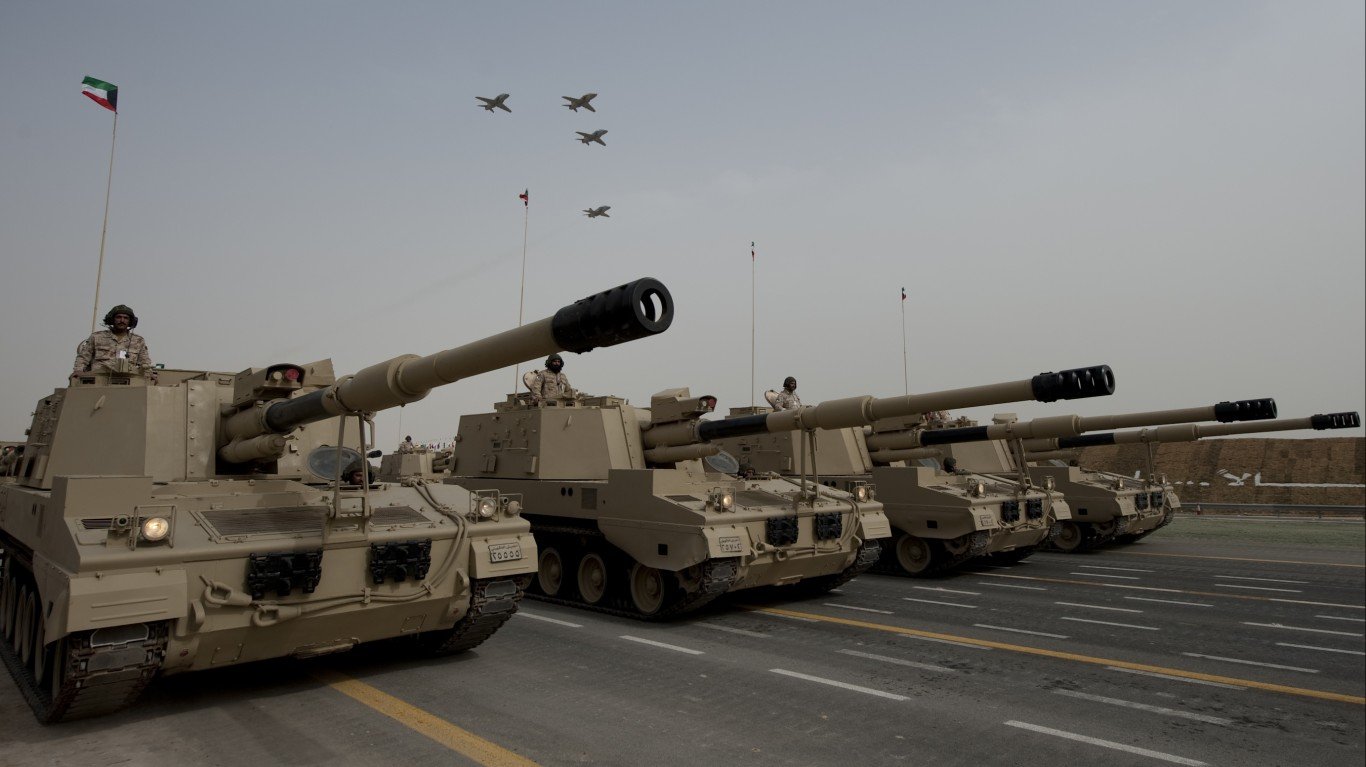
29. Kuwait
> Share of global arms imports (2014-18): 1.0%
> Main supplier, share of importer’s total imports: USA, 87%
> GDP per capita: $65,531
> Armed forces, total personnel (2016): 22,600

28. Greece
> Share of global arms imports (2014-18): 1.0%
> Main supplier, share of importer’s total imports: Germany, 67%
> GDP per capita: $24,574
> Armed forces, total personnel (2016): 145,350
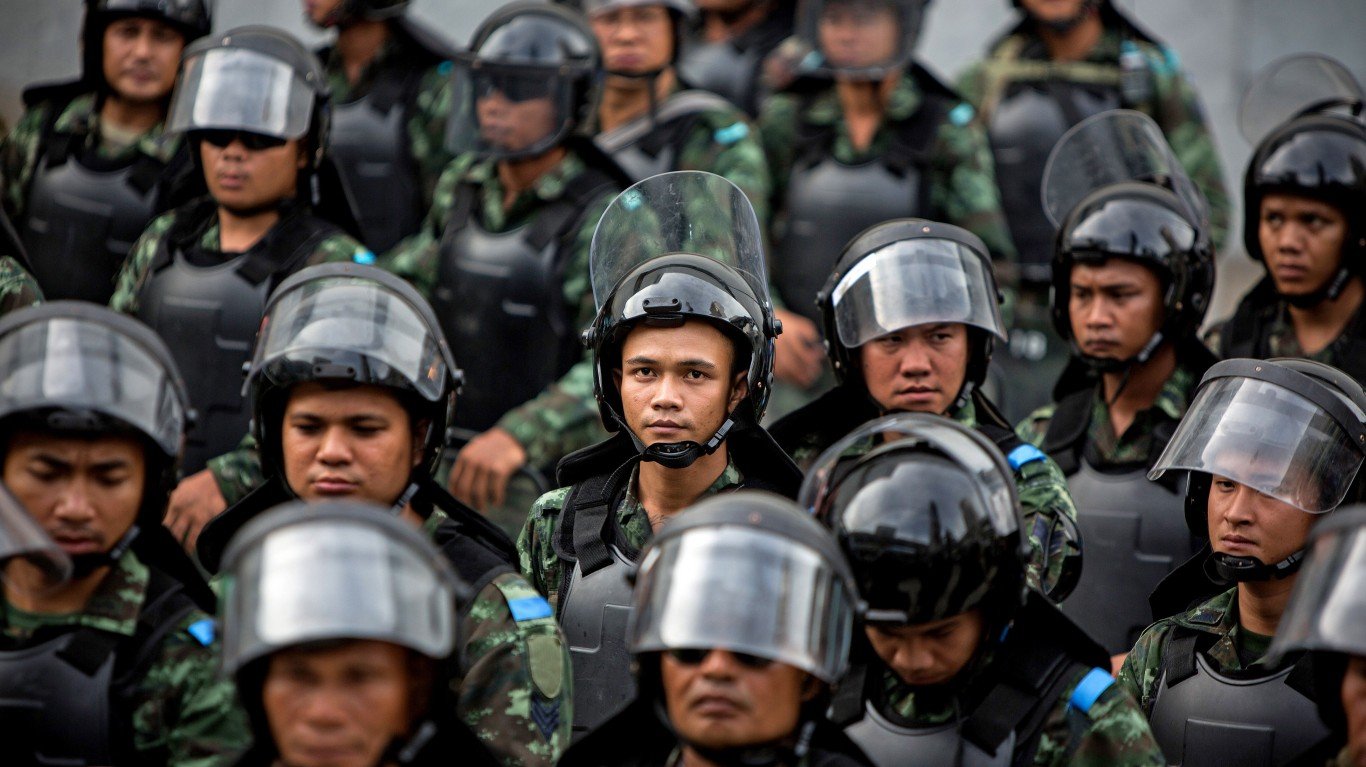
27. Thailand
> Share of global arms imports (2014-18): 1.0%
> Main supplier, share of importer’s total imports: South Korea, 20%
> GDP per capita: $16,279
> Armed forces, total personnel (2016): 454,550
[in-text-ad-2]
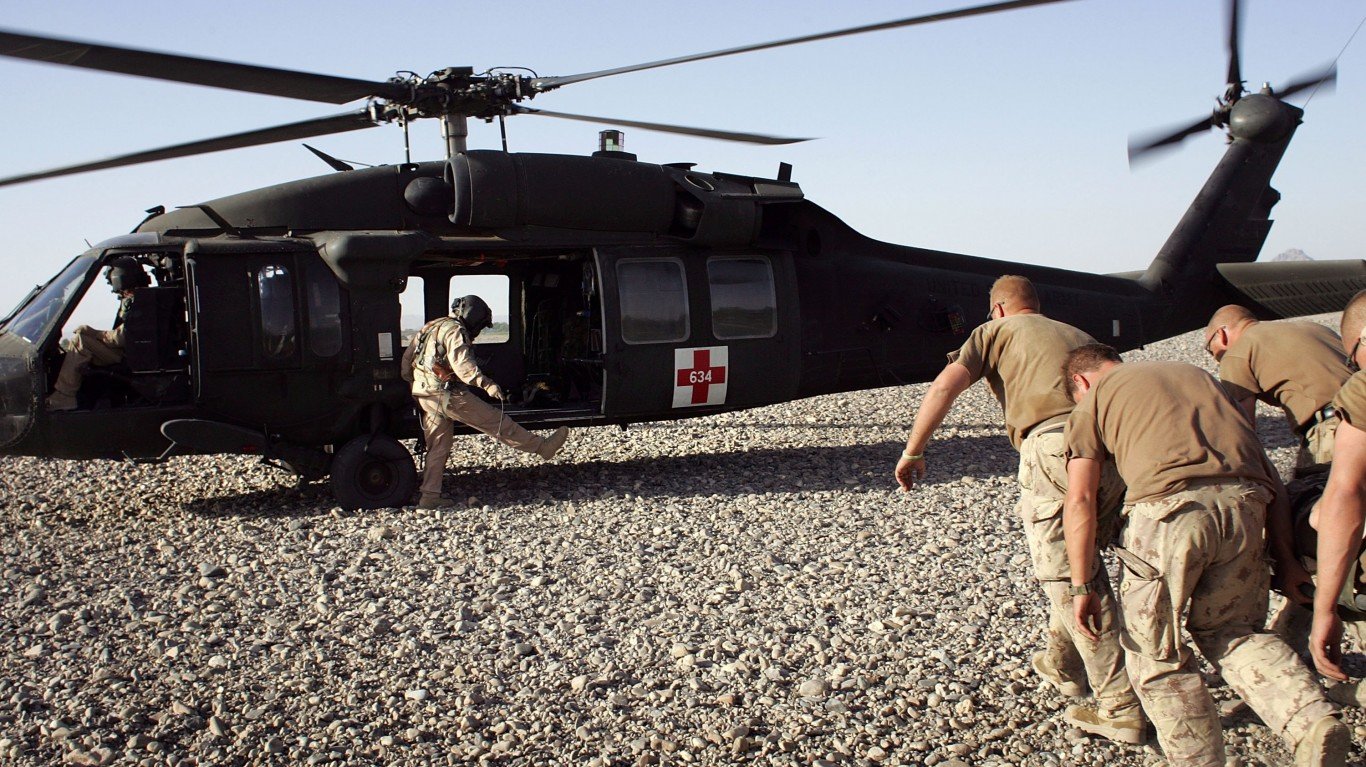
26. Canada
> Share of global arms imports (2014-18): 1.0%
> Main supplier, share of importer’s total imports: USA, 63%
> GDP per capita: $44,018
> Armed forces, total personnel (2016): 67,500
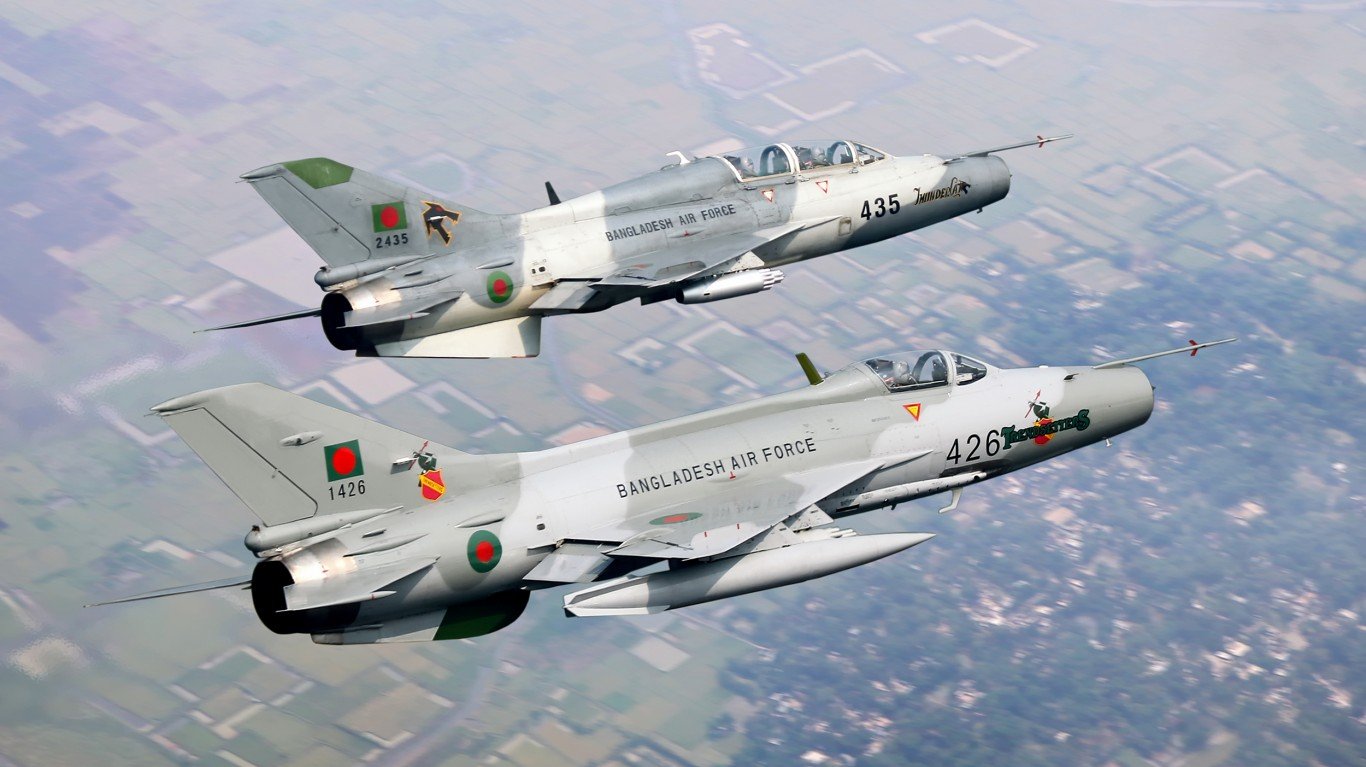
25. Bangladesh
> Share of global arms imports (2014-18): 1.2%
> Main supplier, share of importer’s total imports: China, 70%
> GDP per capita: $3,524
> Armed forces, total personnel (2016): 220,950
[in-text-ad]
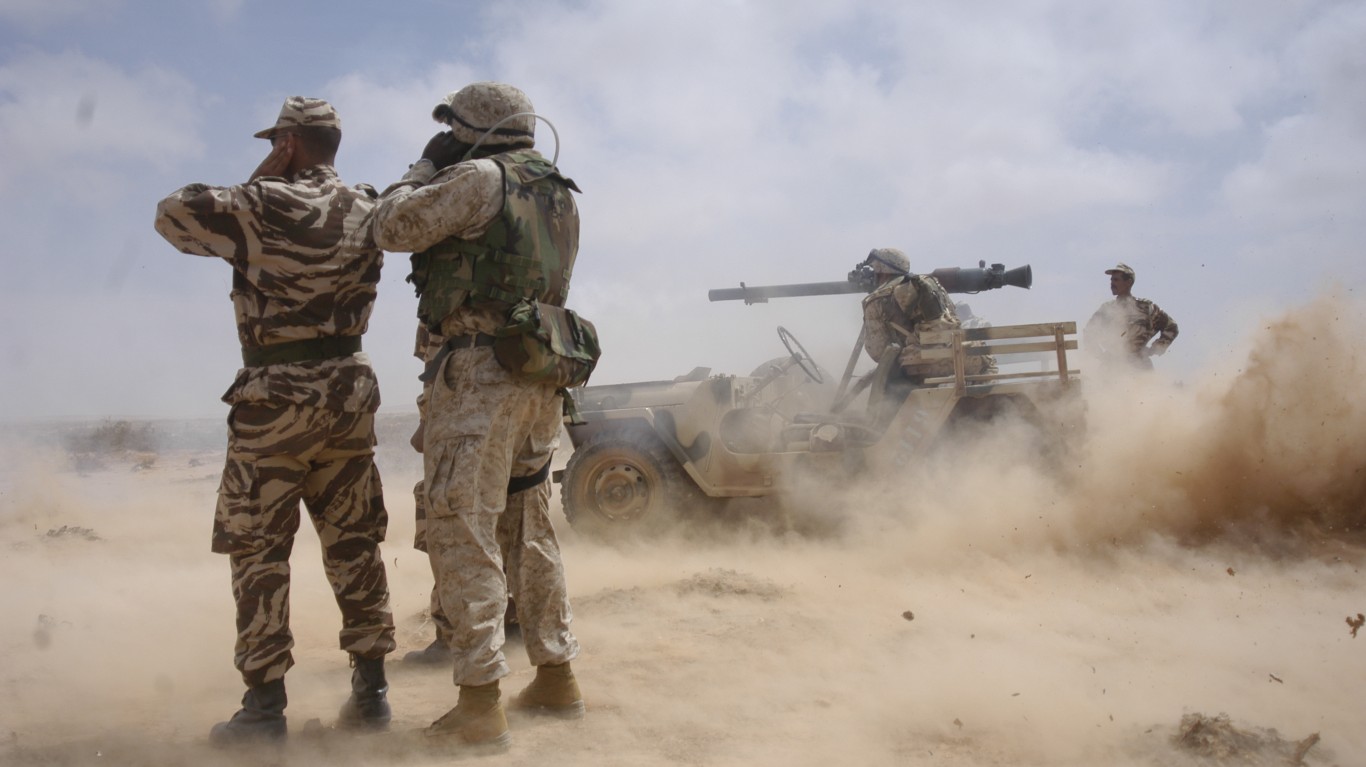
24. Morocco
> Share of global arms imports (2014-18): 1.2%
> Main supplier, share of importer’s total imports: USA, 62%
> GDP per capita: $7,485
> Armed forces, total personnel (2016): 245,800
 24/7 Wall St.
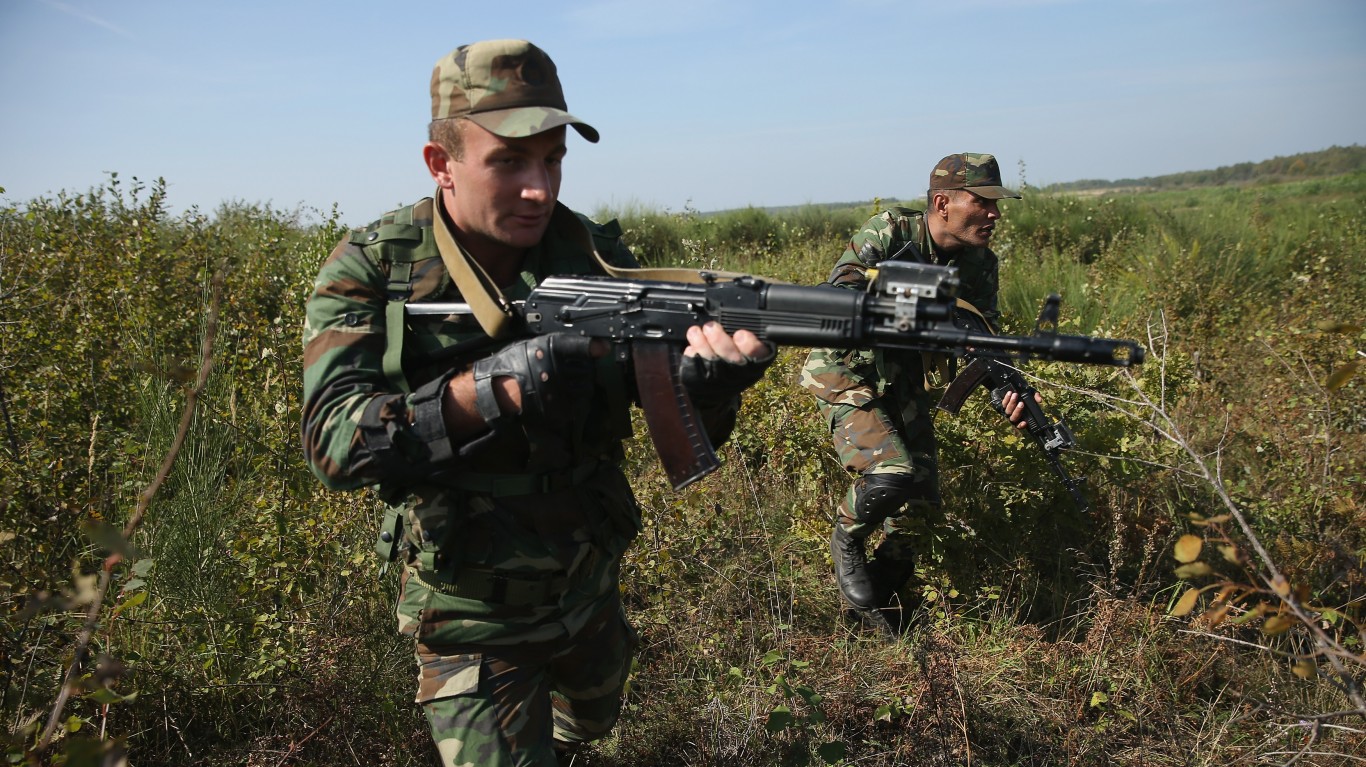
23. Azerbaijan
> Share of global arms imports (2014-18): 1.3%
> Main supplier, share of importer’s total imports: Russia, 51%
> GDP per capita: $15,847
> Armed forces, total personnel (2016): 81,950
22. Singapore
> Share of global arms imports (2014-18): 1.3%
> Main supplier, share of importer’s total imports: USA, 46%
> GDP per capita: $85,535
> Armed forces, total personnel (2016): 147,600
[in-text-ad-2]
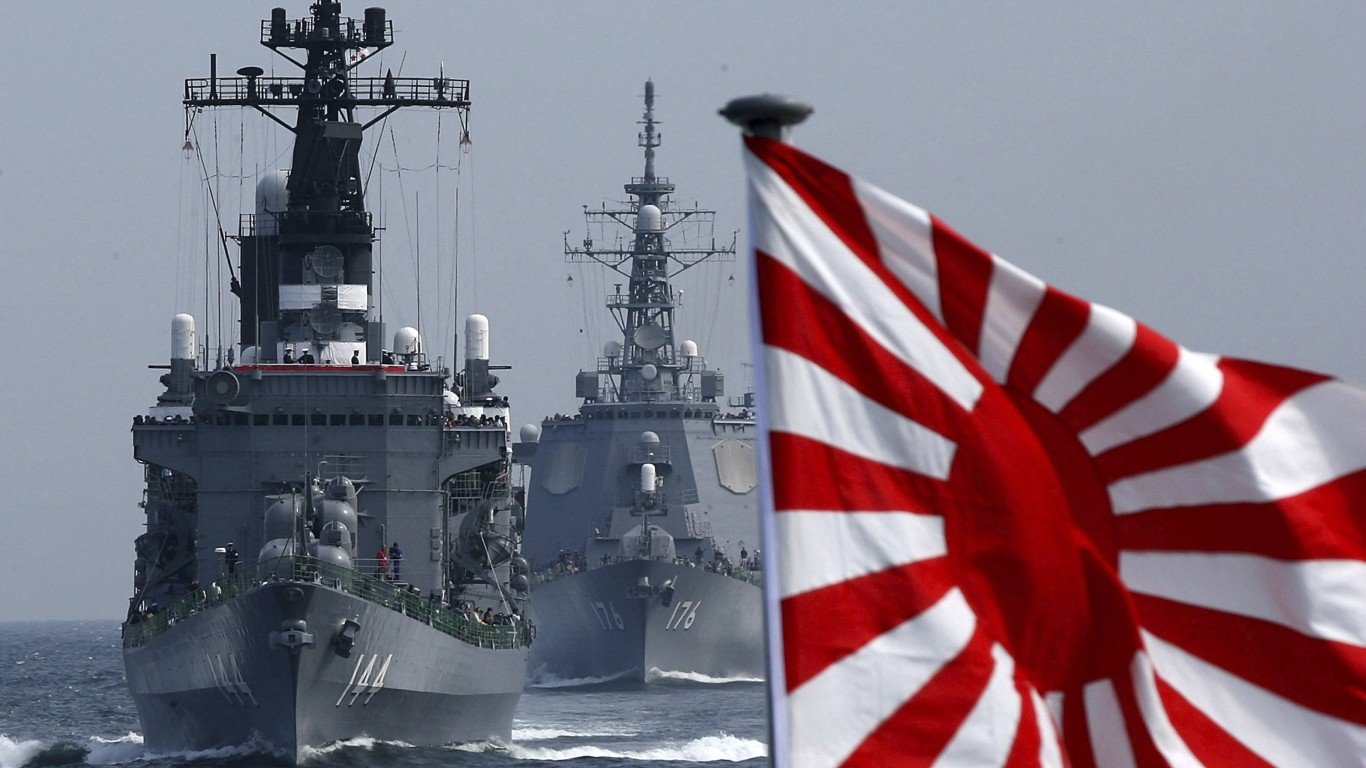
21. Japan
> Share of global arms imports (2014-18): 1.4%
> Main supplier, share of importer’s total imports: USA, 95%
> GDP per capita: $39,002
> Armed forces, total personnel (2016): 260,890

20. Italy
> Share of global arms imports (2014-18): 1.5%
> Main supplier, share of importer’s total imports: USA, 59%
> GDP per capita: $35,220
> Armed forces, total personnel (2016): 356,850
[in-text-ad]
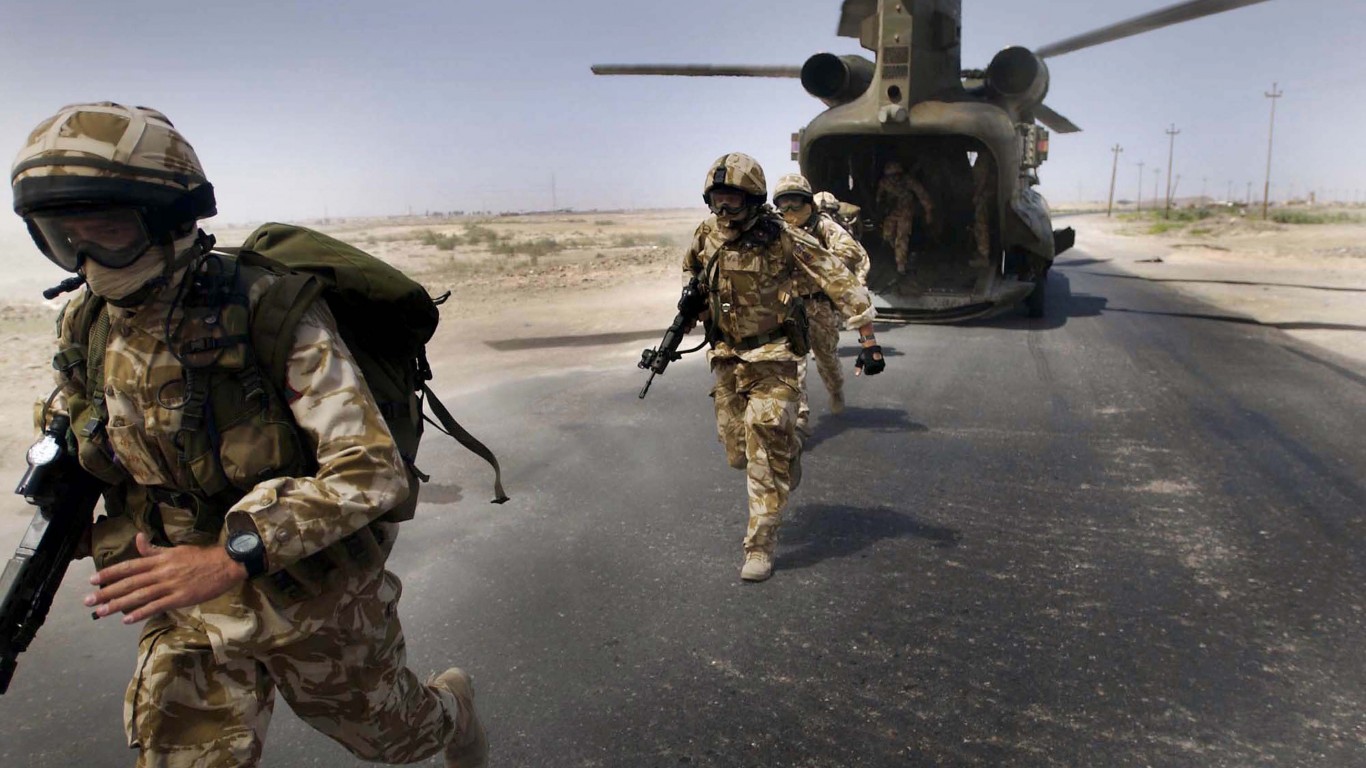
19. United Kingdom
> Share of global arms imports (2014-18): 1.6%
> Main supplier, share of importer’s total imports: USA, 71%
> GDP per capita: $39,753
> Armed forces, total personnel (2016): 150,250
 24/7 Wall St.
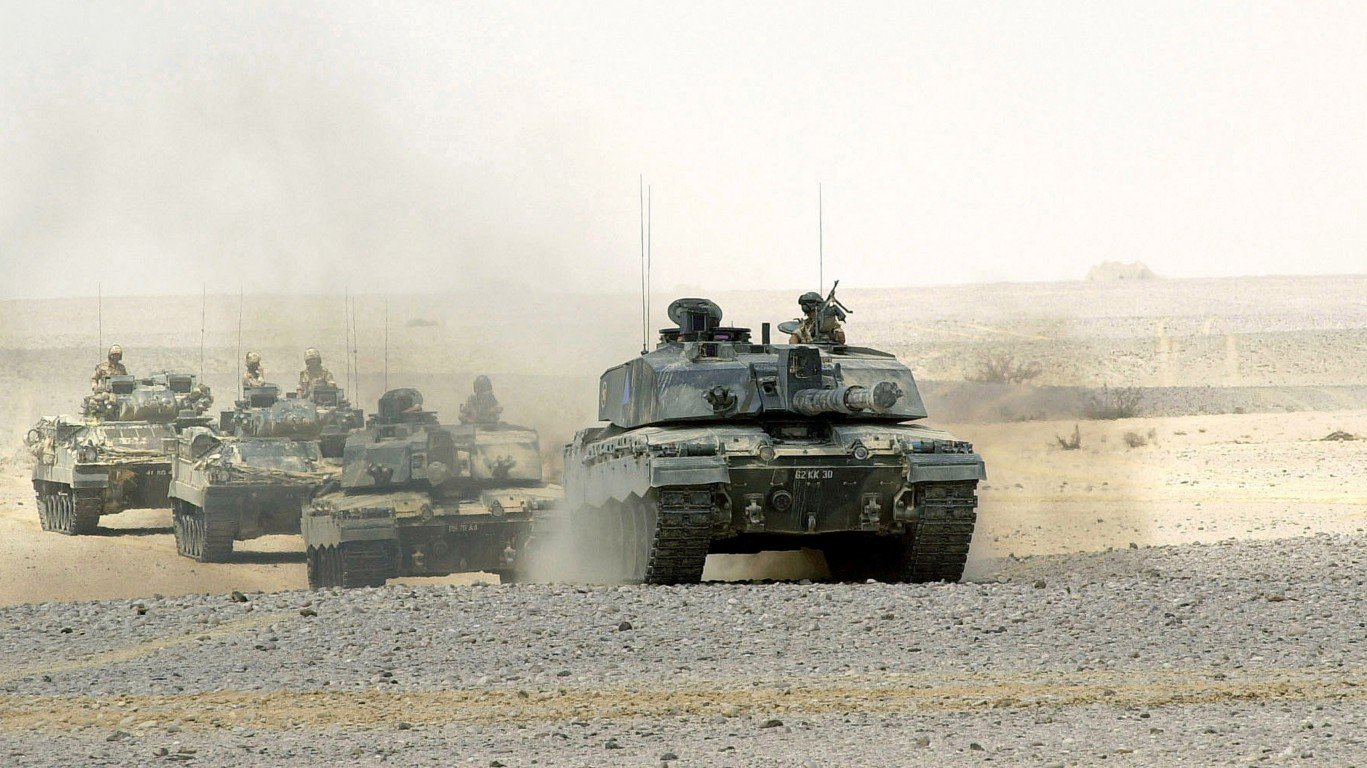
18. Oman
> Share of global arms imports (2014-18): 1.6%
> Main supplier, share of importer’s total imports: UK, 39%
> GDP per capita: $37,961
> Armed forces, total personnel (2016): 47,000
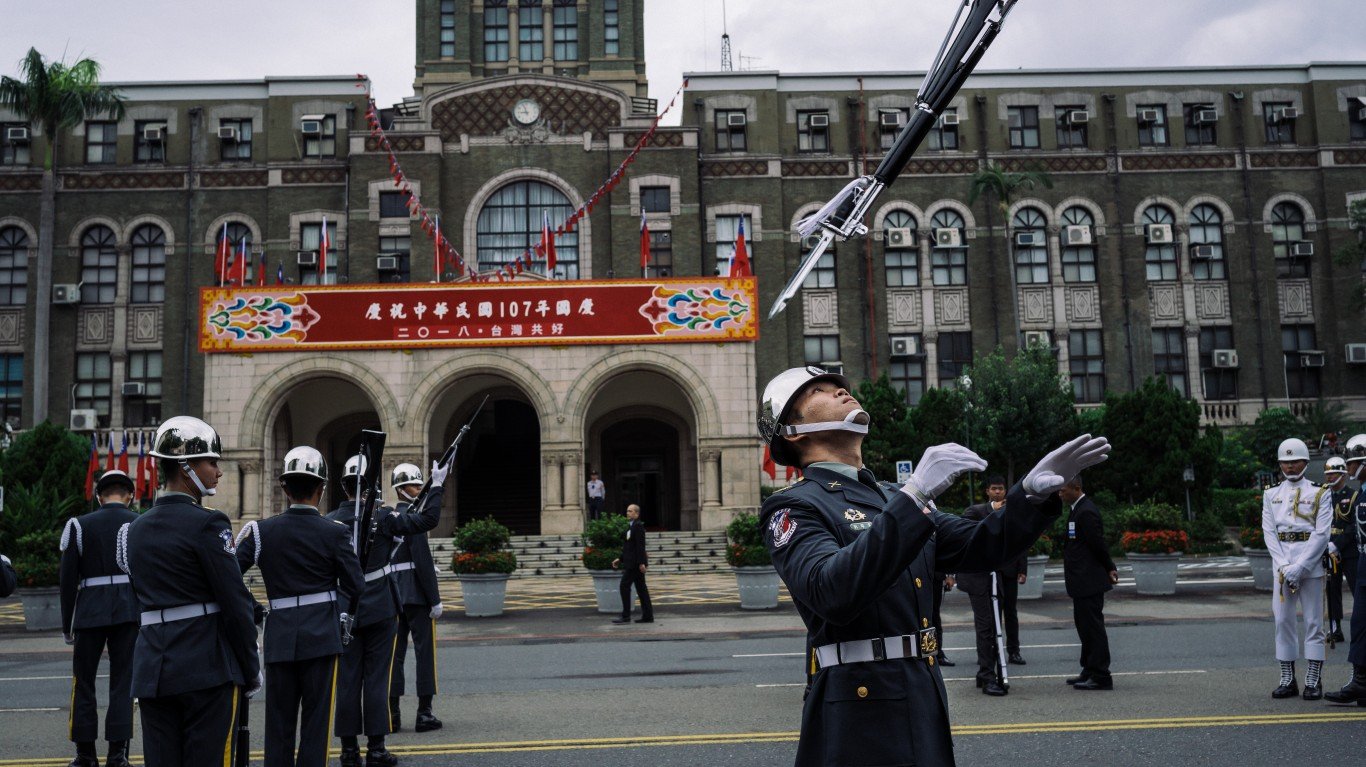
17. Taiwan
> Share of global arms imports (2014-18): 1.7%
> Main supplier, share of importer’s total imports: USA, 100%
> GDP per capita: N/A
> Armed forces, total personnel (2016): N/A
[in-text-ad-2]
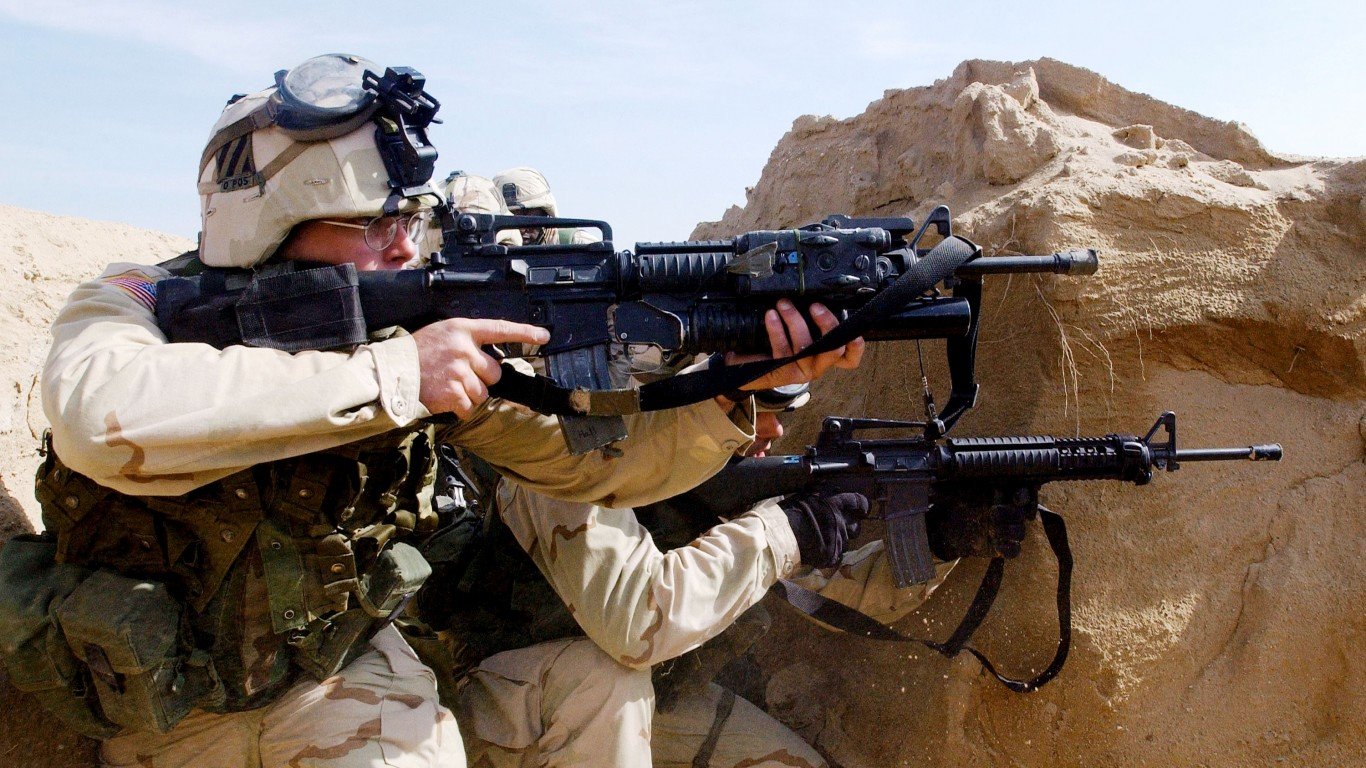
16. United States
> Share of global arms imports (2014-18): 1.8%
> Main supplier, share of importer’s total imports: Germany, 22%
> GDP per capita: $54,225
> Armed forces, total personnel (2016): 1,348,400
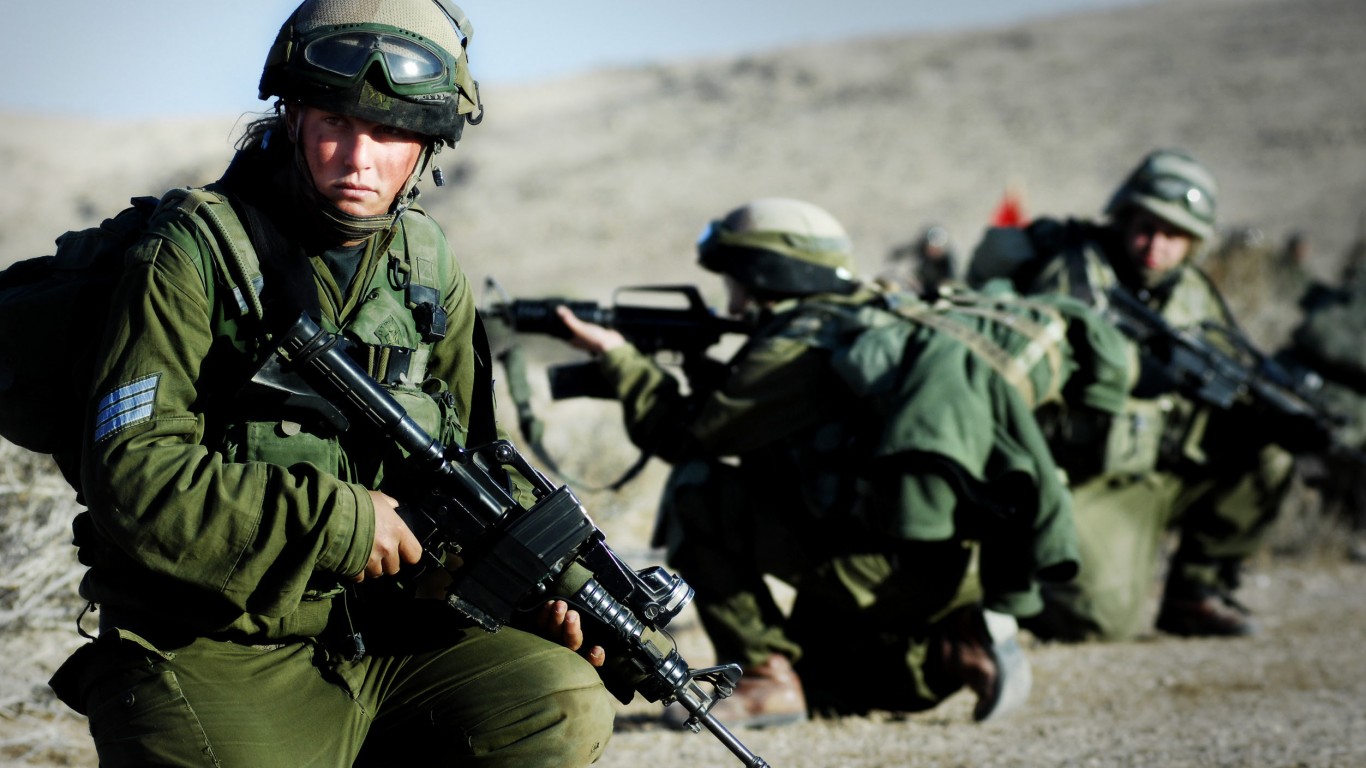
15. Israel
> Share of global arms imports (2014-18): 2.0%
> Main supplier, share of importer’s total imports: USA, 64%
> GDP per capita: $33,132
> Armed forces, total personnel (2016): 184,500
[in-text-ad]
14. Qatar
> Share of global arms imports (2014-18): 2.0%
> Main supplier, share of importer’s total imports: USA, 65%
> GDP per capita: $116,932
> Armed forces, total personnel (2016): 21,500
 24/7 Wall St.
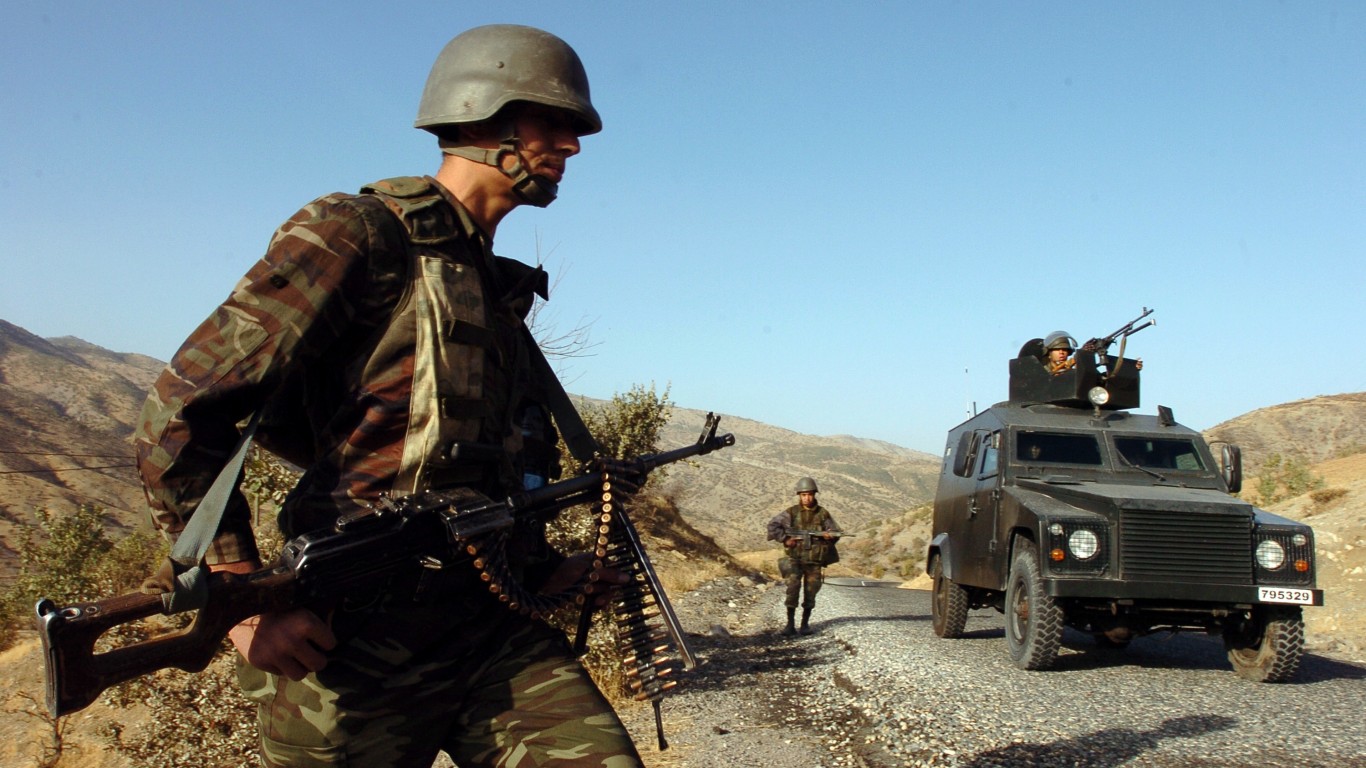
13. Turkey
> Share of global arms imports (2014-18): 2.3%
> Main supplier, share of importer’s total imports: USA, 60%
> GDP per capita: $25,135
> Armed forces, total personnel (2016): 512,000
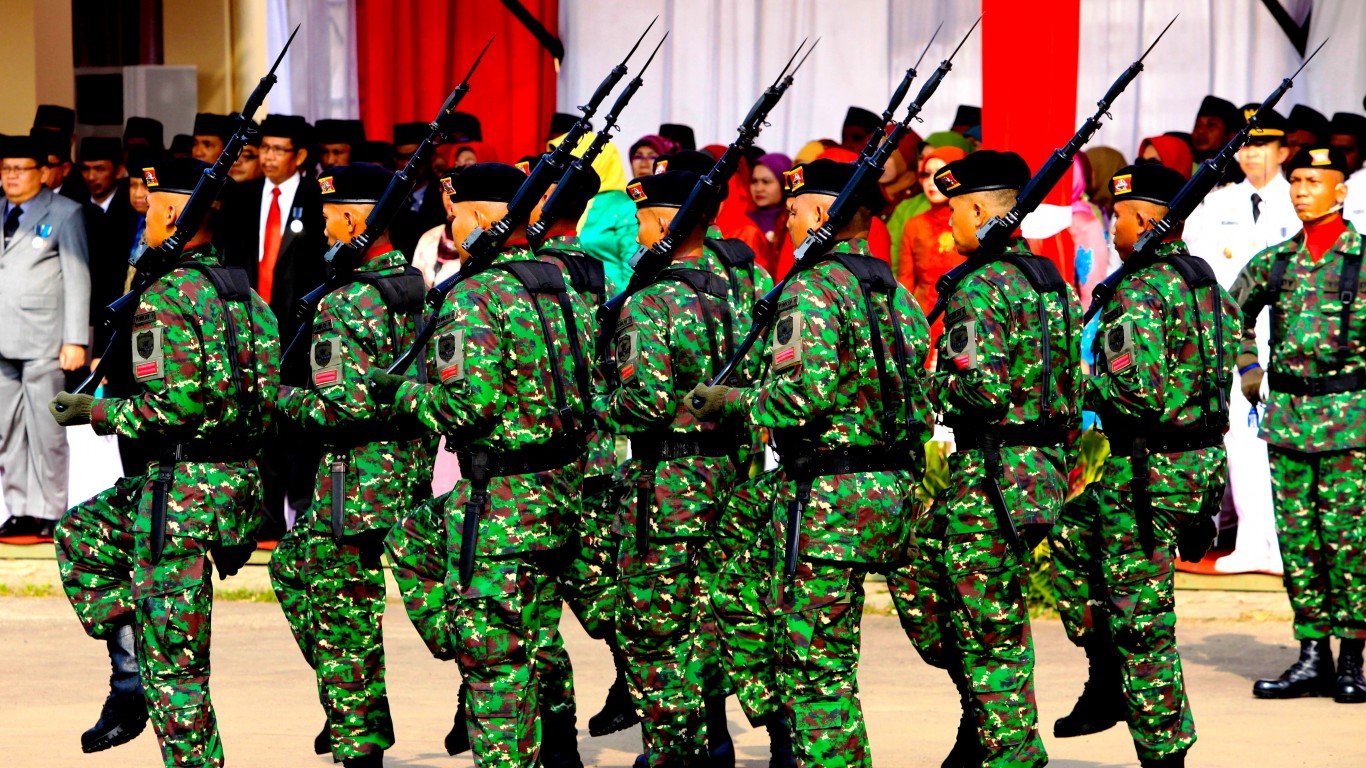
12. Indonesia
> Share of global arms imports (2014-18): 2.5%
> Main supplier, share of importer’s total imports: UK, 19%
> GDP per capita: $11,189
> Armed forces, total personnel (2016): 675,500
[in-text-ad-2]

11. Pakistan
> Share of global arms imports (2014-18): 2.7%
> Main supplier, share of importer’s total imports: China, 70%
> GDP per capita: $5,035
> Armed forces, total personnel (2016): 935,800
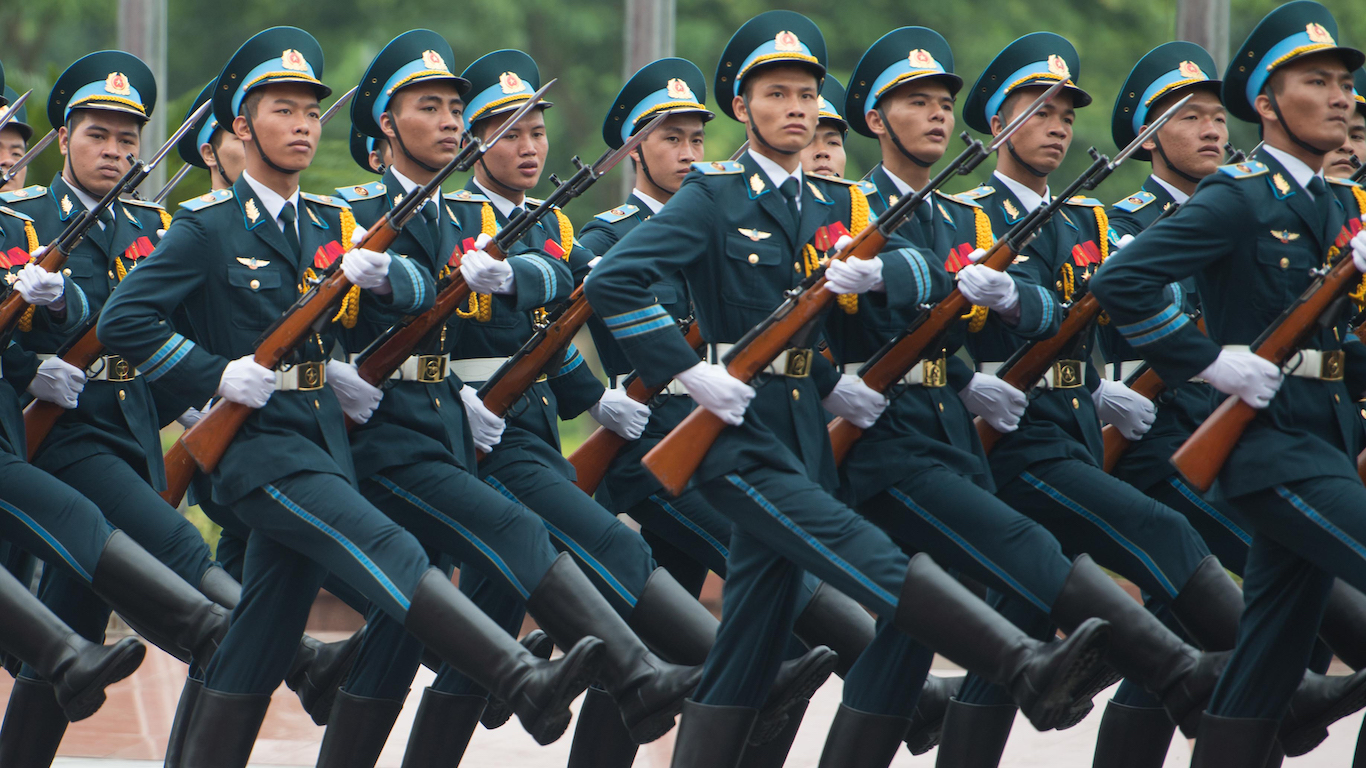
10. Vietnam
> Share of global arms imports (2014-18): 2.9%
> Main supplier, share of importer’s total imports: Russia, 78%
> GDP per capita: $6,172
> Armed forces, total personnel (2016): 522,000
[in-text-ad]
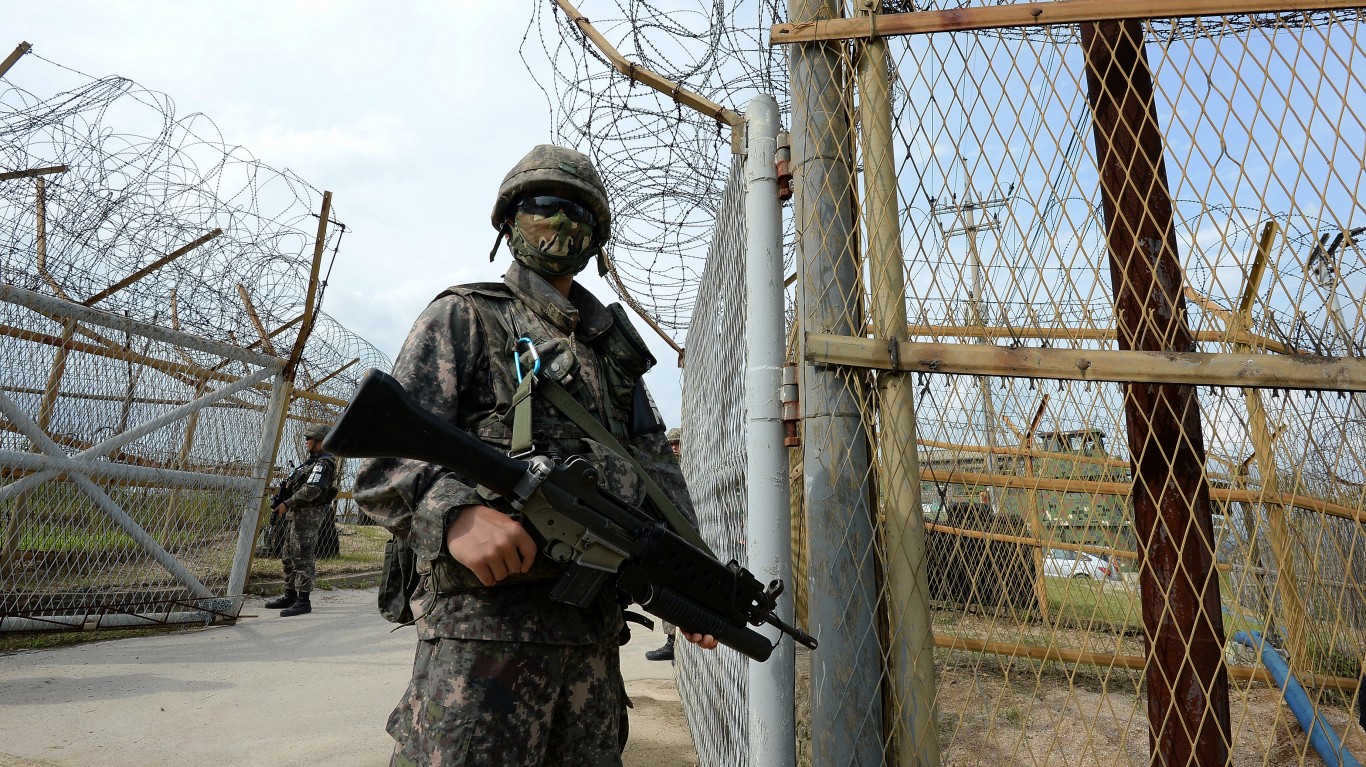
9. South Korea
> Share of global arms imports (2014-18): 3.1%
> Main supplier, share of importer’s total imports: USA, 51%
> GDP per capita: $35,938
> Armed forces, total personnel (2016): 634,000
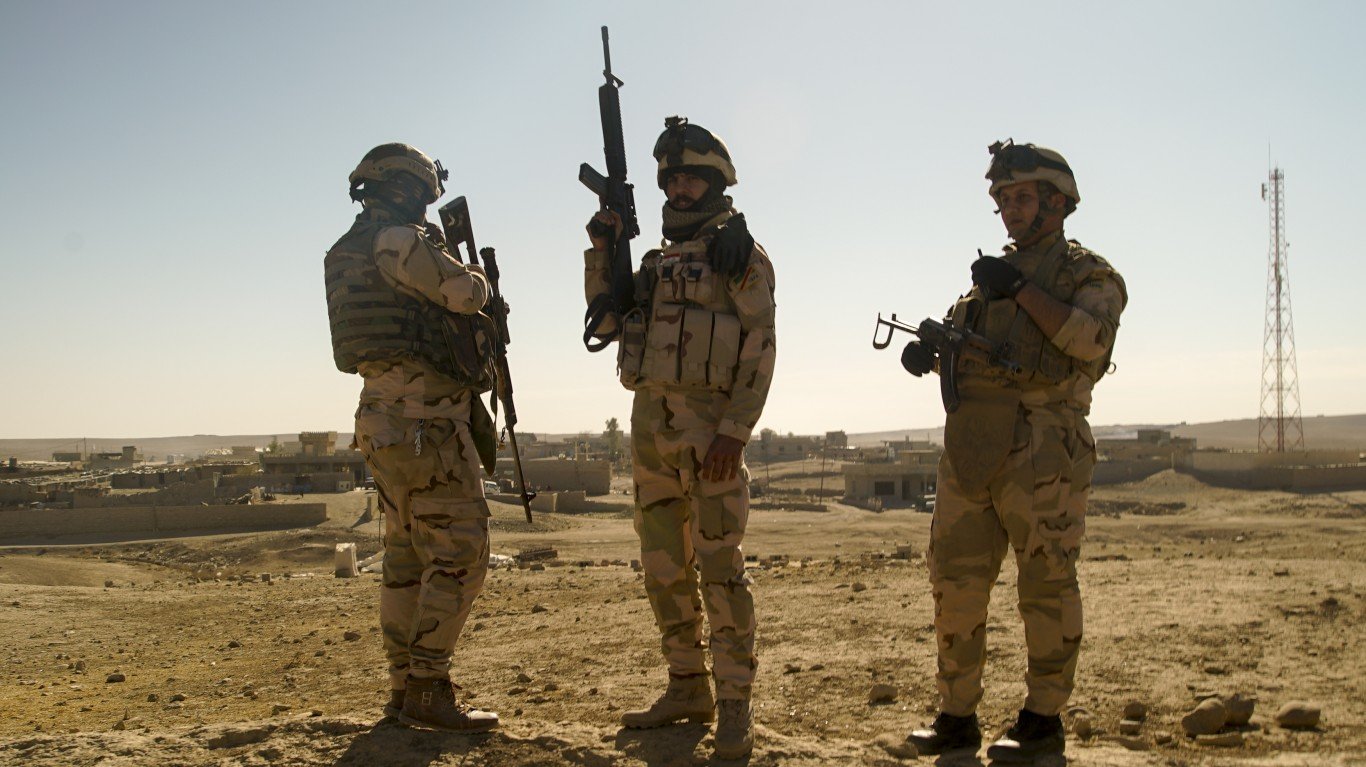
8. Iraq
> Share of global arms imports (2014-18): 3.7%
> Main supplier, share of importer’s total imports: USA, 47%
> GDP per capita: $15,393
> Armed forces, total personnel (2016): 209,000
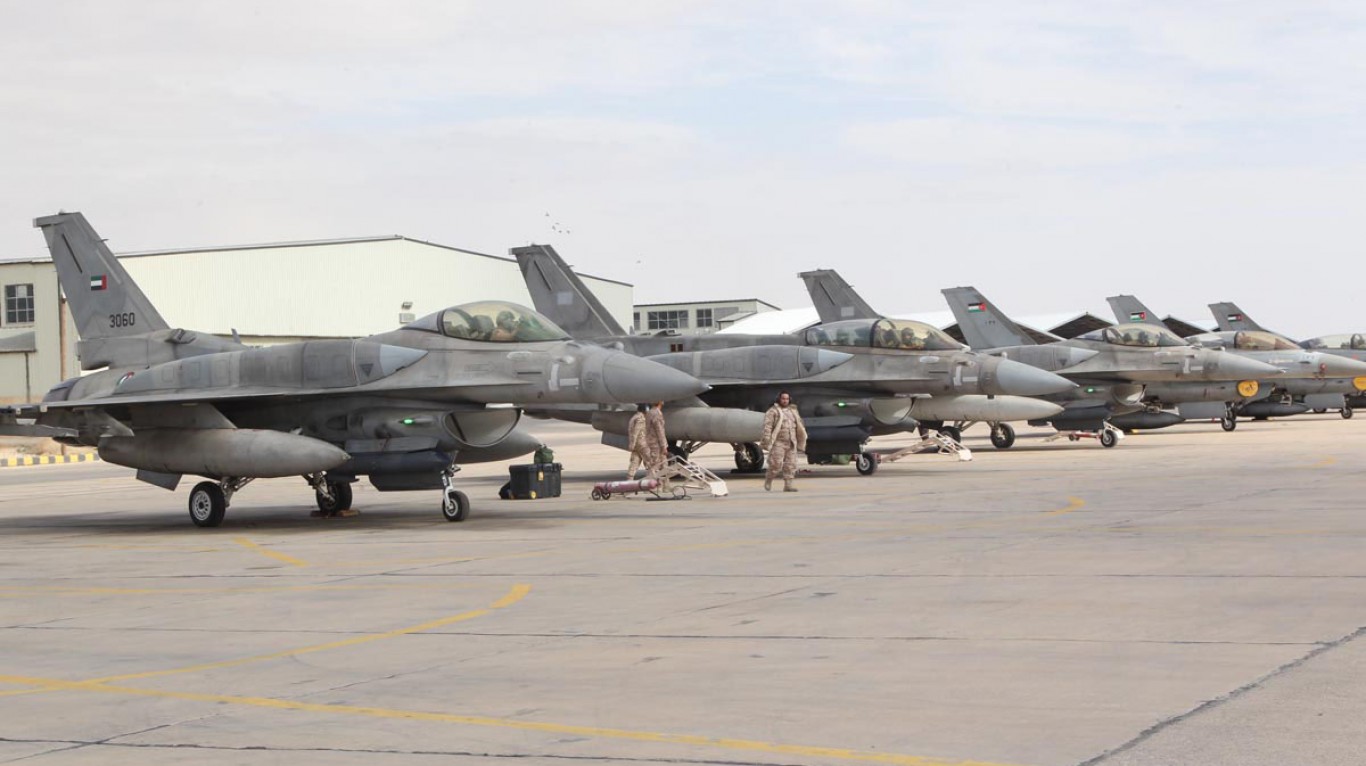
7. United Arab Emirates
> Share of global arms imports (2014-18): 3.7%
> Main supplier, share of importer’s total imports: USA, 64%
> GDP per capita: $67,293
> Armed forces, total personnel (2016): 63,000
[in-text-ad-2]
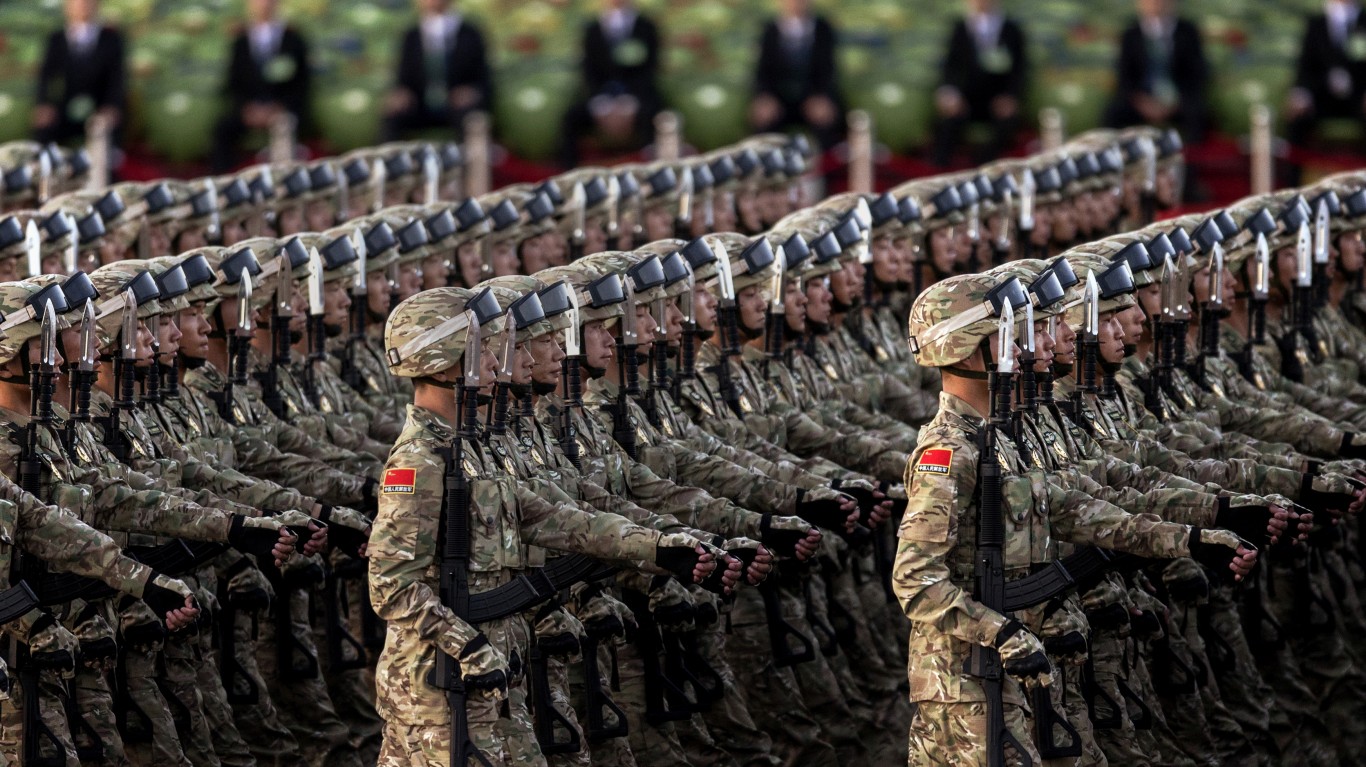
6. China
> Share of global arms imports (2014-18): 4.2%
> Main supplier, share of importer’s total imports: Russia, 70%
> GDP per capita: $15,309
> Armed forces, total personnel (2016): 2,695,000
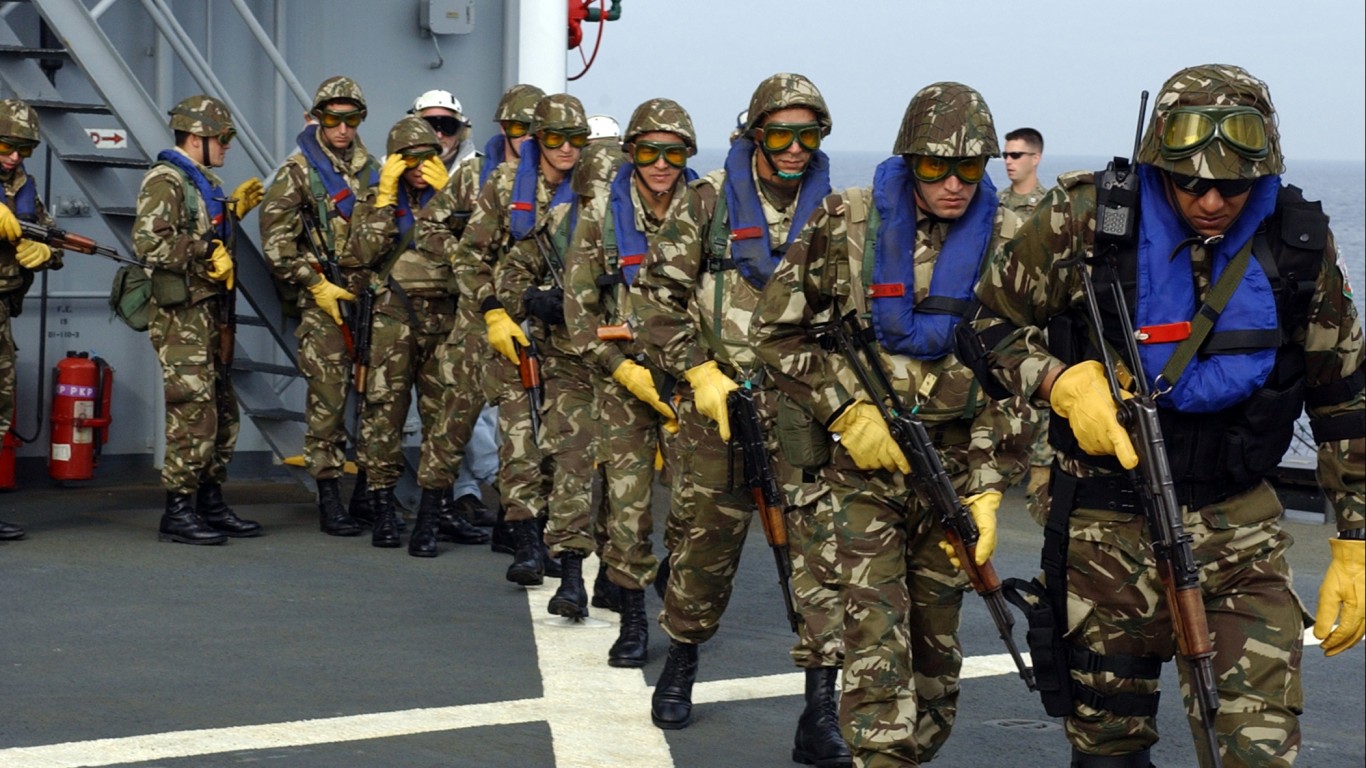
5. Algeria
> Share of global arms imports (2014-18): 4.4%
> Main supplier, share of importer’s total imports: Russia, 66%
> GDP per capita: $13,900
> Armed forces, total personnel (2016): 317,200
[in-text-ad]
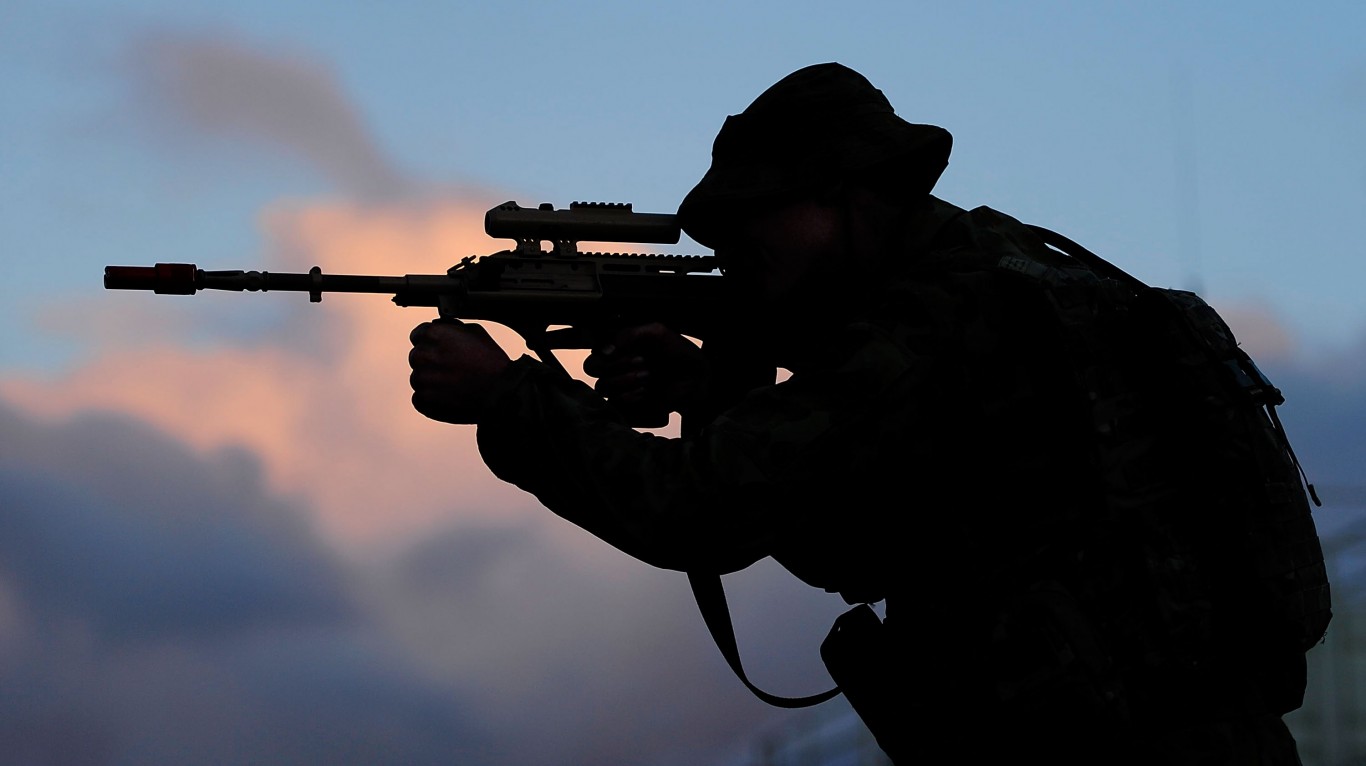
4. Australia
> Share of global arms imports (2014-18): 4.6%
> Main supplier, share of importer’s total imports: USA, 60%
> GDP per capita: $44,649
> Armed forces, total personnel (2016): 57,800
 24/7 Wall St.
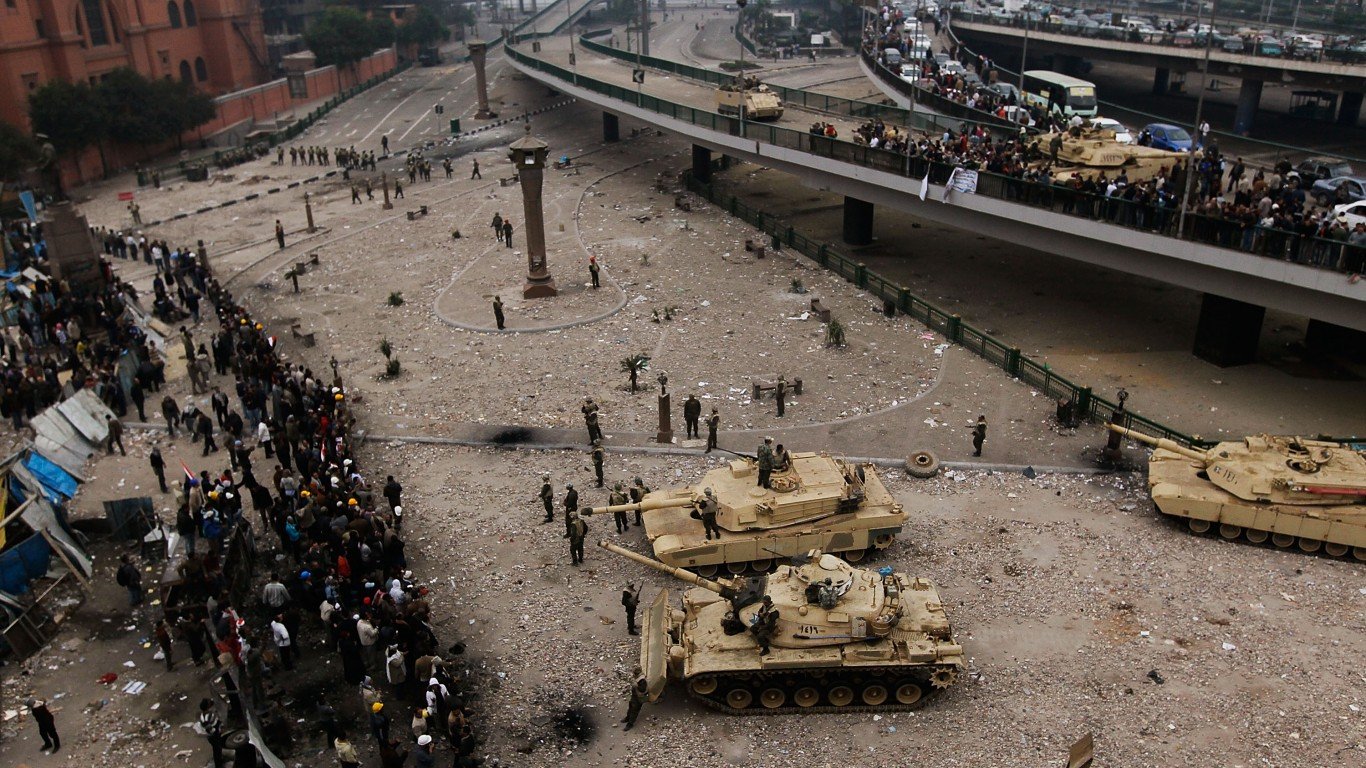
3. Egypt
> Share of global arms imports (2014-18): 5.1%
> Main supplier, share of importer’s total imports: France, 37%
> GDP per capita: $10,551
> Armed forces, total personnel (2016): 835,500

2. India
> Share of global arms imports (2014-18): 9.5%
> Main supplier, share of importer’s total imports: Russia, 58%
> GDP per capita: $6,430
> Armed forces, total personnel (2016): 2,981,050
[in-text-ad-2]

1. Saudi Arabia
> Share of global arms imports (2014-18): 12.0%
> Main supplier, share of importer’s total imports: USA, 68%
> GDP per capita: $48,986
> Armed forces, total personnel (2016): 251,500
Smart Investors Are Quietly Loading Up on These “Dividend Legends” (Sponsored)
If you want your portfolio to pay you cash like clockwork, it’s time to stop blindly following conventional wisdom like relying on Dividend Aristocrats. There’s a better option, and we want to show you. We’re offering a brand-new report on 2 stocks we believe offer the rare combination of a high dividend yield and significant stock appreciation upside. If you’re tired of feeling one step behind in this market, this free report is a must-read for you.
Click here to download your FREE copy of “2 Dividend Legends to Hold Forever” and start improving your portfolio today.