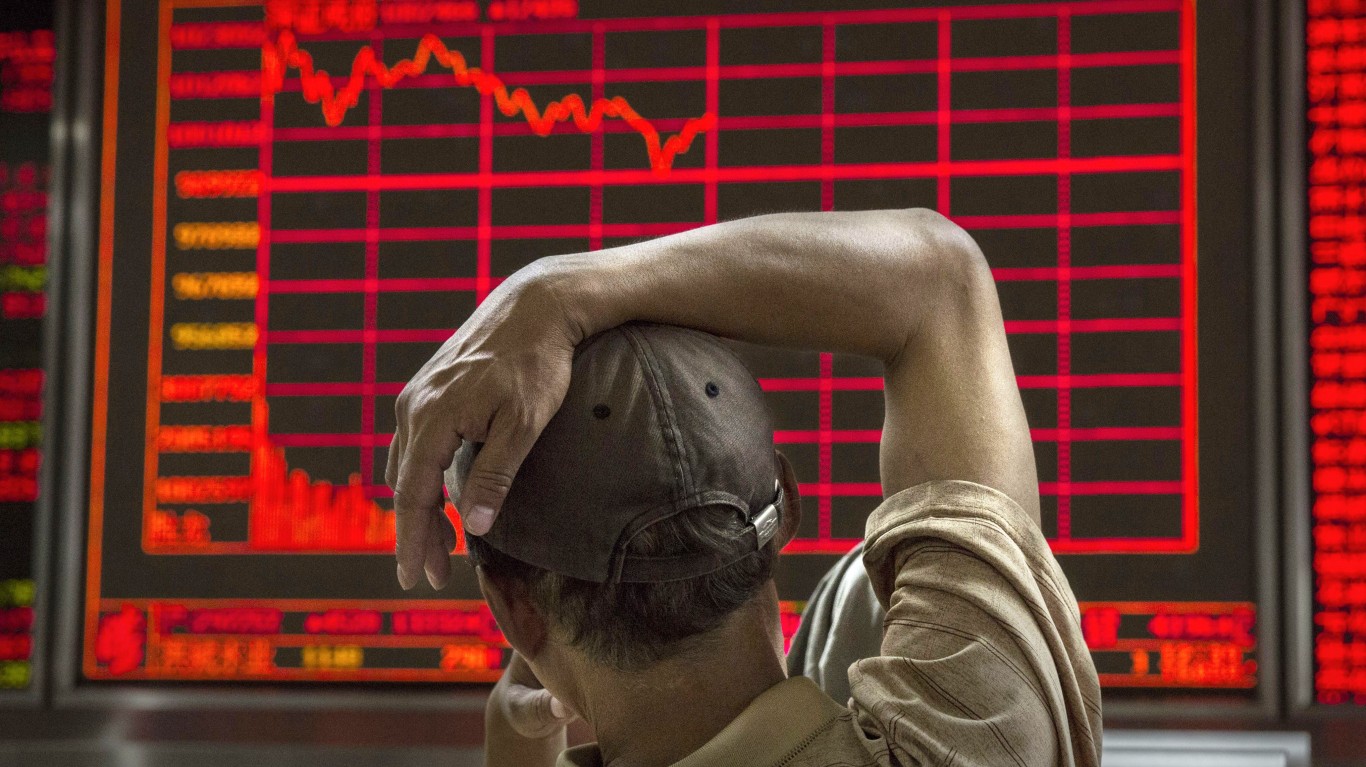
Is $2.2 Trillion in Losses in US Stocks in 2016 the End?
Investors may have felt better after Wednesday’s selling panic was met with a buying frenzy, but there are still many tales of caution that long-term investors and short-term traders alike need to consider. As long as China and oil have…


Investors may have felt better after Wednesday’s selling panic was met with a buying frenzy, but there are still many tales of caution that long-term investors and short-term traders alike need to consider. As long as China and oil have the stock and bond market by the neck, things can be expected to remain more than just volatile. If this is the start of a bear market, let alone a recession, then things in the stock market could get a lot worse before they get better.
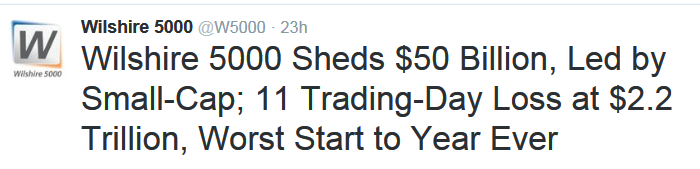
24/7 Wall St. does not want to only dwell on the potential upside here. We also do not want to focus only on the downside. It turns out that the total stock market losses in the United States alone was $2.2 trillion after just 11 trading sessions so far in 2016. That figure came from the Wilshire 5,000 team.
The MSCI All-Country World Index was down about 3% earlier on Wednesday, and it had hit the 20% correction mark. The Dow Jones Industrial Average was down 15% from its peak earlier on Wednesday, when the Dow was down 450 points. A figure from Bloomberg has been thrown around now that some $15 trillion in net value has mysteriously vanished from the value of equities around the globe.
24/7 Wall St. does not think it is prudent to be looking for a technical V-bottom to be formed here. We would welcome it, but we do not really see the case for a V-bottom. By definition, a V-bottom is one of the more violent market reactions, where massive market panic selling is immediately followed by massive buying by speculators, long-term buyers, bottom fishers and short covering.
The Dow Jones Industrial Average’s downside bear target went to 14,961 for a would-be potential floor this week. The reality is that this moving target is based on the most negative price targets on each of the 30 Dow components, and then we average out the downside of all and apply that toward the end of 2015. Using this for a price-weighted index like the Dow makes calling a real floor or real bottom next to impossible. Still, it could start to act as a guide, and that sub-15,000 level is now just a few hundred points lower.
The Dow was down over 560 points at the worst level of Wednesday’s trading session. The unofficial close at 4:00 p.m. Eastern Time was down by 246.74 at 15,769.20. If we are at the start of a real bear market or a real recession, then this was nothing more than a violent bear market rally. If the developed markets manage to just keep slower growth without tipping into recession, then you can expect more sharp rallies from whatever bottom (or bottoms) get hit.
$2.2 trillion is a lot of money to suddenly see vanish from the U.S. stock market alone over any period of time. Now think about it happening in just 11 trading sessions and being worse than the start of 2008. To put $2.2 trillion in perspective, the CIA World Factbook shows that the entire 2014 gross domestic product (GDP) of Mexico was closest figure to that at $2.149 trillion. And as far as a $15 trillion figure, the United States 2014 GDP calculation by the CIA World Factbook was $17.35 trillion.
Stay tuned.
Contact [email protected] for any questions or corrections.
Jon Ogg has been a financial news analyst since 1997. Mr. Ogg set up one of the first audio squawk box services for traders called TTN, which he sold in 2003. He has previously worked as a licensed broker to some of the top U.S. and E.U. financial institutions, managed capital, and has raised private capital at the seed and venture stage. He has lived in Copenhagen, Denmark, as well as New York and Chicago, and he now lives in Houston, Texas. Jon received a Bachelor of Business Administration in finance at University of Houston in 1992. www.247wallst.com.