Home Values are Surging in Rio Linda, California
In the early months of the COVID-19 pandemic, U.S. home sales slumped. Since then, however, the market has come roaring back — and rising demand, in conjunction with a relatively low supply of housing, has caused home values to surge.…

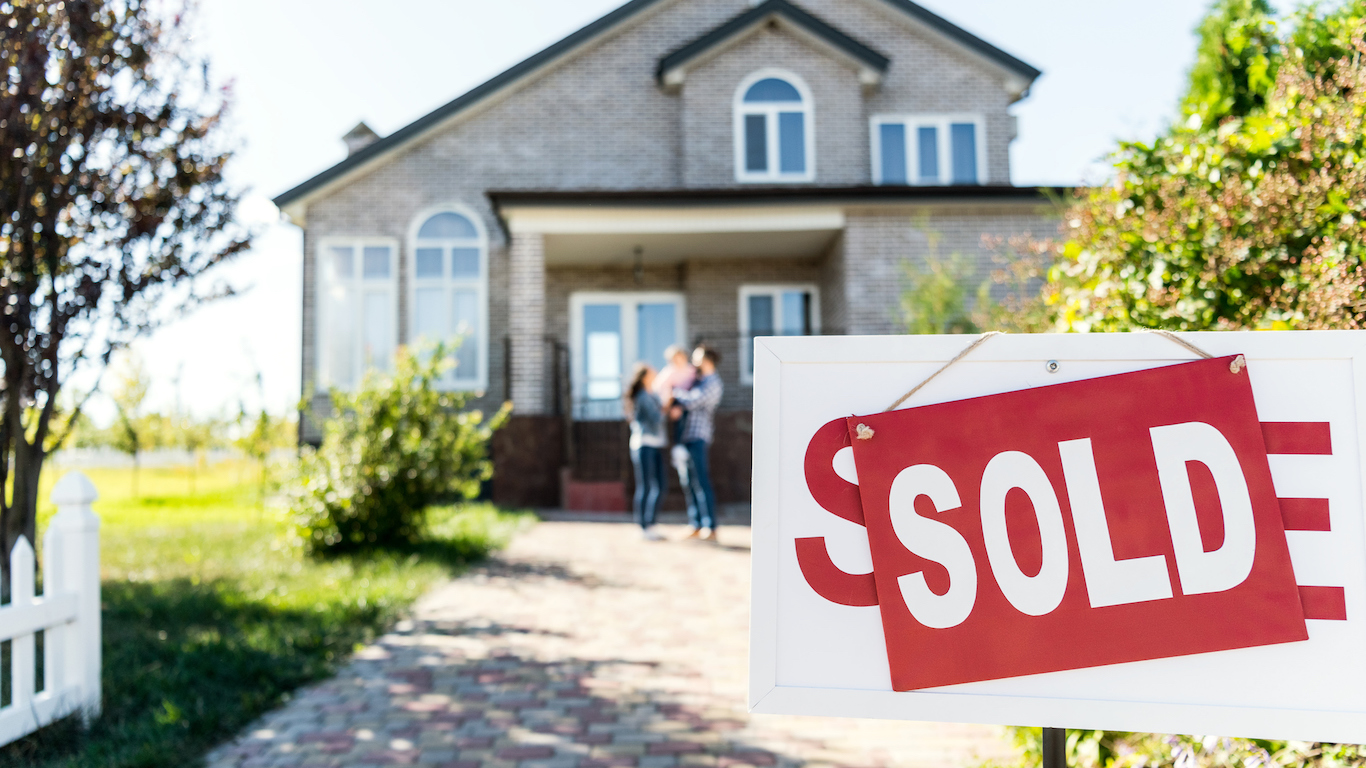
In the early months of the COVID-19 pandemic, U.S. home sales slumped. Since then, however, the market has come roaring back — and rising demand, in conjunction with a relatively low supply of housing, has caused home values to surge.
According to estimates from Zillow, a Seattle-based real estate data company, between March 2020 and March 2021, the typical single-family American home appreciated in value from $250,179 to $276,717, a 10.6% increase. Of course, housing markets also respond more to local forces, and not all parts of the country followed the national pattern.
In Rio Linda, a CDP of about 16,400 residents in California’s Sacramento County, home values are rising even faster than they are nationwide. The typical single family home in Rio Linda was worth $379,277 as of March 2021, 15.9% more than what it was worth one year ago.
One factor that can contribute to rapidly climbing home prices at a local level is demand. And demand for housing is often precipitated by a growing population. According to the most recent available Census data, over the last one-year period, Rio Linda’s population increased by 5.8%.
Nationwide, the typical home value is about 4.4 times higher than the median household income of $62,843. In Rio Linda, housing is generally less affordable. The typical single-family home value is about 5.4 times higher than the local median household income of $70,825.
Here are the 71 communities with populations of at least 10,000 in California where home values climbed the most in the last year.
This is How Much Home You Can Buy For 200K in Every State
| Rank in state | Place | 1-yr. increase in typical home value | Current typical home value ($) | 1-yr. change in median income | Current median household income ($) |
|---|---|---|---|---|---|
| 1 | Truckee | 24.0% | 856,853 | 3.5% | 97,092 |
| 2 | South Lake Tahoe | 23.6% | 557,666 | 1.5% | 49,390 |
| 3 | Twentynine Palms | 21.2% | 188,545 | 6.1% | 44,226 |
| 4 | Big Bear City | 20.7% | 323,418 | 6.2% | 51,875 |
| 5 | Winton | 20.5% | 278,423 | 4.8% | 45,858 |
| 6 | Grass Valley | 20.4% | 497,083 | 5.3% | 37,548 |
| 7 | Santa Paula | 20.4% | 565,100 | 6.3% | 60,468 |
| 8 | Calexico | 19.8% | 288,942 | 6.5% | 43,592 |
| 9 | Placerville | 19.6% | 472,248 | 3.3% | 59,247 |
| 10 | Spring Valley | 19.1% | 597,869 | 4.9% | 72,178 |
| 11 | El Dorado Hills | 18.9% | 772,181 | 4.7% | 137,726 |
| 12 | Diamond Springs | 18.7% | 395,561 | 3.9% | 62,370 |
| 13 | Farmersville | 18.5% | 223,697 | 3.5% | 39,720 |
| 14 | Lemon Grove | 18.4% | 586,480 | 2.5% | 63,548 |
| 15 | Santee | 18.2% | 635,785 | 4.3% | 87,098 |
| 16 | La Mesa | 18.1% | 698,857 | 3.3% | 66,051 |
| 17 | Lakeside | 18.1% | 638,285 | 3.3% | 74,823 |
| 18 | Isla Vista | 17.8% | 1,120,694 | 6.8% | 24,545 |
| 19 | Rodeo | 17.8% | 549,961 | 7.5% | 74,688 |
| 20 | Chula Vista | 17.4% | 651,623 | 6.4% | 81,272 |
| 21 | National City | 17.0% | 534,280 | 2.4% | 47,119 |
| 22 | Barstow | 16.9% | 180,436 | 2.6% | 40,633 |
| 23 | California City | 16.9% | 196,676 | 1.6% | 49,022 |
| 24 | Stockton | 16.8% | 368,007 | 6.4% | 54,614 |
| 25 | Yucca Valley | 16.6% | 277,585 | -1.1% | 44,757 |
| 26 | Lake Elsinore | 16.3% | 447,581 | 5.6% | 71,476 |
| 27 | Pinole | 16.2% | 608,546 | 10.6% | 100,315 |
| 28 | Atwater | 16.2% | 326,458 | 6.0% | 55,674 |
| 29 | Florin | 16.2% | 347,168 | 4.2% | 44,618 |
| 30 | Cathedral City | 16.2% | 383,728 | 0.3% | 46,521 |
| 31 | Exeter | 16.1% | 279,875 | -3.3% | 44,602 |
| 32 | Bloomington | 16.1% | 409,684 | 0.6% | 52,085 |
| 33 | El Centro | 16.1% | 280,491 | 3.0% | 47,864 |
| 34 | El Cajon | 16.0% | 634,033 | 5.2% | 55,309 |
| 35 | La Riviera | 15.9% | 422,136 | 1.4% | 64,518 |
| 36 | Wildomar | 15.9% | 498,103 | 2.3% | 74,991 |
| 37 | Rio Linda | 15.9% | 379,277 | 12.9% | 70,825 |
| 38 | El Sobrante | 15.8% | 679,148 | 4.4% | 120,049 |
| 40 | Hesperia | 15.7% | 342,678 | 0.3% | 53,561 |
| 41 | Victorville | 15.7% | 321,403 | 6.4% | 53,957 |
| 42 | San Bernardino | 15.6% | 371,183 | 6.3% | 45,834 |
| 43 | Manteca | 15.6% | 498,836 | 5.2% | 72,867 |
| 44 | Lathrop | 15.6% | 516,313 | 3.8% | 85,805 |
| 45 | Tracy | 15.6% | 616,555 | 4.1% | 92,046 |
| 46 | San Jacinto | 15.6% | 353,084 | 3.0% | 52,009 |
| 47 | San Anselmo | 15.5% | 1,484,897 | 2.4% | 128,212 |
| 48 | Rosamond | 15.4% | 312,837 | 9.8% | 61,807 |
| 49 | Vista | 15.4% | 652,169 | 9.8% | 72,125 |
| 50 | Murrieta | 15.4% | 525,146 | 6.7% | 90,535 |
| 51 | Ukiah | 15.4% | 456,556 | 5.8% | 49,889 |
| 52 | San Pablo | 15.3% | 525,339 | 8.1% | 53,198 |
| 53 | Muscoy | 15.3% | 357,215 | 11.9% | 46,969 |
| 54 | Rosemont | 15.3% | 409,604 | 7.8% | 69,794 |
| 55 | Lindsay | 15.3% | 236,351 | 1.7% | 31,489 |
| 56 | Desert Hot Springs | 15.2% | 273,706 | -5.1% | 33,046 |
| 57 | Delhi | 15.2% | 320,948 | 9.4% | 63,081 |
| 58 | Phelan | 15.2% | 349,304 | 6.5% | 59,375 |
| 59 | Escondido | 15.2% | 638,874 | 2.8% | 64,038 |
| 60 | Visalia | 15.1% | 292,557 | 5.9% | 62,263 |
| 61 | Rialto | 15.1% | 446,064 | 6.0% | 61,518 |
| 62 | Poway | 15.1% | 872,296 | 2.1% | 107,902 |
| 63 | Fillmore | 15.1% | 542,534 | 13.2% | 76,590 |
| 64 | Bonita | 15.1% | 817,481 | 7.4% | 99,427 |
| 65 | Palm Springs | 15.1% | 490,112 | 6.1% | 53,441 |
| 66 | Grand Terrace | 15.1% | 454,055 | 7.3% | 71,788 |
| 67 | Canyon Lake | 15.0% | 525,332 | 3.5% | 100,682 |
| 68 | Lodi | 15.0% | 433,029 | 8.1% | 58,763 |
| 69 | Merced | 15.0% | 304,844 | 6.1% | 45,232 |
| 70 | Hemet | 15.0% | 327,299 | 1.4% | 39,726 |
| 71 | Menifee | 15.0% | 430,870 | 6.8% | 70,224 |