There was a near 30% surge in homicides in the United States in 2020, the largest one-year increase ever recorded. Homicides increased once again in 2021, but by a smaller, 6% margin. Preliminary data from 2022 suggests that murders may finally be declining.
There are a total of 91 U.S. cities with populations of at least 250,000, an average of 10 homicides per year, or both that have also published 2022 homicide data. Based on early reports from police departments in these cities, homicides are down by about 3% compared to the same period last year.
While these early figures are encouraging, there are still several large American cities where murders have increased in 2022. In Lexington, Kentucky, for example, there have been 29 murders reported from Jan. 1 to August 13, 2022, up from the 24 homicides that were reported in the city over the same period in 2021.
The 20.8% year-over-year increase in homicides in Lexington ranks as the 15th highest of the 91 cities reviewed.
All homicide data used in this story is preliminary and not necessarily indicative of how 2022 will compare to previous years’ homicide data by the time annual homicide data are finalized.
| Rank | City | YoY change in homicides (%) | 2022 murders, YTD | 2021 murders, YTD | YTD range; 2021 & 2022 |
|---|---|---|---|---|---|
| 1 | Virginia Beach, VA | 114.3 | 15 | 7 | Jan. 1 – Aug. 9 |
| 2 | Colorado Springs, CO | 100.0 | 26 | 13 | Jan. 1 – Aug. 14 |
| 3 | Chula Vista, CA | 66.7 | 5 | 3 | Jan. 1 – June 30 |
| 4 | Honolulu, HI | 36.4 | 15 | 11 | Jan. 1 – June 30 |
| 5 | Aurora, CO | 35.3 | 23 | 17 | Jan. 1 – June 30 |
| 6 | Milwaukee, WI | 34.6 | 148 | 110 | Jan. 1 – Aug. 9 |
| 7 | New Orleans, LA | 28.4 | 172 | 134 | Jan. 1 – Aug. 14 |
| 8 | Tulsa, OK | 28.1 | 41 | 32 | Jan. 1 – June 30 |
| 9 | Raleigh, NC | 26.7 | 19 | 15 | Jan. 1 – June 30 |
| 10 | Phoenix, AZ | 25.6 | 113 | 90 | Jan. 1 – June 30 |
| 11 | Birmingham, AL | 23.4 | 79 | 64 | Jan. 1 – Aug. 7 |
| 12 | Denver, CO | 23.3 | 53 | 43 | Jan. 1 – June 30 |
| 13 | Little Rock, AR | 22.5 | 49 | 40 | Jan. 1 – Aug. 8 |
| 14 | Stockton, CA | 21.1 | 23 | 19 | Jan. 1 – June 30 |
| 15 | Lexington, KY | 20.8 | 29 | 24 | Jan. 1 – Aug. 13 |
| 16 | Pittsburgh, PA | 19.4 | 37 | 31 | Jan. 1 – June 30 |
| 17 | San Antonio, TX | 18.2 | 39 | 33 | Jan. 1 – March 31 |
| 18 | Long Beach, CA | 15.8 | 22 | 19 | Jan. 1 – June 30 |
| 19 | San Diego, CA | 15.4 | 30 | 26 | Jan. 1 – June 30 |
| 20 | Tampa, FL | 13.0 | 26 | 23 | Jan. 1 – June 30 |
| 21 | Spokane, WA | 12.5 | 9 | 8 | Jan. 1 – Aug. 13 |
| 22 | Dallas, TX | 12.2 | 147 | 131 | Jan. 1 – Aug. 15 |
| 23 | Baltimore, MD | 9.6 | 218 | 199 | Jan. 1 – Aug. 6 |
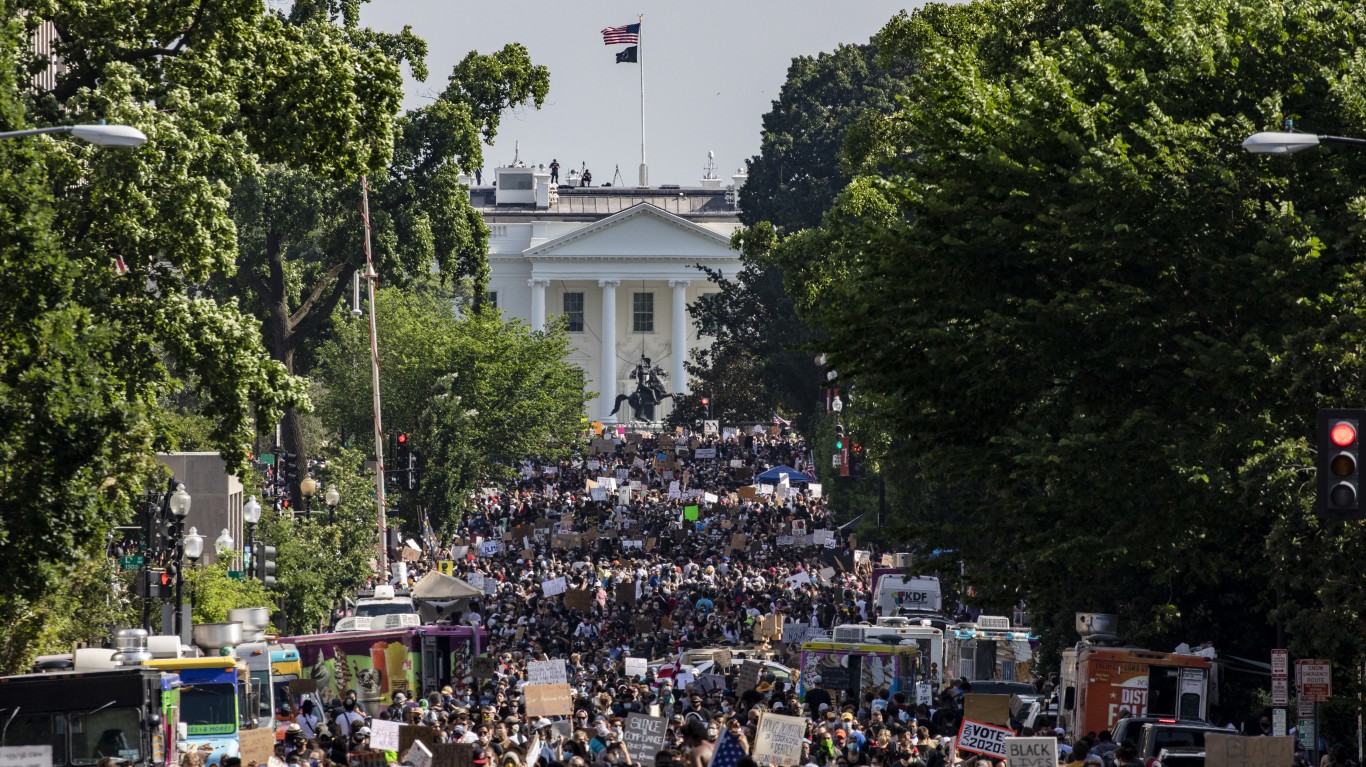
| 24 | Washington, DC | 8.9 | 134 | 123 | Jan. 1 – Aug. 15 |
| 25 | Greensboro, NC | 8.7 | 25 | 23 | Jan. 1 – July 31 |
| 26 | Charlotte, NC | 8.5 | 51 | 47 | Jan. 1 – June 30 |
| 27 | Jacksonville, FL | 6.0 | 71 | 67 | Jan. 1 – Aug. 3 |
| 28 | Atlanta, GA | 5.6 | 95 | 90 | Jan. 1 – Aug. 6 |