

 The U.S. Energy Information Administration (EIA) released its weekly petroleum status report this morning. U.S. commercial crude inventories increased by 1.1 million barrels last week, bringing the total U.S. commercial crude inventory to 377.5 million barrels, still well above the upper limit of the five-year range for this time of the year.
Total gasoline inventories decreased by 1.9 million barrels last week and remain in the upper limit of the five-year average range. Total motor gasoline supplied averaged about 8.5 million barrels a day over the past four weeks — a rise of about 2% compared with the same period a year ago.
Distillate inventories increased by about 600,000 barrels last week, and remain in the lower half of the average range. Distillate product supplied averaged more than 3.7 million barrels a day over the past four weeks, up about 4.4% when compared with the same period last year. Distillate production totaled 4.5 million barrels a day last week, up about 200,000 barrels a day when compared with the prior week.
The American Petroleum Institute reported last week an inventory increase of 904,000 barrels in crude supplies and a decrease of 1.4 million barrels in gasoline supplies. Platts estimated a build of 2.6 million barrels in crude inventories for last week.
Crude prices were about down about 0.5% before the EIA report at $92.37 a barrel and quickly rose to near $93 a barrel following the report. Crude prices are down sharply over the past several days, but gasoline prices continue to climb.
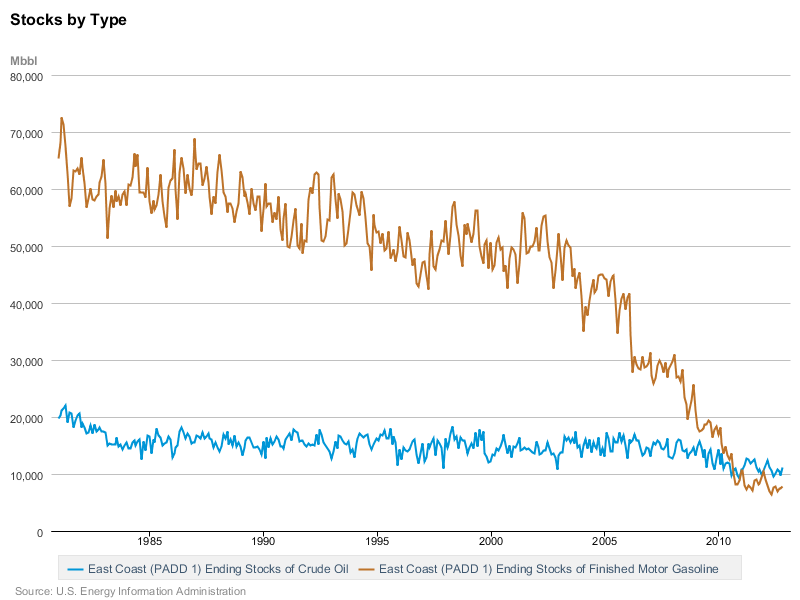
Here’s a chart based on EIA data for the East Coast of the United States that shows the relationship between crude oil stocks and gasoline stocks. For a variety of reasons, it is gasoline inventories, not crude oil inventories that are driving prices higher. While the East Coast gasoline stocks have been the most severely hit, the same general pattern is visible in all other regions of the country, except the Rocky Mountains.
For the past week, crude imports averaged 8 million barrels a day, an increase of about 335,000 barrels a day from the previous week. Refineries were running at 85.1% of capacity, with daily input of 14.5 million barrels a day, about 300,000 barrels a day more than the previous week.
The United States Oil ETF (NYSEMKT: USO) is up about 0.2%, at $33.39 in a 52-week range of $29.02 to $42.30.
The United States Gasoline ETF (NYSEMKT: UGA) is down 0.4%, at $62.92,in a 52-week range of $45.13 to $65.86.
Contact [email protected] for any questions or corrections.


