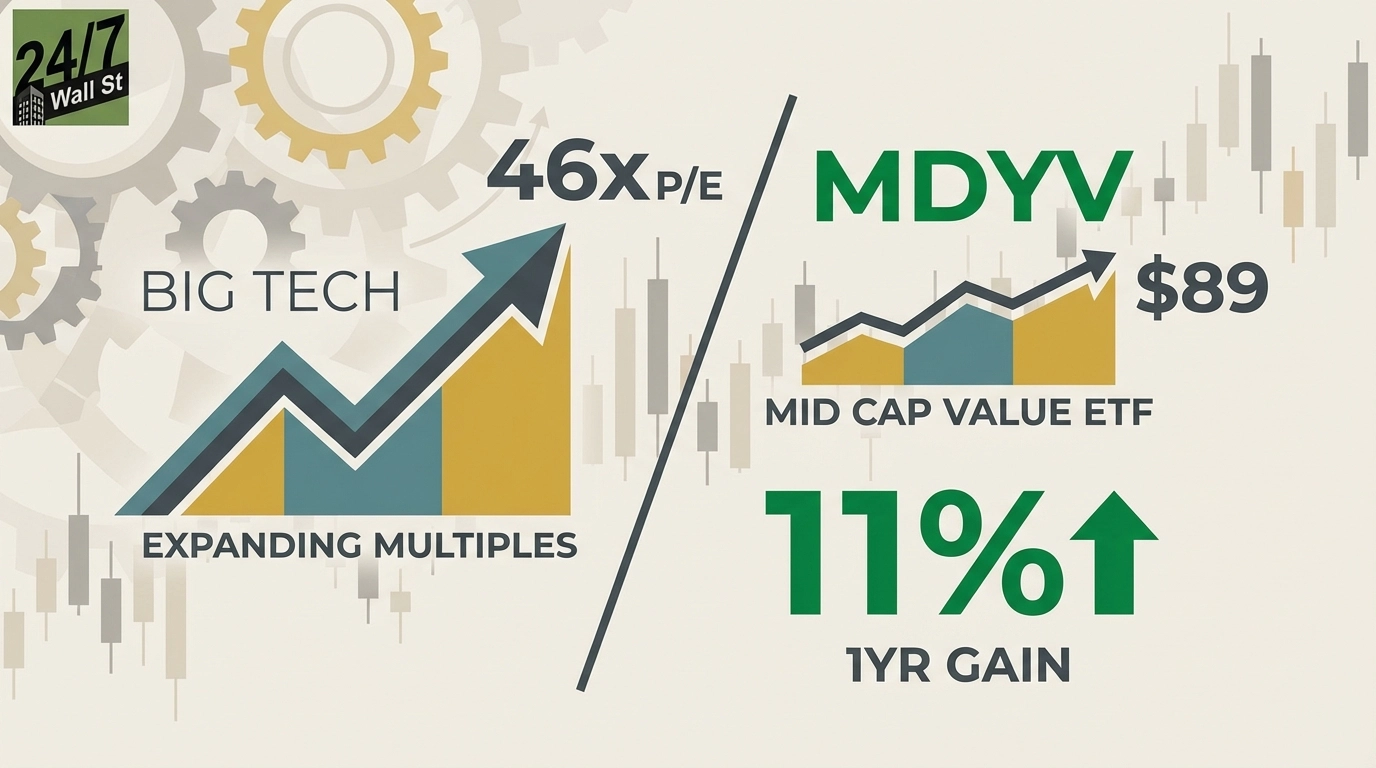
When mega-cap tech stocks trade at valuations that would make even the dot-com era blush, mid-cap value starts looking like a strategic alternative. NVIDIA’s 46x earnings multiple reflects investor enthusiasm for AI dominance, but also creates vulnerability if growth disappoints.
SPDR S&P 400 Mid-Cap Value ETF (NYSEARCA:MDYV) offers exposure to companies trading at much lower multiples, where the bar for positive surprises is considerably lower.
MDYV delivered an 11% gain over the past year, respectable in absolute terms but revealing how mid-cap value has been systematically overlooked. The fund’s 69% five-year return tells the story of a category left behind as investors chased mega-cap tech.
The Nasdaq-100’s 98% return over the same period shows where capital has been flowing, creating a valuation gap that could reverse if market leadership rotates.
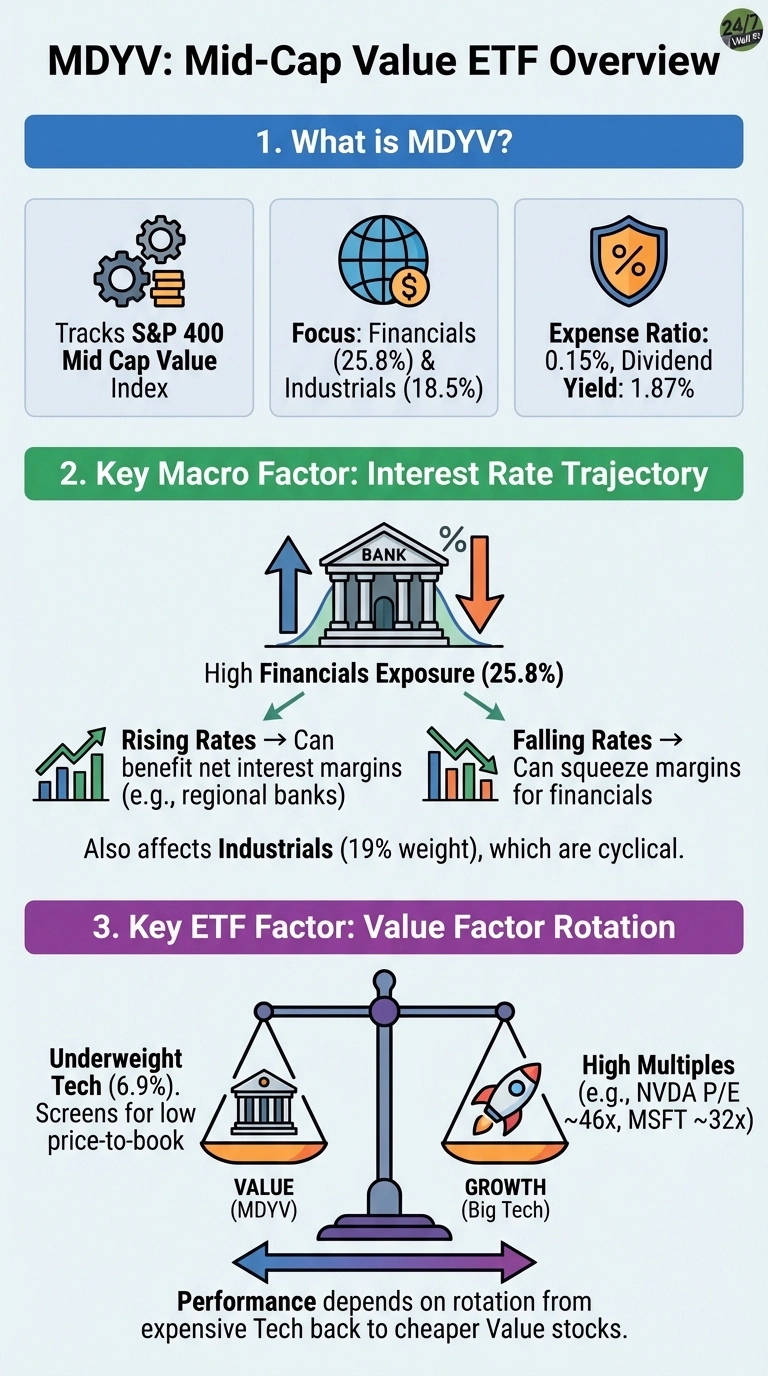
At $89 per share with a 0.15% expense ratio, MDYV provides cost-efficient access to nearly 300 mid-cap companies. The fund’s valuation discount to big tech means these businesses don’t need flawless execution to deliver returns.
Why Interest Rate Direction Matters More Than You Think
The single biggest factor determining MDYV’s performance over the next 12 months is interest rate trajectory. The fund’s 26% allocation to financials means regional banks, mortgage REITs, and insurance companies dominate the portfolio. When rates rise, net interest margins expand and these companies print money. When rates fall, the opposite happens.
The Federal Reserve is navigating a delicate balance between controlling inflation and supporting economic growth. Watch the Fed’s quarterly Summary of Economic Projections for guidance on the terminal rate and pace of any future cuts. If the Fed signals rates staying higher for longer, MDYV’s financial holdings should benefit. If aggressive cuts materialize due to economic weakness, that sector concentration becomes a liability.
The fund’s 19% industrials allocation adds another layer of rate sensitivity. Companies in cyclical sectors like aluminum production, electrical distribution, and homebuilding are businesses that thrive when borrowing costs are manageable and economic activity is robust. Rising rates squeeze their margins and dampen demand.
The Value Factor Itself Is What You’re Really Buying
MDYV’s performance hinges on whether value stocks continue their multi-year underperformance or finally rotate back into favor. The fund tracks the S&P MidCap 400 Value Index, which screens for companies with low price-to-book ratios and other value characteristics.
That methodology kept the fund underweight technology at just 7% of assets, compared to roughly 30% for the S&P 500.
This positioning is both the opportunity and the risk. If investors decide that paying 32x earnings for Microsoft has gotten excessive, capital will flow toward cheaper alternatives. MDYV’s top holdings include companies in food distribution, commercial real estate services, and mortgage REITs, names trading at fractions of big tech multiples. But if the AI narrative continues driving tech valuations higher, MDYV will keep lagging.
Consider VOE for Lower Costs and Broader Diversification
Vanguard Mid-Cap Value ETF (NYSEARCA:VOE) offers a compelling alternative with a 0.07% expense ratio and $33 billion in assets under management.
VOE’s 2.1% dividend yield edges out MDYV’s 1.9%, providing slightly more income for patient investors. The fund’s 19% portfolio turnover compared to MDYV’s 37% suggests less frequent trading, potentially reducing transaction costs that can erode returns over time.
The bottom line: watch the Fed’s rate guidance and monitor whether value stocks begin outperforming growth. Those two factors will determine whether MDYV’s 2026 looks more like its disappointing 2025 or a genuine rotation year.
Contact [email protected] for any questions or corrections.