Two signals are running in opposite directions on Wall Street right now, and both are flashing at maximum intensity. Hedge funds and professional traders are piling into short positions at levels not seen in more than a decade. At the same time, the S&P 500 and the NASDAQ 100 are pressing against all-time highs on optimism that the Trump administration may be nearing a diplomatic breakthrough with Iran.
Those two things don’t often happen together. When the tape is ripping higher, shorts usually get squeezed out, not added to. When professional money piles into bearish bets, prices tend to soften. The current setup, captured in fresh data from The Kobeissi Letter citing FactSet and Goldman Sachs Global Investment Research, deserves a careful look from anyone who owns equities.
What the Positioning Data Actually Shows
Short interest in the median S&P 500 stock now sits at 3% of market cap, which is the highest level since 2012 and double the readings seen during the 2020 pandemic. The most heavily shorted decile of the index sits at 8% of market cap, the highest since 2018. Both readings now exceed the levels reached during the bear market that followed the 2000 dot-com bust.
That said, the “record” framing deserves a caveat. At the depths of the 2008 financial crisis, short interest in the median S&P 500 name reached 4%, still higher than today’s 3%. So this is multi-year high territory rather than a literal all-time peak. The professionals are leaning bearish, but they’re not quite as bearish as they were the last time the wheels came off.
The Iran Deal and the Rally
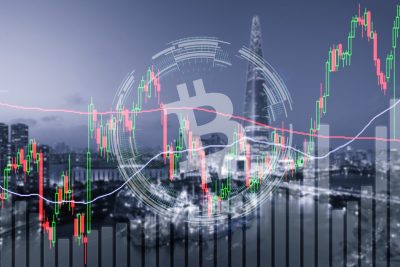
Pushing against that positioning is the geopolitical narrative. The S&P 500 is up 10% year to date, while the NASDAQ 100 has surged 19%, with tech leading a classic risk-on rotation. Traders are pricing in a potential U.S.-Iran de-escalation, a deal that would defuse the geopolitical risk premium baked into oil and broader risk assets.
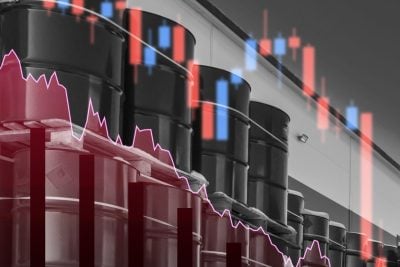
The oil tape reflects exactly that anxiety. WTI crude oil sits at $112.25 per barrel, up 31% in a single month. A diplomatic breakthrough would arguably take a chunk out of that premium overnight. The deal remains unconfirmed, yet the prospect alone is doing the work.
Two Lenses, One Tape
The bearish read is straightforward: sophisticated money is positioning for a decline that retail isn’t seeing, the deal narrative is providing cover for an expensive market, and the underlying data is the warning. Consumer sentiment supports that view, with the University of Michigan reading at 49.8 in April, the lowest in twelve months and well into recessionary territory.
The bullish read flips the same data: elevated shorts are fuel for higher prices. If an Iran agreement gets announced, forced covering could amplify the move higher in a violent squeeze, particularly in the most-shorted decile. The CBOE Volatility Index sits at 17.01, in the complacency zone, suggesting options markets aren’t pricing in much downside despite the bearish positioning.
What to Watch
Prudent investors don’t need to pick a side here to act on this information. The signal worth watching is concrete: any confirmed announcement on the Iran track, the next FactSet short interest update to see whether positioning extends or unwinds, and whether the 10-year Treasury yield (currently 5%, near a 12-month high) keeps pressuring valuations.
The honest read is that nobody knows which interpretation wins. Still, the rally is more fragile than the price action suggests, and position sizing should reflect that tension rather than unchecked enthusiasm.
Contact [email protected] for any questions or corrections.