
My order history shows another buy on Realty Income (NYSE:O | O Price Prediction | O Price Prediction) last month, and I already know the next paycheck will fund another one. I keep coming back to this stock because it pays me every single month, raises that payment on a schedule I can almost set my watch to, and treats the monthly dividend as the actual product.
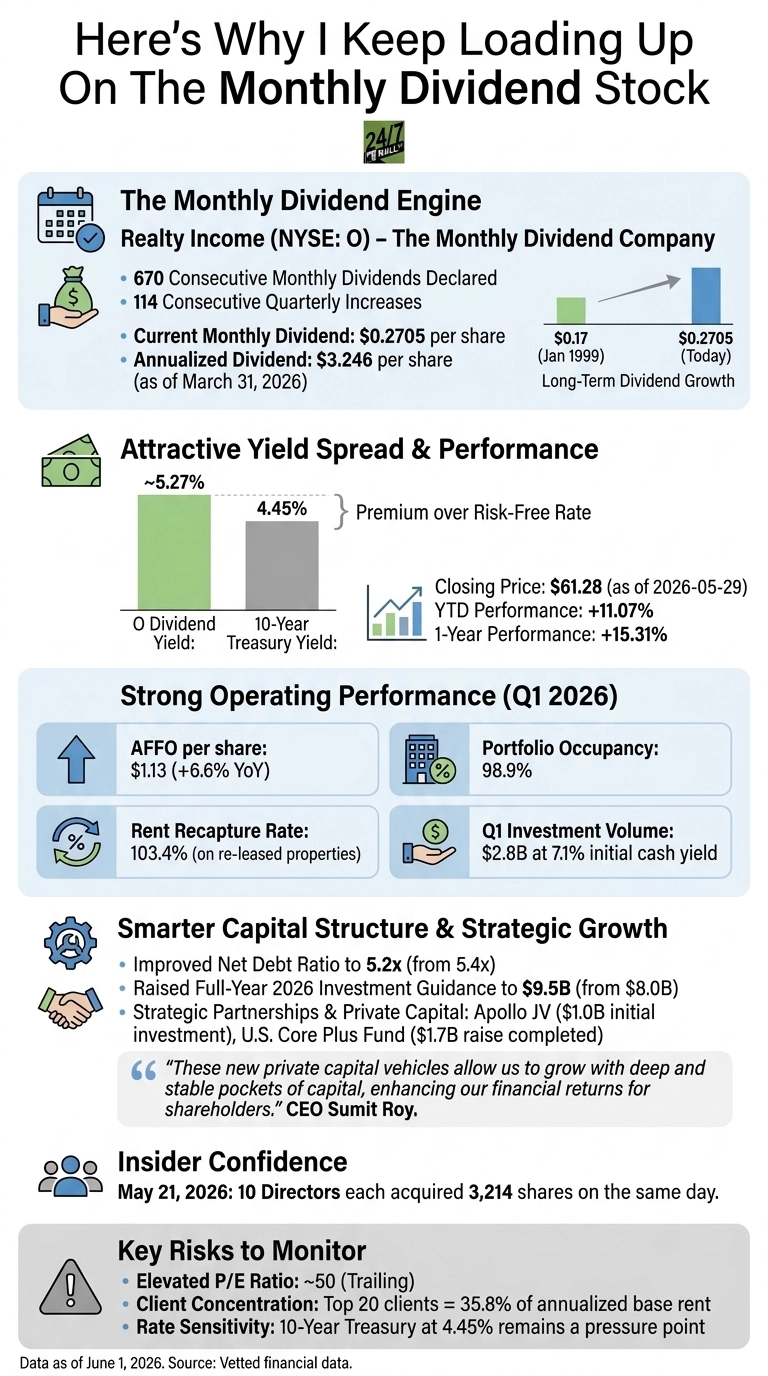
The pitch I make to myself is simple. I own a slice of a global landlord collecting rent from single-tenant commercial properties, sending a check on the 15th of every month. The company has now done that for 673 consecutive months. That cadence matches how bills arrive in retirement. Monthly cash in the account is the entire reason I started this position, and it is why I keep adding to it.
A reliable yield
The first data point that keeps the buy button warm is the spread. Shares closed at $61.28 carrying a dividend yield around 5.27%, against a 10-year Treasury that now sits near 4.54%. That remains a meaningful premium over the risk-free rate, even as the long end has crept higher since spring on renewed inflation concerns.
That spread is earned by a company that has lifted the dividend 115 consecutive quarters and pushed the monthly check from $0.17 in January 1999 to $0.2710 today. The stock is also up 11.07% year to date and 15.31% over the trailing year, so the income has not come at the cost of capital.
Impressive fundamentals
The operating engine is also expanding. In Q1 2026, AFFO per share landed at $1.13, up 6.6% year over year. The portfolio is 98.9% occupied, and CEO Sumit Roy is recapturing 103.4% of prior rent on re-leased space across more than 15,500 properties.
The company invested $2.8 billion at a 7.1% initial weighted average cash yield in the quarter and lifted full-year investment guidance to $9.5 billion from $8 billion. AFFO guidance moved to $4.41 to $4.44 per share. A landlord deploying capital at yields comfortably above its cost of debt, with higher full-year guidance to match, is the setup income investors want.

Several funding lanes
The capital structure keeps getting smarter, and new funding vehicles keep multiplying. Net Debt to Annualized Pro Forma Adjusted EBITDAre improved to 5.2x from 5.4x. Roy also stood up a $1 billion joint venture with Apollo across 492 retail properties, closed a $1.7 billion cornerstone raise for the U.S. Core Plus Fund, and grew third-party private capital AUM to $3.1 billion.
Then came the headline from June 30, 2026: Realty Income formed a programmatic joint venture with Cloud Capital and a global institutional investor to acquire hyperscale data centers in Northern Virginia. The three-asset portfolio is valued at over $6 billion and is fully leased or pre-leased to investment-grade hyperscale tenants under triple-net leases ranging from 15 to 20 years. Realty Income plans to invest up to $1.4 billion for a 45% equity stake, with an initial commitment of roughly $700 million expected between Q2 and Q3 2026. The move signals that Roy is diversifying beyond traditional retail into digital infrastructure, adding a durable new capital lane to support the dividend.
As Roy put it, “Today’s announcement affirms the strength of our business model and its ability to translate across sectors, including digital infrastructure.” The dividend now has more funding lanes behind it than at any point in the company’s history.
The risks I respect are concentration and rate sensitivity. The trailing P/E sits near 50, the top 20 clients represent 35.8% of annualized base rent, and full-year 2025 impairment provisions reached $471.3 million. A 10-year Treasury at 4.54% keeps relative-yield pressure on every REIT in the sector.
I sit with that risk because the company is still acquiring real estate at a 7.1% cash yield, the portfolio is 98.9% leased, and the dividend has compounded through 2008, 2020, and every rate cycle since the NYSE listing. One more receipt for the file: on May 21, 2026, ten directors each acquired 3,214 shares on the same day. The people who see the rent rolls first are aligning their own capital alongside mine. I will keep clicking buy as long as that check shows up on the 15th.

Editor’s note: This article has been updated to reflect Realty Income’s 135th dividend increase (monthly payment now $0.2710 per share), the streak advancing to 673 consecutive monthly dividends and 115 consecutive quarterly raises, the 10-year Treasury yield rising to approximately 4.54%, and the June 30, 2026 announcement of a programmatic joint venture with Cloud Capital to invest up to $1.4 billion in a Northern Virginia hyperscale data center portfolio valued at over $6 billion.
Contact [email protected] for any questions or corrections.