Scott Bessent’s Surprise Bond Buyback Sparks a Silver Rally. Is It Too Late to Buy In?
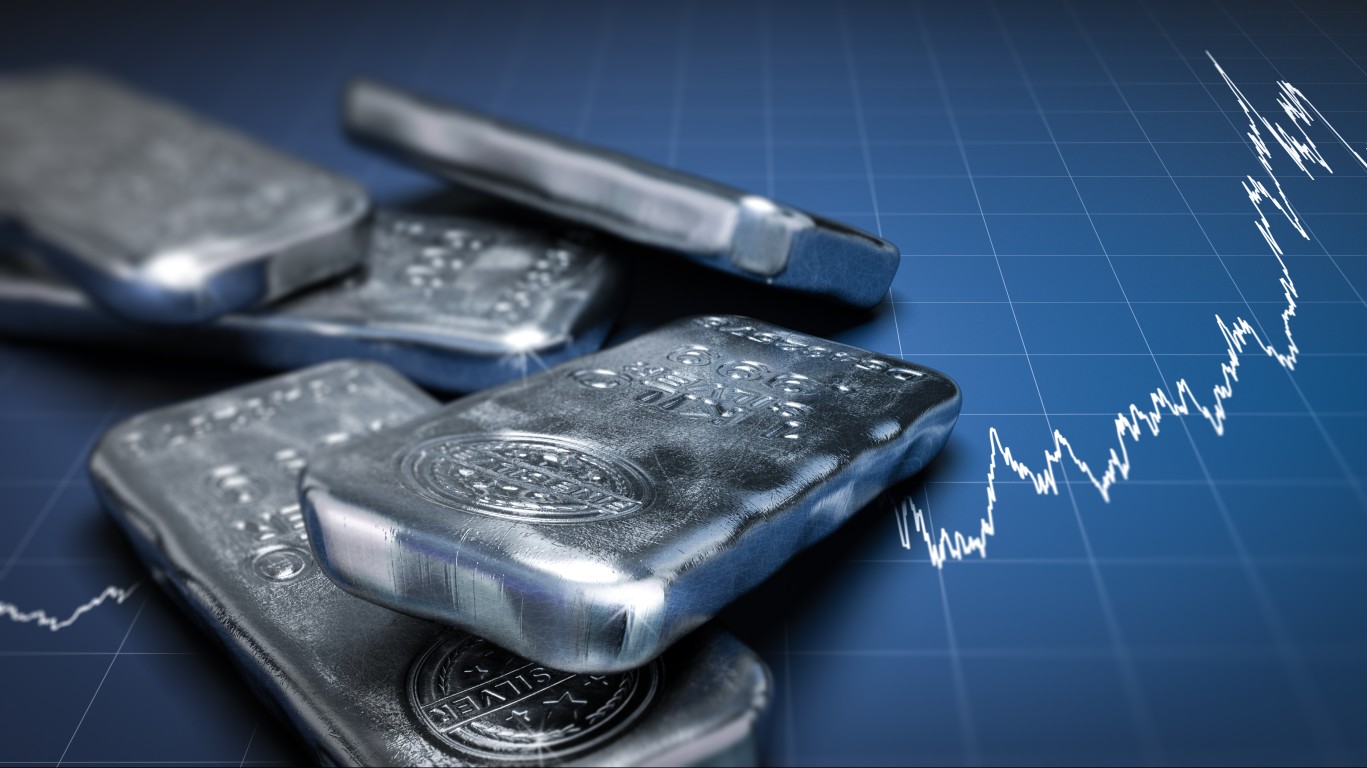
Scott Bessent just made a move in the bond market that sent silver surging past gold in a single session, and the reason it worked reveals something important about where precious metals are actually headed.


The bond market has been sending distress signals for months. With public debt surpassing $40 trillion and the 30-year Treasury yield touching levels last seen in 2007, Washington has had a buyer’s strike problem on its hands. Long-dated debt kept cheapening as investors demanded more compensation for holding it, and that selloff was starting to ripple into everything from mortgage rates to gold.
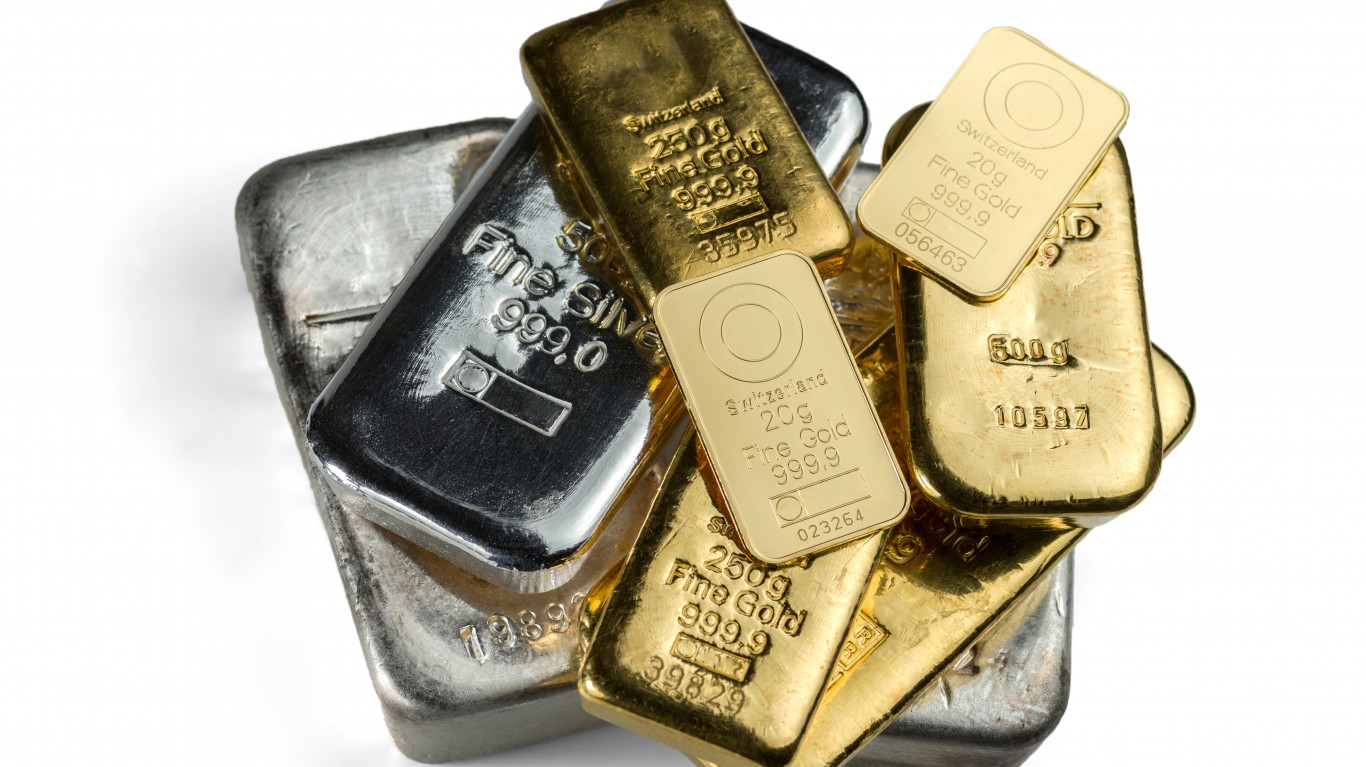
Then, yesterday, Treasury Secretary Scott Bessent stepped in — and precious metals investors got the kind of gift that doesn’t show up twice a year. Gold jumped as much as 4.3%, touching $4,525 an ounce. But silver stole the show, climbing between 5% and 6.4% to trade near $68. For anyone who’s been circling silver and waiting for a catalyst, this was it.
What Treasury Actually Did
Bessent’s department announced it is doubling the maximum size of its liquidity-support buyback operations in the 10- to 20-year and 20- to 30-year sectors, from $2 billion to at least $4 billion per operation. The change takes effect Sept. 9, and runs through Nov. 4, the end of the current quarterly refunding period.
Treasury framed it plainly, citing “greater liquidity support in longer-dated nominal sectors where there is consistent strong sponsorship from market participants.” Translation: dealers keep showing up with quality offers, so Treasury is buying more of the older, off-the-run bonds clogging the long end.
The market reaction was immediate. The 30-year yield fell 8 to 10 basis points on the news. That’s a modest move in isolation, but modest moves in the right direction, at the right moment, can crack open a rally in assets that had been fighting a rising-yield headwind all year.
Why Silver Outran Gold
Gold and silver pay no interest, so falling yields lower the opportunity cost of holding them instead of bonds. Treasury’s buybacks targeted the exact stretch of the curve that had been under the most pressure, and that eased term premia across the board. The dollar weakened alongside it, making dollar-priced metals cheaper for buyers overseas.
Silver carries a second engine gold doesn’t have: industrial demand. It’s used in solar panels, electronics, and a growing list of green-tech applications, which gives it a higher beta to risk-on conditions. When yields ease and equities firm at the same time — which is exactly what happened heading into today — silver typically outpaces gold. Gold is around $4,500 today, while silver sits just under $68.
Sizing the Move — And the Risk
Granted, the scale here doesn’t match the market reaction. Even at $4 billion per operation, the additional buybacks through November amount to low-to-mid tens of billions of dollars — a rounding error against a Treasury market north of $28 trillion.
| Figure | Amount |
| Treasury market size | $28 trillion+ |
| Buyback increase per operation | $2 billion to $4 billion |
| Total incremental buybacks (through Nov. 4) | Low-to-mid tens of billions |
| 30-year yield move | -8 to -10 bps |
| Gold move | +3.5% to +4.3% |
| Silver move | +5% to +6.4% |
This is debt management, not quantitative easing — Treasury is rearranging its own liabilities, not printing new base money. The rally’s size reflects a narrative reaction as much as mechanics: markets read official concern about disorderly long-end trading as validation of the fiscal-debasement thesis that’s already been pulling capital into hard assets.
That’s the risk, too. Silver’s volatility cuts both ways. Stronger economic data, a hawkish Fed signal, or a snapback in yields could unwind these gains quickly, and industrial softness would hit silver harder than gold given its manufacturing exposure.
Key Takeaway
In short, this wasn’t a game-changer — it was a headwind removed. Treasury’s buyback expansion eased the exact pressure that had been capping precious metals, and silver’s dual identity as both a monetary hedge and an industrial metal let it run further than gold. Sustained strength from here depends on real yields staying soft, the dollar staying weak, and industrial demand holding up — not on the buyback program alone.
Sharp investors should watch the 10- and 30-year yields, the dollar index, and actual buyback results once operations begin September 9. The setup favors silver bulls, but this is a trend to confirm, not chase blindly.
Contact [email protected] for any questions or corrections.
After two decades of patrolling the dark corners of suburbia as a police officer, Rich Duprey hung up his badge and gun to begin writing full time about stocks and investing. For the past 20 years, he’s been cruising the markets looking for companies to lock up as long-term holdings in a portfolio while writing extensively on the broad sectors of consumer goods, technology, and industrials. Because his experience isn’t from the typical financial analyst track, Rich is able to break down complex topics into understandable and useful action points for the average investor. His writings have appeared on The Motley Fool, InvestorPlace, Yahoo! Finance, Money Morning, and, of course, 24/7 Wall St. He has been featured in both U.S. and international publications, including MarketWatch, Financial Times, Forbes, Fast Company, and USA Today.