The Tax Math That Makes These High-Yield Dividend Stocks Worth Much More Annually Inside a Roth
Every dividend dollar sitting in a taxable account quietly hands a portion of itself to the IRS year after year, and after two decades that quiet cost compounds into a number most investors never bother to calculate until it is…


A $250,000 dividend portfolio throwing off about $8,471 a year loses roughly $2,033 to the IRS annually if that income is taxed at the 24% ordinary rate. The full amount stays in the account within a Roth IRA.
Qualified Versus Ordinary Dividends Set the Size of the Gap
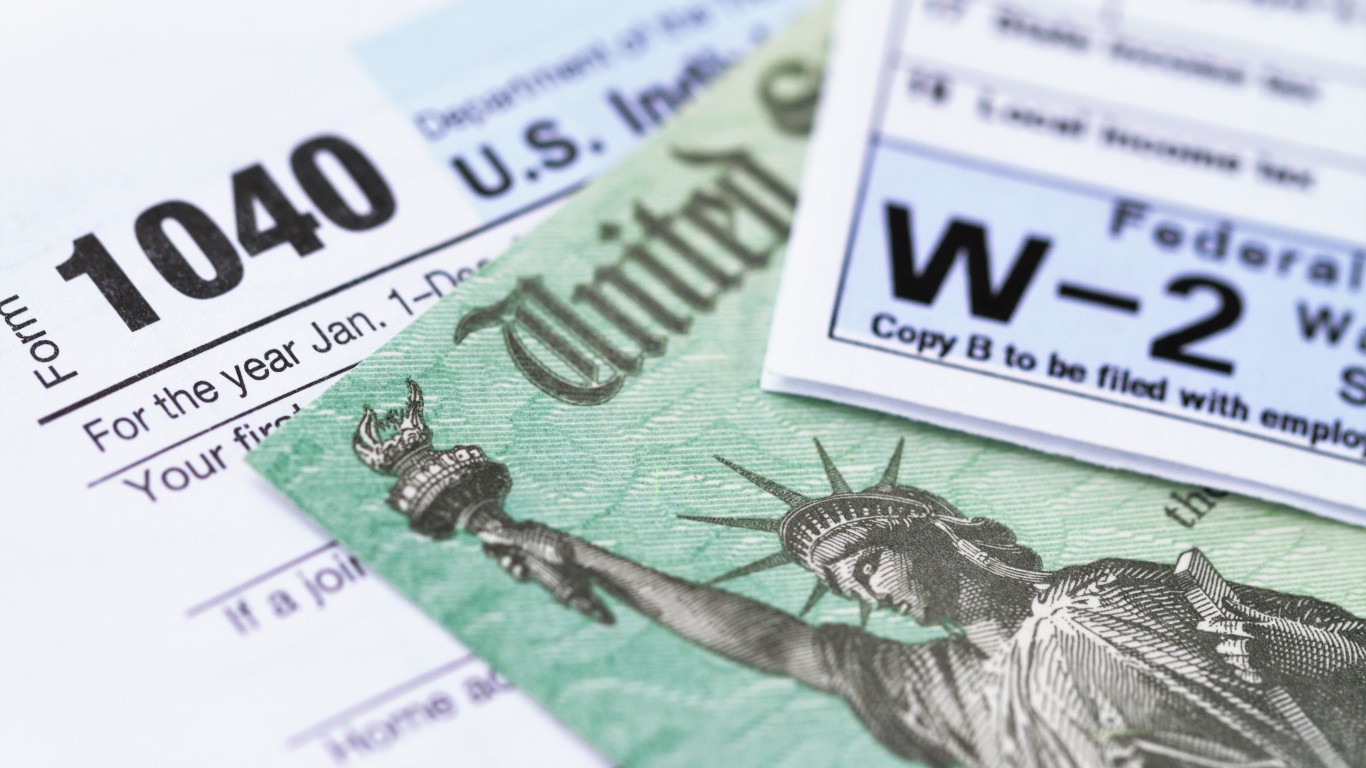
For tax year 2026, the 24% bracket covers income over $105,700 ($211,400 for married couples filing jointly) for single filers. Ordinary dividends, including most BDC and REIT payouts, face that rate. Qualified dividends face a maximum rate of 0%, 15%, or 20%, but only if you held the shares more than 60 days during the 121-day period around the ex-dividend date. Neither schedule applies in a Roth, because qualified withdrawals come out untaxed.
All six stocks below are C-corporations whose dividends generally qualify, so a 24% filer meeting the holding period realistically pays 15%. The ordinary-rate column shows what the same income costs when the holding period is missed, or what a BDC or mortgage REIT of equal yield would cost.
Six Dividend Payers, $250,000 Split Evenly
Each position is about $41,667.
- T. Rowe Price (NASDAQ:TROW | TROW Price Prediction): 4.96% yield, about $2,067 a year. The quarterly payout rose from $1.27 to $1.30 this year, so the dollars shielded grow with every raise.
- ONEOK (NYSE:OKE): 4.82%, about $2,008. Its quarterly dividend rose 4% to $1.07 in January, supported by ~90% fee-based earnings.
- Kinder Morgan (NYSE:KMI): 3.67%, about $1,529. Executive Chairman Rich Kinder said the company can fund projects internally “while still continuing to pay a solid and growing dividend.”
- IBM (NYSE:IBM): 3.04%, about $1,267. A payer every year since 1916, it fits a multi-decade Roth holding period.
- Amgen (NASDAQ:AMGN): 2.43%, about $1,012. The $2.52 quarterly dividend is up 6% year over year, and faster growth means a larger future tax bill to avoid.
- Cisco Systems (NASDAQ:CSCO): 1.41%, about $588. The smallest dollar benefit here and the weakest claim on scarce Roth space.
Dollars Kept: Roth Versus Taxable at 24%
| Roth IRA | Taxable, 15% Qualified | Taxable, 24% Ordinary | |
|---|---|---|---|
| Gross income | $8,471 | $8,471 | $8,471 |
| Tax cost | $0 | $1,271 | $2,033 |
| Net income | $8,471 | $7,200 | $6,438 |
| 10-year Roth advantage | n/a | $12,706 | $20,330 |
Higher Brackets Raise the Cost of Waiting
Here is the same $8,471 subject to ordinary income rates across brackets:
| Bracket | Annual Tax (Roth Advantage) | Taxable Net |
|---|---|---|
| 22% | $1,864 | $6,607 |
| 24% | $2,033 | $6,438 |
| 32% | $2,711 | $5,760 |
| 37% | $3,134 | $5,337 |
On the qualified track, the advantage is $1,271 at the 15% rate and $1,694 at the 20% rate that applies to the highest incomes.
Compounding Turns the Annual Gap Into a Permanent One
Reinvest the yearly Roth advantage at a conservative 4%, with no price appreciation assumed. At the 24% ordinary rate, the tax-free dollars reach about $24,408 after 10 years and $60,539 after 20. On the 15% qualified track, the figures are $15,255 and $37,837. You for good give up that income by holding these positions in a taxable account.
Roth space is somewhat limited. Contributions are capped, and for 2026 eligibility phases out between $153,000 and $168,000 of modified AGI for individuals and $242,000 and $252,000 for joint filers. The real decision is which assets get those limited dollars.
What to Do Before Your Next Filing
- Pull last year’s Form 1099-DIV and compare box 1a (ordinary) with box 1b (qualified). Any gap is income taxed at your full bracket and the first candidate for Roth location.
- Order your taxable holdings by dollars of tax per year, not by yield. In this group, T. Rowe Price and ONEOK generate the most income per dollar invested, while Cisco generates the least.
- Before ruling out a Roth conversion, compare the tax hit from converting a position with the 10- and 20-year figures above for that same position at your bracket.
Contact [email protected] for any questions or corrections.
Chris Lange is a financial and geopolitical writer with more than a decade of experience covering a myriad of topics. He has published thousands of articles for 24/7 Wall St., with past coverage focused heavily on stocks, IPOs, healthcare, defense, global affairs, and technology.
His work has been quoted, or referenced by a number of outlets including Business Insider, USA Today, Yahoo Finance, MSN, The Motley Fool, and many other publications. A graduate of Southwestern University, he studied business with a focus on investments and has previous experience in banking and startups.
When not reading or writing the news, he is following his passion for Lacrosse, playing chess, or building solar projects with his dad.