After Hot CPI, Hot PPI: Producer Prices Rose the Most Since 2022
Two back-to-back inflation reports landed this week, and producer prices did something they have not done since early 2022. Whether stocks are right to shrug it off depends on what happens in one specific corner of the data.

Producer prices for gasoline rose 20.3% in September. That one line explains most of the producer price report the Bureau of Labor Statistics released on October 15, 2026, one day after a hot consumer price report.
The Producer Price Index for final demand measures what businesses receive for their goods and services. It rose 1.3% in September, after 0.5% in August and 0.2% in July. Economists expected 0.6%, so the actual gain was more than double the forecast.
Markets respond to surprises more than to levels, because expected inflation is already in stock prices. September brought the largest monthly advance since a 1.7% jump in March 2022. Before seasonal adjustment, prices rose 6.3% over 12 months, compared with an expected 5.4%. That was the biggest 12-month gain since 6.4% in December 2022.
Consumer prices had already risen 3.7% over the past 12 months. Even so, the State Street SPDR S&P 500 ETF Trust (NYSEARCA:SPY) rose 0.28% on October 15 and closed at $771.79. That leaves it up 13.18% year to date.
Energy Drove the Jump, but Core Prices Rose Too
Final demand energy accounted for over 80% of the September rise after jumping 10.8%. Gasoline alone made up half of the increase in goods prices.
Final demand goods rose 2.6%, the largest increase since the series began in December 2009. Services rose 0.8%, a smaller gain but still a firm one.
Prices less food, energy and trade services rose 0.5% for the month and 5.0% over 12 months. Price pressure has spread beyond oil and gasoline.
How Producer Costs Reach Your Portfolio
Producer costs feed into consumer prices with a lag. Two hot reports in two days make it more likely consumer inflation will remain high, and rising living costs hurt retirees with fixed incomes most.
SPY holds the whole S&P 500, so the effect runs through profit margins and interest rates. Companies that cannot pass higher input costs on to customers absorb them. Energy producers and businesses with pricing power hold up better.
The Fed raised its target ceiling to 4.00% from 3.75% in mid-September, and the 10-year Treasury yield stood at 5.19% on October 14. Higher inflation raises the risk of tighter policy, and tighter policy lowers what investors will pay for each dollar of earnings.
Why Stocks Looked Past It, and Where That Could Fail
Energy shocks tend to reverse. WTI crude, the US oil benchmark, hit $103.62 a barrel on September 16, fell to $85.23 on September 25 and was back at $101.91 on October 14.
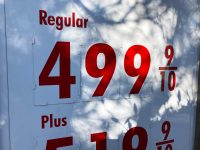
Retail gasoline eased to $4.33 a gallon on October 12, down from a $4.478 peak on September 21. Buyers may be viewing September as a fuel spike that has already peaked.
Oil, however, cannot explain the 5.0% core rate. The VIX, which measures how much traders expect stocks to swing, rose to 16.87 on October 14. That is still a moderate reading, so investors are cool, but less calm than they were.
What Could Change the Outlook for SPY Before the Next Report
The longer-term case for SPY looks solid. Energy produced most of the surprise, and SPY has gained 13.18% this year even with a rate increase already in place.
Inflation has been rising for three straight months, though, and that adds near-term risk. Prices could swing hard around the next data release.
The test comes with the next producer price report on Friday, November 13. If food, energy, and trade services prices rise 0.5% or more again, the case that this was an energy shock weakens, and so does the case that current prices already reflect inflation risk.
Contact [email protected] for any questions or corrections.
Omor Ibne Ehsan is a writer at 24/7 Wall St. He is a self-taught investor with a focus on growth, cyclical, and dividend equities that have strong fundamentals, value, and long-term potential. He also has an interest in high-risk, high-reward investments such as penny stocks.