TNA’s 117% One-Year Surge Masks a Brutal Truth: Volatility Decay Cost Holders 10.88% Over Five Years as the Russell 2000 Climbed
TNA has handed short-term traders a spectacular ride, but the five-year chart tells a story that most leveraged ETF investors never stick around long enough to read.

This post may contain links from our sponsors and affiliates, and Flywheel Publishing may receive compensation for actions taken through them.

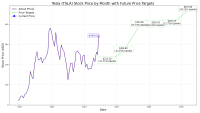
Small-cap bulls are having their moment, and one leveraged fund has turned that moment into a spectacle. Direxion Daily Small Cap Bull 3X Shares (NYSEARCA:TNA) is up 64.9% year to date and 117.07% over the past year through Tuesday’s close. Zoom out to five years, however, and the same fund is down 10.88%, while the Russell 2000 it triples every day is up 35.89%. That single split screen is the entire leveraged-ETF story in one ticker.
What TNA Actually Does
TNA is Direxion’s flagship small-cap bull fund, engineered to deliver 300% of the daily return of the Russell 2000 Index. The fund holds iShares Russell 2000 ETF (NYSEARCA:IWM) shares worth about $1.05 billion (roughly 70% of net assets) alongside a stack of total return swaps and cash equivalents that produce the extra 2x of exposure. Net assets sat at $1.50 billion as of April 30, 2026, making it one of the largest leveraged equity ETFs in the U.S.
Like every daily-reset product, TNA is designed for short-term trading. Hold it through a choppy month and returns can diverge sharply from three times the index, in either direction.
The One-Year Payoff
From August 4, 2025 through August 4, 2026, TNA climbed from $34.54 to $74.97. Over the same window, IWM went from $219.73 to $301.71, a 37.31% gain. A perfect 3x fund would have delivered roughly 112%; TNA delivered 117%. That is what leveraged ETFs look like when the underlying trends steadily in one direction and volatility stays contained.
The backdrop helped. The VIX closed at 16.50 on August 4, 2026, inside what the Cboe considers a normal range, and has averaged 18.13 over the trailing 12 months. Low realized volatility is exactly the environment where the compounding math of a 3x fund works in a holder’s favor.
The Five-Year Trap
Stretch the window and the picture inverts. A $10,000 investment in IWM on August 5, 2021 would be worth roughly $13,589 today. The same $10,000 in TNA, purchased at $84.12 that day, would be worth about $8,912. Three times the daily exposure produced a five-year loss while the underlying gained more than a third.
The culprit is volatility decay. When a leveraged fund resets each day, a down day of 5% requires a bigger up day than 5% to recover, and the effect compounds. The Russell 2000 spent much of 2022 and again during the March 27, 2026 volatility spike, when the VIX peaked at 31.05, oscillating rather than trending. Choppy markets are where 3x funds bleed.
A Quick Side-by-Side
| Window | TNA | IWM (Russell 2000) |
|---|---|---|
| 1 week | +8.23% | +2.84% |
| Year to date | +64.9% | +22.57% |
| 1 year | +117.07% | +37.31% |
| 5 years | -10.88% | +35.89% |
| 10 years | +105.79% | +146.7% |
Notice the 10-year row: even over a decade in which small caps roughly doubled, TNA came in below the unlevered index. Time in a leveraged fund is not the friend it is elsewhere.
The Turn: Why Traders Use It Anyway
The fund is doing exactly what it says on the label: 300% of one day’s move, reset the next morning. Active traders use TNA to express short-horizon views on the Russell 2000, often around Federal Reserve meetings, tariff headlines, or CPI prints, where a one- or two-day move is the thesis. The options market reflects that positioning; TNA’s full-chain put/call ratio sits at 0.80, a modest call skew, with individual expirations swinging from 0.5 on the August 7 weekly to 5.43 on September 4 as hedgers layer in downside protection at specific dates.
Retail sentiment on the underlying, meanwhile, has been cautious. Reddit’s r/options chatter on IWM was bearish on four of eight scored records between July 20 and July 26, 2026, with the lowest sentiment score at 30. That kind of skepticism into a rally is often the setup that keeps leveraged bulls printing gains, at least while the trend holds.
What to Watch Next
The next catalyst is the Russell 2000’s ability to hold above the level that produced TNA’s $74.97 close on August 4. A return to spring’s volatility regime, when the VIX briefly punched through 30, would test whether this year’s compounding advantage can survive a stretch of two-way price action. For now, TNA is doing what it was built to do in a trending market. The five-year chart is a reminder of what happens when the market stops trending.
Contact [email protected] for any questions or corrections.
Jake has been been working in financial media for almost 15 years. He focuses on all things personal finance for 24/7 Wall St. with high hopes to educate and entertain. Most recently, Jake spent 12 years working various roles at The Motley Fool. He started copy editing fool.com content, worked on premium and marketing campaigns, and helped launch The Ascent, a personal finance brand.
His work has been featured on platforms like MSN, Yahoo Finance, USA Today, and more. He's written about credit cards, social security, ETFs, savings accounts, and just about anything else you can imagine when thinking about money. Jake love to cook, play golf, and tell people he's never had a cavity. (It's true!)