[cnxvideo id=”625490″ placement=”ros”]The U.S. housing market improved over the course of 2016. Home purchases are up, foreclosure activity is down, and in a vote of confidence for the U.S. economy, the Federal Reserve announced last year it would hike its benchmark interest rate.
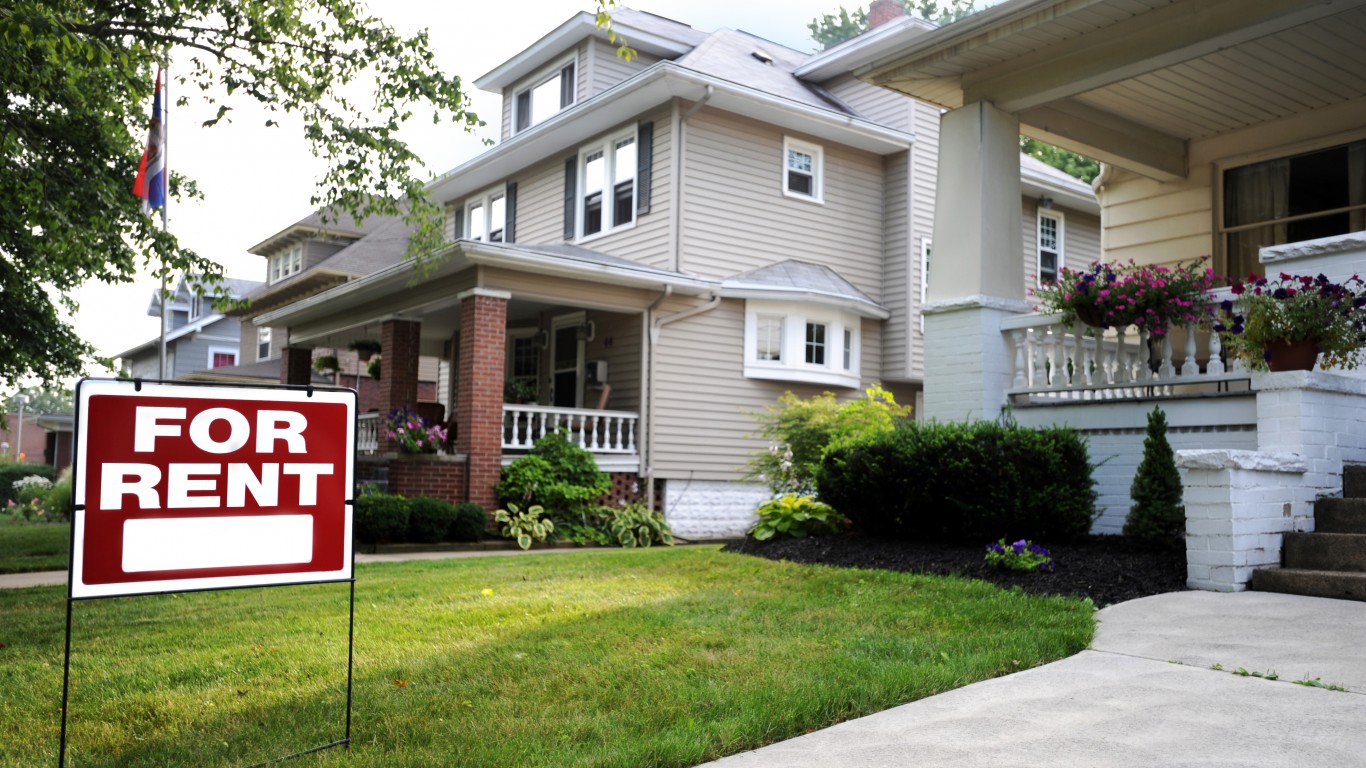
Owning a home — for those who can afford the down payment — continues to be more affordable than renting in most of the United States. Despite the indications of economic strength, rents and home prices are rising faster than wages in most housing markets across the nation.
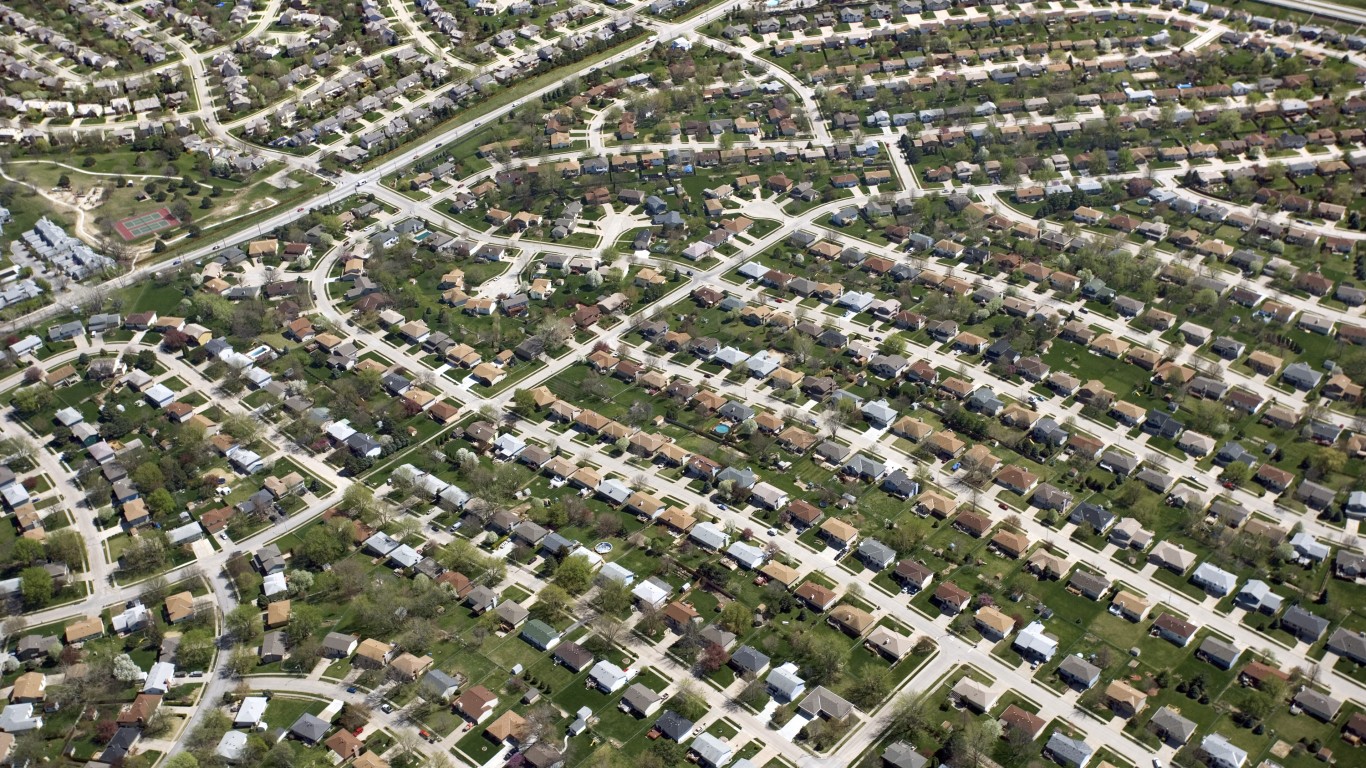
Americans deciding whether to rent, buy, or move usually consider very carefully the timing and location of their potential home purchases. To highlight the regional patterns of the U.S. housing market, 24/7 Wall St. reviewed homeownership and rental affordability measures in over 500 counties nationwide based on a comparison of regional monthly home payments and rents to average monthly wages.
Click here to see the nation’s most affordable housing markets.
The most affordable housing markets are not necessarily the most desirable areas. In fact, low rental costs are often the result of weak demand. Some of the areas on this list include counties such as Madison County, Tennessee, where the typical rent actually declined by 6.4%, versus the average rent increase of over 4% across the more than 500 counties reviewed. The year-over-year rent increase was above that average in only six of the 25 most affordable areas.
In an interview with 24/7 Wall St., Daren Blomquist, senior vice president with property and real estate data company ATTOM Data Solutions, described increasing rent prices as part of a vicious cycle. High home prices encourage more renting, which pushes up the demand and prices for rentals. Eventually, at high enough rental prices, buying becomes more attractive.
This means that in the relatively affordable housing markets where rental prices are increasing slowly or even declining, there is relatively little demand for rental housing. Indeed, in all of these 25 markets, buying is cheaper than renting without exception.
Nationwide, especially in the relatively unaffordable counties on this list, wages are not keeping pace with rising rents and home prices. The pattern holds even in relatively affordable markets. Rent and or home price increases are outpacing wage growth in all but four of the 25 most affordable markets. For Blomquist, this trend is unsustainable. “Eventually, [rising rents and home prices] have to be supported by incomes,” he said.
To identify the most affordable housing markets, 24/7 Wall St. reviewed home affordability and rental affordability for U.S. counties from an analysis by ATTOM Data Solutions of U.S. Department of Housing and Urban Development data. For the ranking, we calculated a weighted average of the homeownership and rental affordability measures in each county, weighted by the percentages of owner- and renter-occupied housing units. Home prices and wage data — used to determine whether home prices or wages or whether rents or wages are rising faster in each market — also came from ATTOM.
Rental affordability is median fair market rent for a three-bedroom property as a percentage of the average monthly wage (based on average weekly wages). Home buying affordability is the monthly house payment for a median-priced home (based on a 3% down payment and including mortgage, property tax, homeowner’s insurance and private mortgage insurance) as a percentage of the average monthly wage.
These are the nation’s most affordable housing markets.
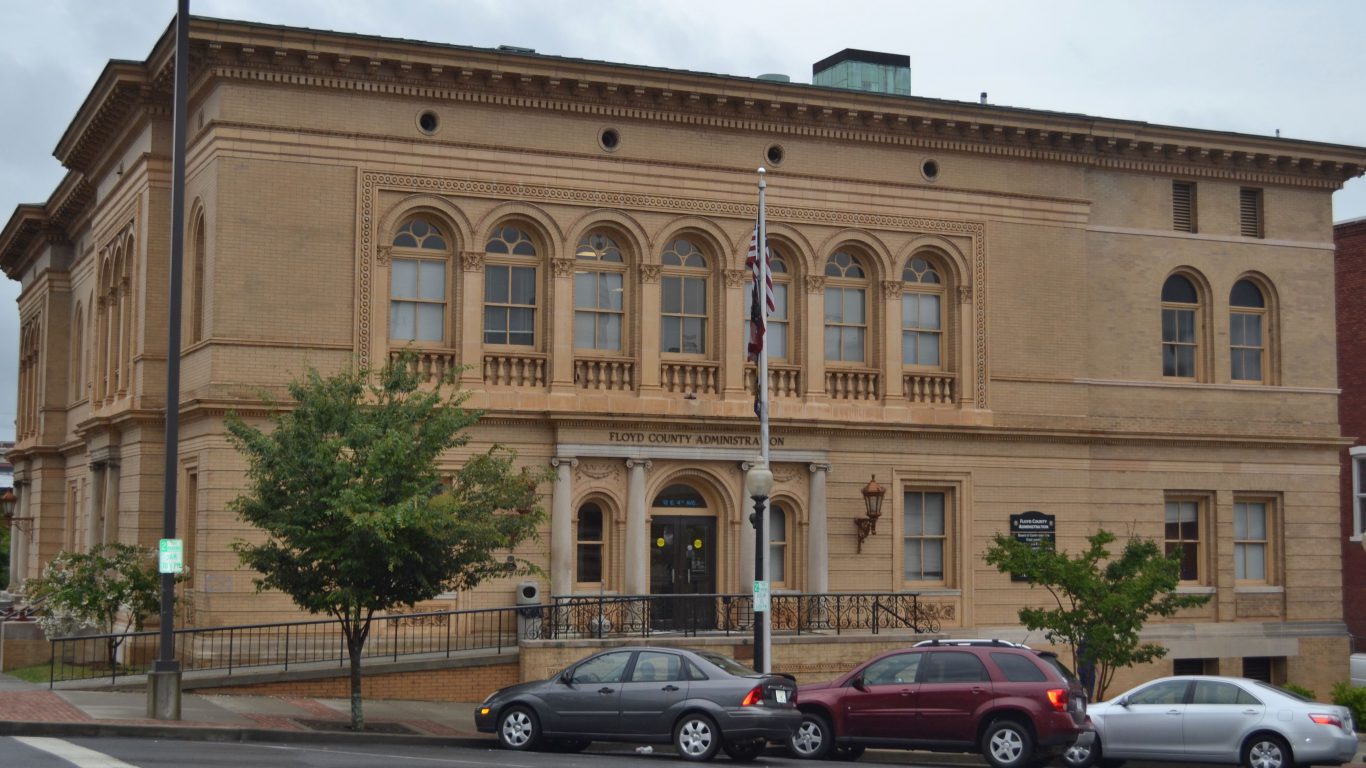
25. Floyd, Georgia
> Ownership cost as % of monthly wage: 18.6% of $3,324
> Rent as % of monthly wage: 28.6% of $3,324
> Home prices or wages rising faster: HOME PRICES
> Rents or wages rising faster: WAGES
[in-text-ad]

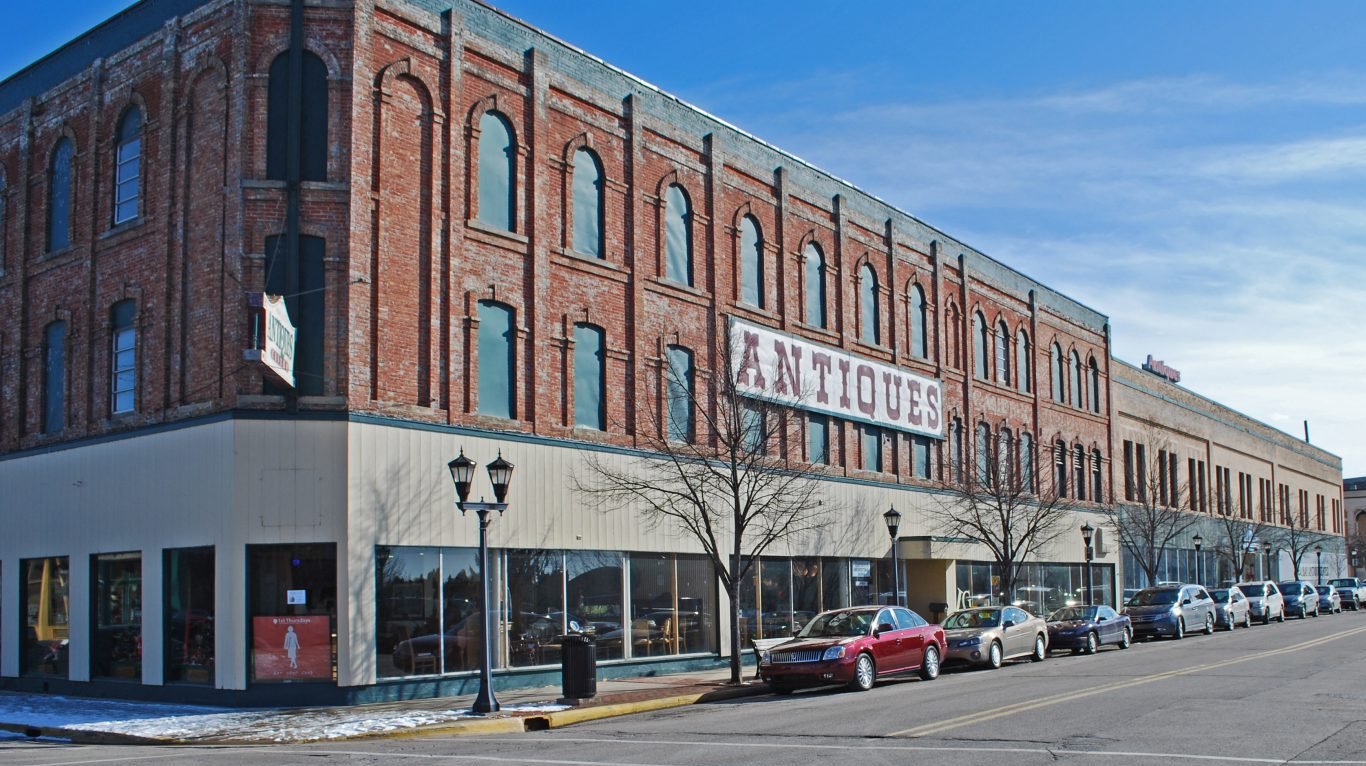
24. Genesee, Michigan
> Ownership cost as % of monthly wage: 20.2% of $3,584
> Rent as % of monthly wage: 28.7% of $3,584
> Home prices or wages rising faster: HOME PRICES
> Rents or wages rising faster: WAGES
[recirclink id=371540]

23. Sheboygan, Wisconsin
> Ownership cost as % of monthly wage: 21.1% of $3,579
> Rent as % of monthly wage: 26.3% of $3,579
> Home prices or wages rising faster: HOME PRICES
> Rents or wages rising faster: RENTS

22. Woodbury, Iowa
> Ownership cost as % of monthly wage: 20.3% of $3,696
> Rent as % of monthly wage: 27.1% of $3,696
> Home prices or wages rising faster: HOME PRICES
> Rents or wages rising faster: WAGES
[in-text-ad-2]
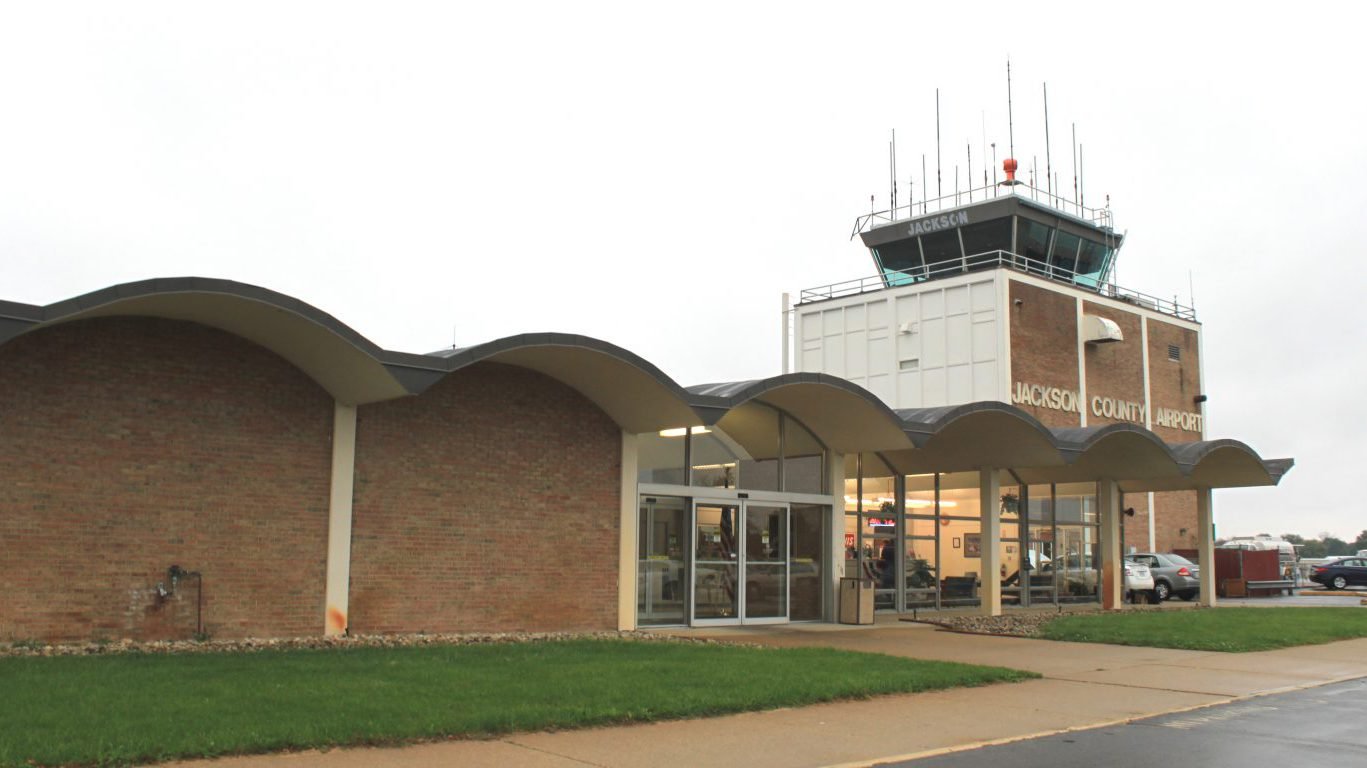
21. Jackson, Michigan
> Ownership cost as % of monthly wage: 19.7% of $3,636
> Rent as % of monthly wage: 29.2% of $3,636
> Home prices or wages rising faster: HOME PRICES
> Rents or wages rising faster: WAGES

20. Madison, Tennessee
> Ownership cost as % of monthly wage: 18.1% of $3,371
> Rent as % of monthly wage: 30.1% of $3,371
> Home prices or wages rising faster: WAGES
> Rents or wages rising faster: WAGES
[in-text-ad]

19. Cuyahoga, Ohio
> Ownership cost as % of monthly wage: 19.9% of $4,312
> Rent as % of monthly wage: 25.5% of $4,312
> Home prices or wages rising faster: HOME PRICES
> Rents or wages rising faster: WAGES
[recirclink id=372572]

18. Clayton, Georgia
> Ownership cost as % of monthly wage: 10.8% of $4,047
> Rent as % of monthly wage: 34.2% of $4,047
> Home prices or wages rising faster: HOME PRICES
> Rents or wages rising faster: RENTS

17. Coffee, Tennessee
> Ownership cost as % of monthly wage: 19.6% of $3,514
> Rent as % of monthly wage: 27.5% of $3,514
> Home prices or wages rising faster: HOME PRICES
> Rents or wages rising faster: RENTS
[in-text-ad-2]

16. Spartanburg, South Carolina
> Ownership cost as % of monthly wage: 20.2% of $3,744
> Rent as % of monthly wage: 26.5% of $3,744
> Home prices or wages rising faster: HOME PRICES
> Rents or wages rising faster: RENTS

15. Richmond, Georgia
> Ownership cost as % of monthly wage: 15.5% of $3,553
> Rent as % of monthly wage: 30.6% of $3,553
> Home prices or wages rising faster: HOME PRICES
> Rents or wages rising faster: RENTS
[in-text-ad]

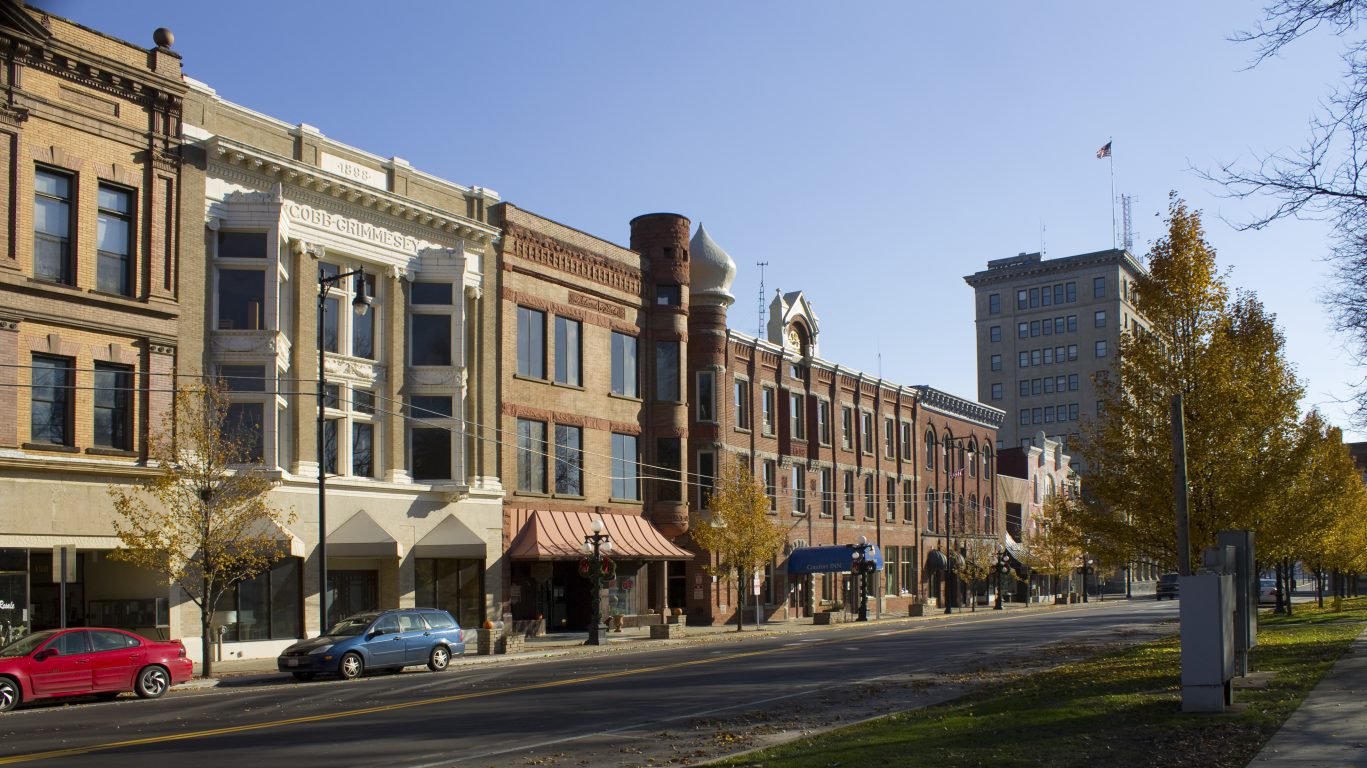
14. Peoria, Illinois
> Ownership cost as % of monthly wage: 20.0% of $4,021
> Rent as % of monthly wage: 25.9% of $4,021
> Home prices or wages rising faster: WAGES
> Rents or wages rising faster: RENTS
[recirclink id=371389]

13. Kanawha, West Virginia
> Ownership cost as % of monthly wage: 19.6% of $3,748
> Rent as % of monthly wage: 26.3% of $3,748
> Home prices or wages rising faster: WAGES
> Rents or wages rising faster: WAGES

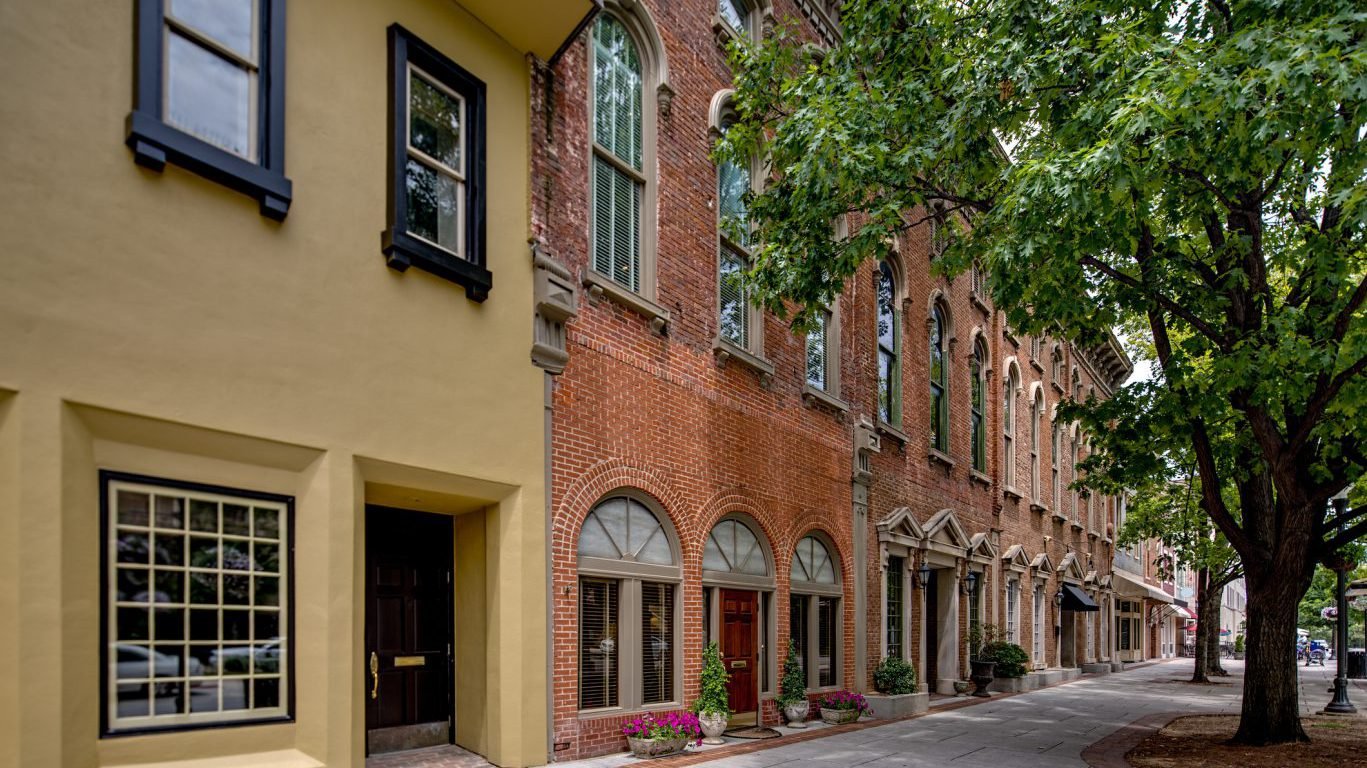
12. Lawrence, Pennsylvania
> Ownership cost as % of monthly wage: 18.3% of $3,133
> Rent as % of monthly wage: 31.4% of $3,133
> Home prices or wages rising faster: HOME PRICES
> Rents or wages rising faster: RENTS
[in-text-ad-2]

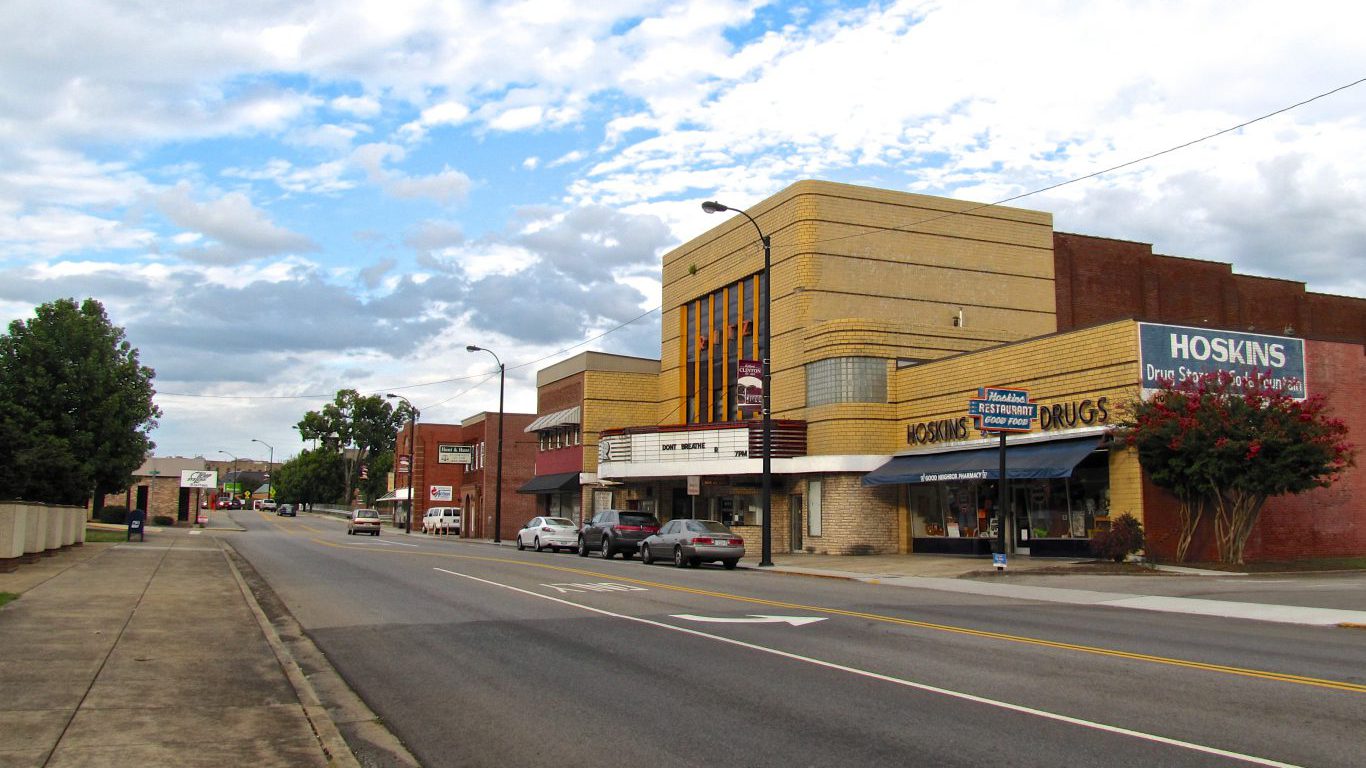
11. Montgomery, Alabama
> Ownership cost as % of monthly wage: 14.1% of $3,614
> Rent as % of monthly wage: 31.4% of $3,614
> Home prices or wages rising faster: WAGES
> Rents or wages rising faster: RENTS
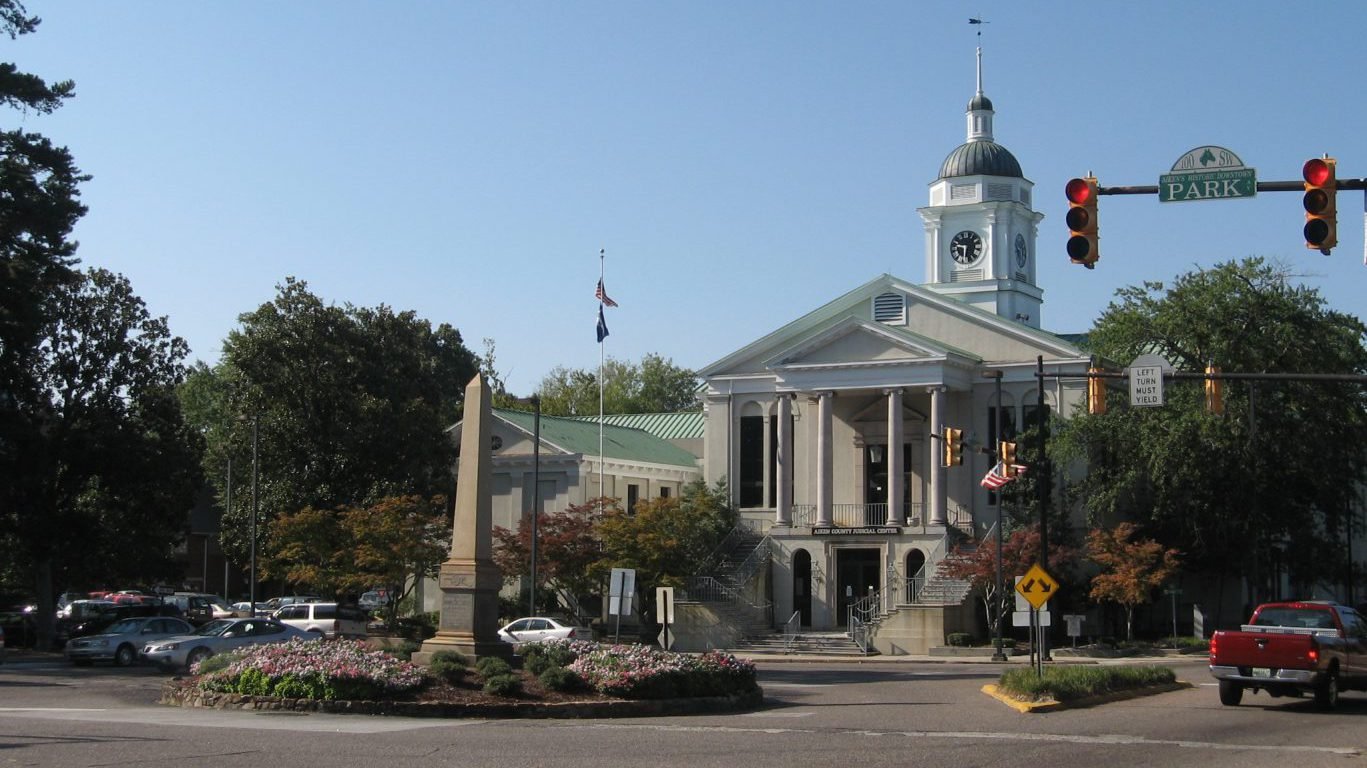
10. Aiken, South Carolina
> Ownership cost as % of monthly wage: 18.7% of $3,896
> Rent as % of monthly wage: 27.9% of $3,896
> Home prices or wages rising faster: HOME PRICES
> Rents or wages rising faster: RENTS
[in-text-ad]
9. Madison, Alabama
> Ownership cost as % of monthly wage: 19.2% of $4,550
> Rent as % of monthly wage: 23.9% of $4,550
> Home prices or wages rising faster: HOME PRICES
> Rents or wages rising faster: RENTS
[recirclink id=372572]

8. Saginaw, Michigan
> Ownership cost as % of monthly wage: 16.4% of $3,410
> Rent as % of monthly wage: 31.0% of $3,410
> Home prices or wages rising faster: HOME PRICES
> Rents or wages rising faster: RENTS
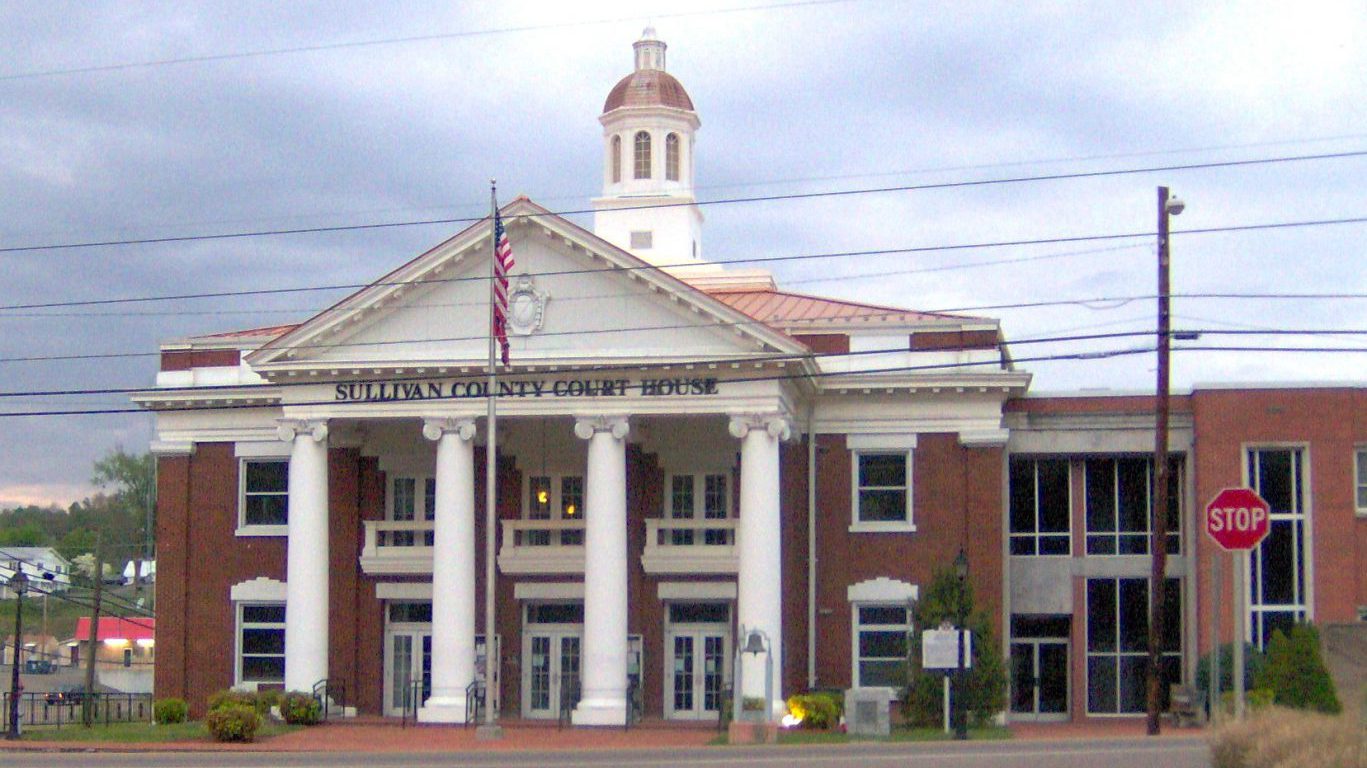
7. Sullivan, Tennessee
> Ownership cost as % of monthly wage: 18.5% of $3,497
> Rent as % of monthly wage: 25.4% of $3,497
> Home prices or wages rising faster: WAGES
> Rents or wages rising faster: WAGES
[in-text-ad-2]
6. Bay, Michigan
> Ownership cost as % of monthly wage: 16.6% of $3,293
> Rent as % of monthly wage: 31.0% of $3,293
> Home prices or wages rising faster: HOME PRICES
> Rents or wages rising faster: RENTS

5. Rock Island, Illinois
> Ownership cost as % of monthly wage: 17.5% of $4,052
> Rent as % of monthly wage: 25.3% of $4,052
> Home prices or wages rising faster: WAGES
> Rents or wages rising faster: RENTS
[in-text-ad]
4. Trumbull, Ohio
> Ownership cost as % of monthly wage: 16.1% of $3,267
> Rent as % of monthly wage: 27.7% of $3,267
> Home prices or wages rising faster: WAGES
> Rents or wages rising faster: WAGES
[recirclink id=370831]

3. Wayne, Michigan
> Ownership cost as % of monthly wage: 14.4% of $4,710
> Rent as % of monthly wage: 27.5% of $4,710
> Home prices or wages rising faster: HOME PRICES
> Rents or wages rising faster: RENTS
2. Anderson, Tennessee
> Ownership cost as % of monthly wage: 16.4% of $4,489
> Rent as % of monthly wage: 25.1% of $4,489
> Home prices or wages rising faster: HOME PRICES
> Rents or wages rising faster: RENTS
[in-text-ad-2]
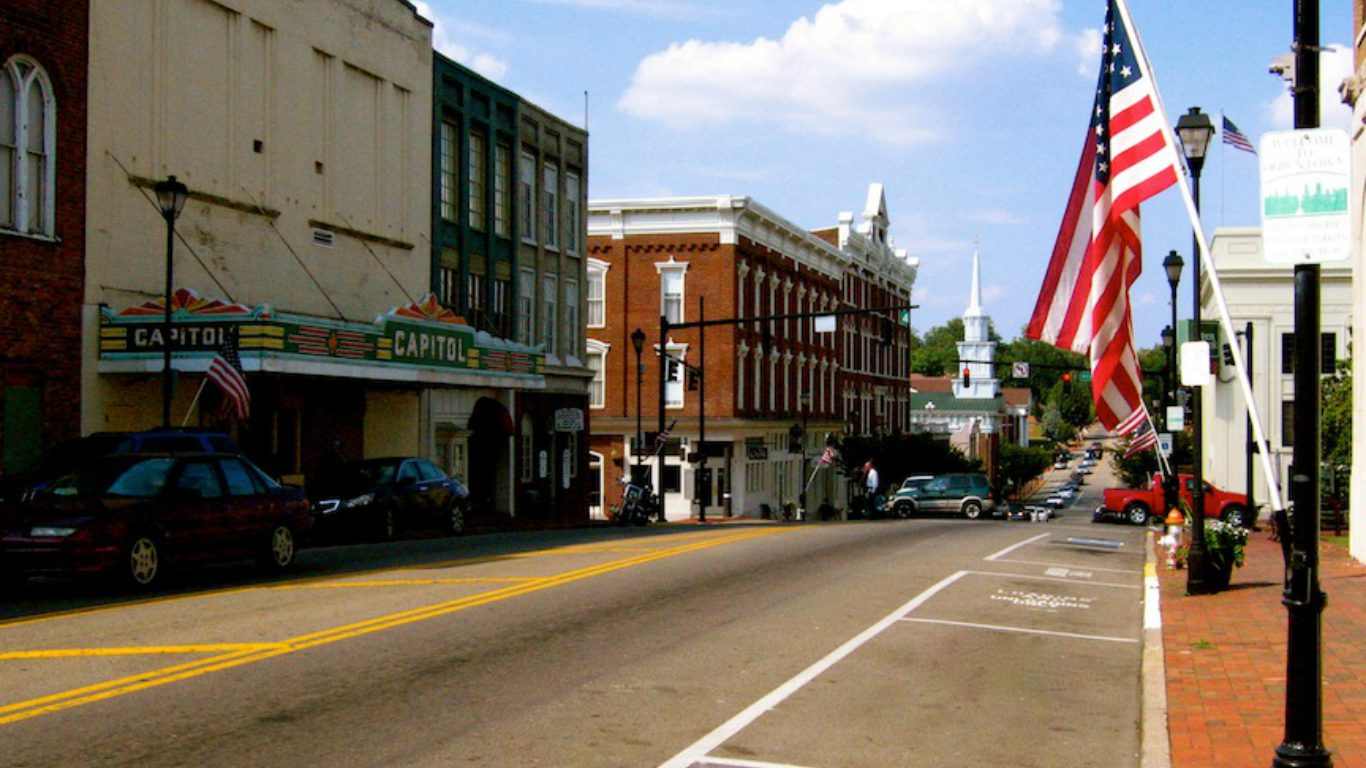
1. Greene, Tennessee
> Ownership cost as % of monthly wage: 14.5% of $3,055
> Rent as % of monthly wage: 29.6% of $3,055
> Home prices or wages rising faster: WAGES
> Rents or wages rising faster: RENTS
Contact [email protected] for any questions or corrections.