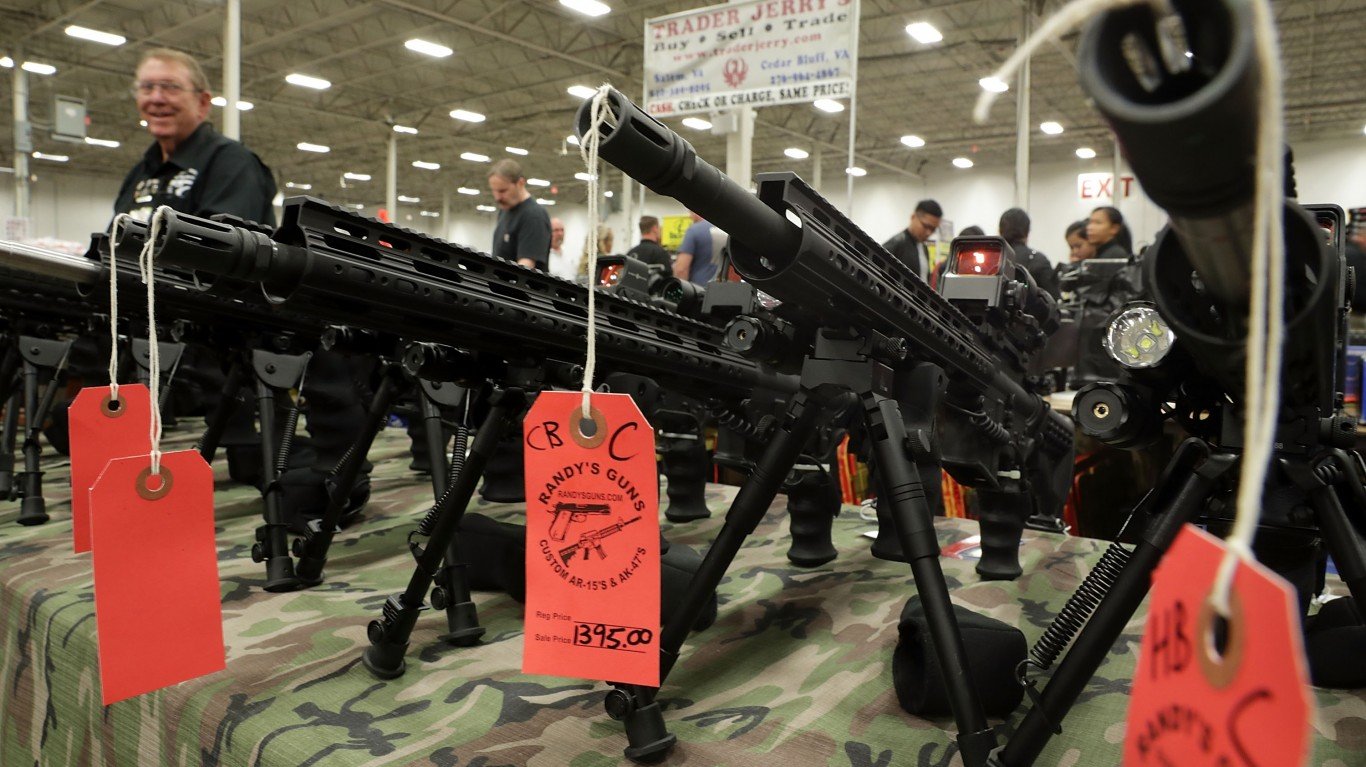
The pace of FBI firearm background checks so far this year is down drastically, by about 9%, from 2016.
Through June 30, the FBI has performed 1.2 million fewer firearm background checks than in the same period in 2016, putting this year on pace for the biggest annual decline in checks since the bureau started collecting the data in 1998, according to the FBI’s National Instant Criminal Background Check System.
Background checks totaled 12.5 million through June 30 from the first six months of 2016, and were well off the pace of 27.5 million for all of 2016, according to NICS statistics. On the state level, background checks declined by as much as 50% year to date. However, they increased in five states by 16% or more.
Click here to see the states with the most gun background checks per capita.
Click here to see our detailed findings and methodology.

50. Hawaii
> 2017 gun registrations per 1,000: 4.2
> 2017 gun registrations: 6,081
> 2016-2017 % chg.: -30.9%
> Gun ownership: 45.1%
> Firearm deaths per 100,000: 3.6
[in-text-ad]

49. New Jersey
> 2017 gun registrations per 1,000: 6.2
> 2017 gun registrations: 55,471
> 2016-2017 % chg.: -8.6%
> Gun ownership: 11.3%
> Firearm deaths per 100,000: 5.4
[recirclink id=398404]

48. New York
> 2017 gun registrations per 1,000: 9.7
> 2017 gun registrations: 191,169
> 2016-2017 % chg.: 0.8%
> Gun ownership: 10.3%
> Firearm deaths per 100,000: 4.2

47. Rhode Island
> 2017 gun registrations per 1,000: 12.3
> 2017 gun registrations: 12,969
> 2016-2017 % chg.: -4.6%
> Gun ownership: 5.8%
> Firearm deaths per 100,000: 4.7
[in-text-ad-2]

46. Maryland
> 2017 gun registrations per 1,000: 13.3
> 2017 gun registrations: 79,776
> 2016-2017 % chg.: 1.7%
> Gun ownership: 20.7%
> Firearm deaths per 100,000: 11.9

45. Massachusetts
> 2017 gun registrations per 1,000: 16.1
> 2017 gun registrations: 109,543
> 2016-2017 % chg.: 0.3%
> Gun ownership: 22.6%
> Firearm deaths per 100,000: 3.0
[in-text-ad]

44. Nebraska
> 2017 gun registrations per 1,000: 18.8
> 2017 gun registrations: 35,699
> 2016-2017 % chg.: -20.7%
> Gun ownership: 19.8%
> Firearm deaths per 100,000: 8.9
[recirclink id=402535]

43. California
> 2017 gun registrations per 1,000: 20.4
> 2017 gun registrations: 798,526
> 2016-2017 % chg.: -30.4%
> Gun ownership: 20.1%
> Firearm deaths per 100,000: 7.7

42. Nevada
> 2017 gun registrations per 1,000: 23.2
> 2017 gun registrations: 66,929
> 2016-2017 % chg.: -9.4%
> Gun ownership: 37.5%
> Firearm deaths per 100,000: 14.9
[in-text-ad-2]

41. Michigan
> 2017 gun registrations per 1,000: 26.2
> 2017 gun registrations: 259,476
> 2016-2017 % chg.: -14.5%
> Gun ownership: 28.8%
> Firearm deaths per 100,000: 11.7

40. Iowa
> 2017 gun registrations per 1,000: 26.4
> 2017 gun registrations: 82,359
> 2016-2017 % chg.: -27.9%
> Gun ownership: 33.8%
> Firearm deaths per 100,000: 7.8
[in-text-ad]

39. Georgia
> 2017 gun registrations per 1,000: 26.4
> 2017 gun registrations: 269,635
> 2016-2017 % chg.: -10.9%
> Gun ownership: 31.6%
> Firearm deaths per 100,000: 14.1
[recirclink id=397755]

38. Texas
> 2017 gun registrations per 1,000: 26.8
> 2017 gun registrations: 737,427
> 2016-2017 % chg.: -14.2%
> Gun ownership: 35.7%
> Firearm deaths per 100,000: 11.7

37. North Carolina
> 2017 gun registrations per 1,000: 27.1
> 2017 gun registrations: 272,323
> 2016-2017 % chg.: -6.2%
> Gun ownership: 28.7%
> Firearm deaths per 100,000: 12.5
[in-text-ad-2]

36. Connecticut
> 2017 gun registrations per 1,000: 27.3
> 2017 gun registrations: 98,128
> 2016-2017 % chg.: -49.6%
> Gun ownership: 16.6%
> Firearm deaths per 100,000: 5.3

35. Delaware
> 2017 gun registrations per 1,000: 28.4
> 2017 gun registrations: 26,834
> 2016-2017 % chg.: -6.5%
> Gun ownership: 5.2%
> Firearm deaths per 100,000: 12.1
[in-text-ad]

34. Arizona
> 2017 gun registrations per 1,000: 28.7
> 2017 gun registrations: 196,069
> 2016-2017 % chg.: -0.1%
> Gun ownership: 32.3%
> Firearm deaths per 100,000: 13.8
[recirclink id=402535]

33. Virginia
> 2017 gun registrations per 1,000: 30.4
> 2017 gun registrations: 255,251
> 2016-2017 % chg.: 6.6%
> Gun ownership: 29.3%
> Firearm deaths per 100,000: 10.9

32. Vermont
> 2017 gun registrations per 1,000: 30.5
> 2017 gun registrations: 19,113
> 2016-2017 % chg.: -2.7%
> Gun ownership: 28.8%
> Firearm deaths per 100,000: 9.6
[in-text-ad-2]

31. Florida
> 2017 gun registrations per 1,000: 31.9
> 2017 gun registrations: 645,889
> 2016-2017 % chg.: -7.9%
> Gun ownership: 32.5%
> Firearm deaths per 100,000: 12.0
30. Kansas
> 2017 gun registrations per 1,000: 32.0
> 2017 gun registrations: 93,112
> 2016-2017 % chg.: 1.2%
> Gun ownership: 32.2%
> Firearm deaths per 100,000: 11.4
[in-text-ad]

29. Louisiana
> 2017 gun registrations per 1,000: 32.5
> 2017 gun registrations: 151,576
> 2016-2017 % chg.: -6.5%
> Gun ownership: 44.5%
> Firearm deaths per 100,000: 20.4
[recirclink id=398427]

28. Ohio
> 2017 gun registrations per 1,000: 33.6
> 2017 gun registrations: 390,177
> 2016-2017 % chg.: -11.8%
> Gun ownership: 19.6%
> Firearm deaths per 100,000: 11.9

27. Maine
> 2017 gun registrations per 1,000: 34.6
> 2017 gun registrations: 46,017
> 2016-2017 % chg.: -10.0%
> Gun ownership: 22.6%
> Firearm deaths per 100,000: 9.8
[in-text-ad-2]

26. New Mexico
> 2017 gun registrations per 1,000: 36.8
> 2017 gun registrations: 76,730
> 2016-2017 % chg.: -3.0%
> Gun ownership: 49.9%
> Firearm deaths per 100,000: 18.6

25. Arkansas
> 2017 gun registrations per 1,000: 37.7
> 2017 gun registrations: 112,415
> 2016-2017 % chg.: -11.2%
> Gun ownership: 57.9%
> Firearm deaths per 100,000: 16.9
[in-text-ad]

24. Mississippi
> 2017 gun registrations per 1,000: 38.5
> 2017 gun registrations: 115,214
> 2016-2017 % chg.: -5.2%
> Gun ownership: 42.8%
> Firearm deaths per 100,000: 19.6
[recirclink id=402535]

23. Oregon
> 2017 gun registrations per 1,000: 41.0
> 2017 gun registrations: 165,321
> 2016-2017 % chg.: 8.6%
> Gun ownership: 26.6%
> Firearm deaths per 100,000: 11.4

22. Oklahoma
> 2017 gun registrations per 1,000: 41.1
> 2017 gun registrations: 160,708
> 2016-2017 % chg.: -8.5%
> Gun ownership: 31.2%
> Firearm deaths per 100,000: 18.0
[in-text-ad-2]

21. Washington
> 2017 gun registrations per 1,000: 41.3
> 2017 gun registrations: 295,984
> 2016-2017 % chg.: -25.5%
> Gun ownership: 27.7%
> Firearm deaths per 100,000: 9.8

20. Pennsylvania
> 2017 gun registrations per 1,000: 41.7
> 2017 gun registrations: 533,701
> 2016-2017 % chg.: -3.1%
> Gun ownership: 27.1%
> Firearm deaths per 100,000: 11.4
[in-text-ad]

19. Missouri
> 2017 gun registrations per 1,000: 41.9
> 2017 gun registrations: 254,612
> 2016-2017 % chg.: -22.5%
> Gun ownership: 27.1%
> Firearm deaths per 100,000: 18.1
[recirclink id=398277]

18. South Carolina
> 2017 gun registrations per 1,000: 43.2
> 2017 gun registrations: 211,372
> 2016-2017 % chg.: 8.2%
> Gun ownership: 44.4%
> Firearm deaths per 100,000: 17.3

17. Colorado
> 2017 gun registrations per 1,000: 43.7
> 2017 gun registrations: 238,725
> 2016-2017 % chg.: -8.6%
> Gun ownership: 34.3%
> Firearm deaths per 100,000: 12.6
[in-text-ad-2]

16. Wyoming
> 2017 gun registrations per 1,000: 44.3
> 2017 gun registrations: 25,946
> 2016-2017 % chg.: -16.4%
> Gun ownership: 53.8%
> Firearm deaths per 100,000: 19.6
15. North Dakota
> 2017 gun registrations per 1,000: 44.5
> 2017 gun registrations: 33,684
> 2016-2017 % chg.: -4.3%
> Gun ownership: 47.9%
> Firearm deaths per 100,000: 12.8
[in-text-ad]

14. Utah
> 2017 gun registrations per 1,000: 46.5
> 2017 gun registrations: 139,303
> 2016-2017 % chg.: -11.0%
> Gun ownership: 31.9%
> Firearm deaths per 100,000: 12.8
[recirclink id=402535]

13. Wisconsin
> 2017 gun registrations per 1,000: 47.9
> 2017 gun registrations: 276,261
> 2016-2017 % chg.: 23.4%
> Gun ownership: 34.7%
> Firearm deaths per 100,000: 10.4

12. Alabama
> 2017 gun registrations per 1,000: 49.0
> 2017 gun registrations: 238,232
> 2016-2017 % chg.: -27.5%
> Gun ownership: 48.9%
> Firearm deaths per 100,000: 19.6
[in-text-ad-2]

11. New Hampshire
> 2017 gun registrations per 1,000: 50.1
> 2017 gun registrations: 66,722
> 2016-2017 % chg.: -18.8%
> Gun ownership: 14.4%
> Firearm deaths per 100,000: 8.9

10. Alaska
> 2017 gun registrations per 1,000: 50.3
> 2017 gun registrations: 37,166
> 2016-2017 % chg.: -7.3%
> Gun ownership: 61.7%
> Firearm deaths per 100,000: 23.4
[in-text-ad]

9. Idaho
> 2017 gun registrations per 1,000: 55.2
> 2017 gun registrations: 91,297
> 2016-2017 % chg.: 22.1%
> Gun ownership: 56.9%
> Firearm deaths per 100,000: 14.7
[recirclink id=397880]

8. South Dakota
> 2017 gun registrations per 1,000: 56.7
> 2017 gun registrations: 48,703
> 2016-2017 % chg.: -6.9%
> Gun ownership: 35.0%
> Firearm deaths per 100,000: 11.1

7. West Virginia
> 2017 gun registrations per 1,000: 58.2
> 2017 gun registrations: 107,321
> 2016-2017 % chg.: -8.7%
> Gun ownership: 54.2%
> Firearm deaths per 100,000: 14.0
[in-text-ad-2]

6. Montana
> 2017 gun registrations per 1,000: 58.5
> 2017 gun registrations: 60,388
> 2016-2017 % chg.: -8.8%
> Gun ownership: 52.3%
> Firearm deaths per 100,000: 19.2

5. Tennessee
> 2017 gun registrations per 1,000: 60.0
> 2017 gun registrations: 396,106
> 2016-2017 % chg.: 16.0%
> Gun ownership: 39.7%
> Firearm deaths per 100,000: 16.0
[in-text-ad]

4. Illinois
> 2017 gun registrations per 1,000: 63.2
> 2017 gun registrations: 812,575
> 2016-2017 % chg.: -16.5%
> Gun ownership: 26.2%
> Firearm deaths per 100,000: 9.5
[recirclink id=402535]

3. Indiana
> 2017 gun registrations per 1,000: 70.0
> 2017 gun registrations: 463,563
> 2016-2017 % chg.: -50.9%
> Gun ownership: 33.8%
> Firearm deaths per 100,000: 12.7

2. Minnesota
> 2017 gun registrations per 1,000: 72.3
> 2017 gun registrations: 396,951
> 2016-2017 % chg.: 30.4%
> Gun ownership: 36.7%
> Firearm deaths per 100,000: 7.4
[in-text-ad-2]

1. Kentucky
> 2017 gun registrations per 1,000: 504.9
> 2017 gun registrations: 2,234,058
> 2016-2017 % chg.: 18.9%
> Gun ownership: 42.4%
> Firearm deaths per 100,000: 15.2
Detailed Findings and Methodology:
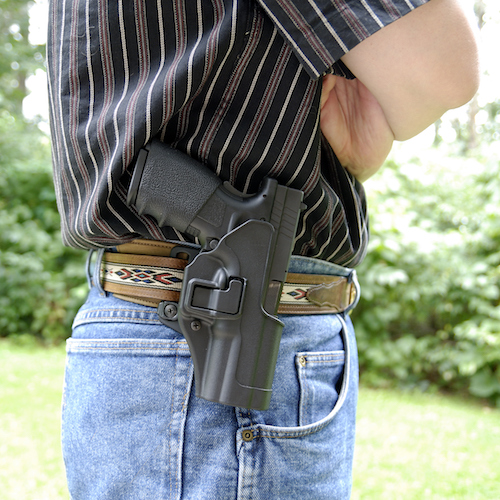
Many gun industry analysts believe background checks serve as a proxy for the strength of gun sales.
Some industry observers believe there was a surge in gun sales in the run-up to the 2016 presidential election out of fear that presidential candidate Hillary Clinton would advocate tougher gun laws.
Kentucky, a state with a population of 4.4 million, is the state with the most background checks — 2.2 million so far this year, according to NICS data. That comes to more than one for every two residents.
Kentucky requires monthly background checks on concealed carry holders. Kentucky firearm vendors must do an NICS background check each time they sell a firearm, unless the buyer has a Kentucky concealed carry permit.
Illinois had the second-highest number of background checks with about 813,000 and California was next with about 799,000. However, when adjusted for population, California has relatively few checks. Minnesota ranked second highest for per capita backgrounds checks.
A study reported in the journal Injury Prevention last year estimated that 300 million Americans owned guns in 2013. According to the data, the highest concentration of these was in the Plains states of Idaho, Montana and Wyoming, along with Arkansas and West Virginia.
Gun ownership in each state was obtained from a study published in 2015 from the Mailman School of Public Health at Columbia University. The survey asked state residents whether they live in a household with at least one firearm of any kind. Firearm death data came from the Centers for Disease Control and Prevention, and are as of 2015.
Contact [email protected] for any questions or corrections.